Abstract
The trace gas carbonyl sulphide (COS) has lately received growing interest in the eddy covariance (EC) community due to its potential to serve as an independent approach for constraining gross primary production and canopy stomatal conductance. Thanks to recent developments of fast-response high-precision trace gas analysers (e.g. quantum cascade laser absorption spectrometers (QCLAS)), a handful of EC COS flux measurements have been published since 2013. To date, however, a thorough methodological characterisation of QCLAS with regard to the requirements of the EC technique and the necessary processing steps has not been conducted. The objective of this study is to present a detailed characterization of the COS measurement with the Aerodyne QCLAS in the context of the EC technique, and to recommend best EC processing practices for those measurements. Data were collected from May to October 2015 at a temperate mountain grassland in Tyrol, Austria. Analysis of the Allan variance of high-frequency concentration measurements revealed sensor drift to occur under field conditions after an averaging time of around 50 s. We thus explored the use of two high-pass filtering approaches (linear detrending and recursive filtering) as opposed to block averaging and linear interpolation of regular background measurements for covariance computation. Experimental low-pass filtering correction factors were derived from a detailed cospectral analysis. The CO2 and H2O flux measurements obtained with the QCLAS were compared against those obtained with a closed-path infrared gas analyser. Overall, our results suggest small, but systematic differences between the various high-pass filtering scenarios with regard to the fraction of data retained in the quality control and flux magnitudes. When COS and CO2 fluxes are combined in the so-called ecosystem relative uptake rate, systematic differences between the high-pass filtering scenarios largely cancel out, suggesting that this relative metric represents a robust key parameter comparable between studies relying on different post-processing schemes.
1. Introduction
The need for understanding human-induced climate change and in this context understanding the pathways and processes determining the global carbon cycle dynamics triggered the increased use of the eddy covariance (EC) method for carbon dioxide (CO2) flux measurements and resulted in the establishment of the first flux measurement network, the EUROFLUX project, in 1996. Today, the EC method is routinely used for measurements of the energy and trace gas exchange between the atmosphere and the biosphere at >500 sites within the FLUXNET project (Baldocchi, 2003; Baldocchi, 2014), mainly focusing on the exchange processes of CO2 and H2O.
By partitioning the biosphere-atmosphere CO2 fluxes (net ecosystem exchange - NEE) into uptake (gross primary productivity – GPP) and release (ecosystem respiration - Reco) it is possible to quantify the two main processes underlying the NEE. To this end, so-called eddy covariance CO2 flux partitioning algorithms are used. They exploit the strong contrast between nighttime release and daytime net uptake of CO2 (Reichstein et al., 2005; Lasslop et al., 2010), based on the extrapolation of nighttime Reco to daytime conditions. The fact that the theoretical models underlying the flux partitioning algorithms are highly simplistic and thus neglect or misinterpret certain processes has caused considerable criticism (Wohlfahrt et al., 2005b; Wohlfahrt and Gu, 2015; Wohlfahrt and Galvagno, 2017). However, to date the resulting GPP and Reco estimates represent the major source for data-driven assessments of the terrestrial carbon cycle (e.g. Beer et al., 2010; Mahecha et al., 2010) and the calibration of carbon cycle models (e.g. Friend et al., 2007).
Carbonyl sulphide (COS or OCS), a trace gas present in the atmosphere with an average mole fraction of 500 ppt, shares a similar pathway during leaf uptake as CO2 with the important difference that no ‘respiration-like’ process, i.e. emission of COS from leaves, has been reported. This co-diffusion with CO2 and the one-way direction of the flux into the land biosphere (Asaf et al., 2013) have been suggested to offer the possibility of using COS as a proxy of gross primary productivity (Seibt et al., 2010; Blonquist et al., 2011), even though bi-directional exchange by soils complicates matters (e.g. Kitz et al., 2017). Ecosystem-atmosphere COS flux measurements were, up to very recently, limited by the availability of appropriate scalar sensors with sufficient time response and sensitivity (Wohlfahrt et al., 2012). Developments of high-precision, fast-response trace gas analyser, like e.g. quantum cascade laser spectrometers (QCLAS), propelled the analysis of COS (Stimler et al., 2010a). Although these new devices are increasingly used for EC measurements (Asaf et al., 2013; Billesbach et al., 2014; Maseyk et al., 2014; Commane et al., 2015), a thorough characterisation of these instruments for flux measurements, an analysis of their limitations and the required corrections has not yet been conducted. So far the available studies have provided minimal methodological detail on the eddy covariance data processing, making it very hard to reproduce their work, which in turn is likely to hamper up-coming cross-site analyses.
In contrast to, for example, trace gas concentrations, for which national and international standards exist to which calibration gases are referenced to, no such standard exists for eddy covariance flux measurements of scalar or vector quantities, making it difficult if not impossible to assess their accuracy (Moncrieff et al. 1996). The best that can be done in such a situation is to compare against independent measurements, for example by assessing the energy balance closure (e.g. Foken, 2008) or by up-scaling soil and leaf level CO2 exchange to the ecosystem scale (e.g. Moncrieff et al. 1996). Alternatively, confidence in flux estimates can be obtained by cross-comparisons of instruments (e.g. Peltola et al., 2014; Rannik et al., 2015) or post-processing schemes (e.g. Mauder et al., 2008; Mammarella et al., 2016). If, as is the case for COS, no independent measurement approach exists, it is critical to at least explore the consequences of different processing steps that are known to cause systematic uncertainties in calculated fluxes (e.g. Sturm et al., 2012) in order to be able to quantify the likely magnitude of any systematic bias. At a recent COS workshop in Finland in September 2016 (Campbell et al., 2017), the lack of clear guidelines for making COS flux measurements and processing the resulting data was identified as a key gap for progress on understanding ecosystem-scale COS exchange.
The aim of this paper is thus to characterize the QCLAS for EC COS flux measurements and to determine the optimal EC processing procedures for its usage. To this end we use measurements obtained above a managed temperate mountain grassland in the Austrian Alps. We particularly focus on high- and low-pass filtering of the high-frequency data, quality assurance and quality control (QA/QC), characterise the random flux uncertainty, and cross-compare our post-processing chain with independent H2O and CO2 flux measurements. Finally, the effects of these processing and filtering steps on obtained COS flux measurements are discussed.
2. Materials and Methods
2.1. Site description
EC flux measurements were conducted during May-October 2015 at the FLUXNET site AT-Neu (http://fluxnet.ornl.gov/site/14), a managed temperate mountain grassland, located on the municipal territory of Neustift (47° 07’ N, 11° 19’ E) in the Stubai Valley, Austria. The site is situated at an elevation of 970 m a.s.l. in the middle of the flat bottom of the Stubai Valley with a homogenous fetch that covers about 37 ha. Dominant daytime and nighttime wind directions are north-east and south-west. The climate is humid continental comprising alpine influences with an average annual temperature of 6.5 °C and an average annual precipitation of 852 mm. The snow-free months usually extend from mid-March to mid-November, leaving a vegetation period of eight months. During 2015, four cutting events took place (on the 2nd of June, 7th of July, 21th of Aug. and 1st of Oct.). For information about vegetation and soil conditions we refer to Wohlfahrt et al. (2005b).
2.2. Eddy covariance
2.2.1. Data acquisition
The three wind components, as well as the sonic temperature, were measured by a 3-axis sonic anemometer (R3IA, Gill Instruments, Lymington, UK) at 2.5 m above ground. Concentrations of H2O and CO2 were measured by two different devices: a closed-path infra-red gas analyser (IRGA) (Li-7000, LICOR Biosciences, Lincoln, USA) and a QCLAS (Aerodyne Mini-QCL, Aerodyne Research Inc., Billerica, USA), additionally measuring COS at a wavenumber of ca. 2056 cm-1. Raw data were acquired on two separate PCs at 20 Hz (sonic anemometer and IRGA) and 10 Hz (QCLAS) using the Eddymeas (MPI Jena, Germany) and TDLWintel (Aerodyne, USA) software, respectively. The two PCs were synchronised in time using the NTP software (Meinberg, Germany).
The QCLAS and associated hardware (thermo cube and vacuum pump) were housed in a climate controlled (ca. 30° C) instrument hut situated near the flux tower. We insulated the QCLAS with XPS-insulating board with openings for necessary ports for additional temperature stabilization and placed the vacuum pump on foam rubber to minimize influences by pump induced vibrations on the laser optics. The QCLAS was operated at a pressure of 20 Torr using a built-in pressure controller and temperature of the optical bench and housing was controlled to 35° C.
Sample air was drawn from the inlet through 15.7 m heated (ca. 40°C) PFA Teflon tubing (4 mm inner diameter) that was installed at the beginning of the measurements in May 2015, through a filter (1-2 µm, PTFE) to the QCLAS at a flow rate of ca. 6.5 l min-1. During the last five minutes of every half-hour, zero-air (N2 5.0, Messer, Vomp, Austria) and span gas (pressurized air, Messer, Vomp, Austria; which was cross-compared against a NOAA standard with 567 ppt COS in air) was switched into the QCLAS in order to determine the stability of the instruments zero and span. The corresponding calibration coefficients were then applied on a half-hourly basis to derive calibrated concentrations.
In order to minimise flux loss, due to vertical and longitudinal sensor separation (Massman, 2000), we installed the intake tube for the QCLAS slightly below and laterally displaced from the sonic anemometer so that horizontal sensor separation was 0.1 m perpendicular to the main wind direction and the vertical sensor separation 0.1 m.
2.2.2. Data processing
Subsetting of the 20 Hz sonic anemometer data to the 10 Hz resolution of the QCLAS data was done by using proprietary software (Hörtnagl et al., 2014) programmed in MATLAB 8.1.0 (R2013a, The MathWorks, Inc, USA). A 2D coordinate rotation was performed according to Kaimal and Finnigan (1994). Using the post processing software EdiRe (University of Edinburgh), eddy fluxes of COS, CO2 and H2O were calculated as the covariance between the rotated vertical wind velocity and the scalar concentrations, using 25 min blocks of data. The QCLAS software applied the necessary spectroscopic corrections to account for the presence of water vapour and also converted concentrations to dry mole fractions (Neftel et al. 2010), avoiding the need for density corrections after Webb et al. (1980) during post-processing. The latter needed to be applied to the CO2 and H2O fluxes measured by the IRGA, assuming that temperature fluctuations were negligible due to sampling through a relatively long intake tube. The storage flux of COS was calculated as the time rate of change in COS molar density at the reference height and was confined to ± 2.7 pmol m-2 s-1 in 93 % of all cases. In the following all fluxes are reported without the storage flux, except for when investigating the underestimation during periods of low turbulence (i.e. u* filtering). Further details on the eddy covariance post-processing are presented in section 3.
The determination of the total random flux uncertainty, which is due to the stochastic nature of turbulence and sensor noise, and the fraction of it that is due to sensor noise followed Langford et al. (2015), for which we refer for further details. Briefly, the approach infers the total random flux uncertainty based on Wienhold et al. (1995). In this approach the random flux uncertainty is calculated as the standard deviation of the cross-covariance at positive and negative lag times far away from the true lag, i.e. when the vertical wind speed and scalar concentrations may be supposed to be completely de-correlated. Following Langford et al. (2015) we used the RMSE instead of the standard deviation. Rannik et al. (2016) assessed the performance of the Wienhold et al. (1995) approach and found that it underestimated the true random flux uncertainty because the cross-covariances at neighbouring lags are not independent and suggest to calculate the standard deviation from cross-covariance estimates at intervals exceeding the integral time scale (e.g. 10 s) over lag times of +/- 100-300 s, a suggestion which we followed. The standard deviation of the sensor noise was derived by linearly extrapolating the scalar auto-covariance function between 1-5 samples lag to zero lag (Langford et al., 2015). Based on that information a synthetic time series with a zero mean and one standard deviation derived from the previous step was generated and together with the true vertical wind speed time series used to calculate a cross-covariance function that would be obtained if there was just sensor noise. The corresponding random flux uncertainty was then derived the same way as the total random flux uncertainty (Langford et al., 2015).
3. Results and Discussion
3.1. Lag-time determination
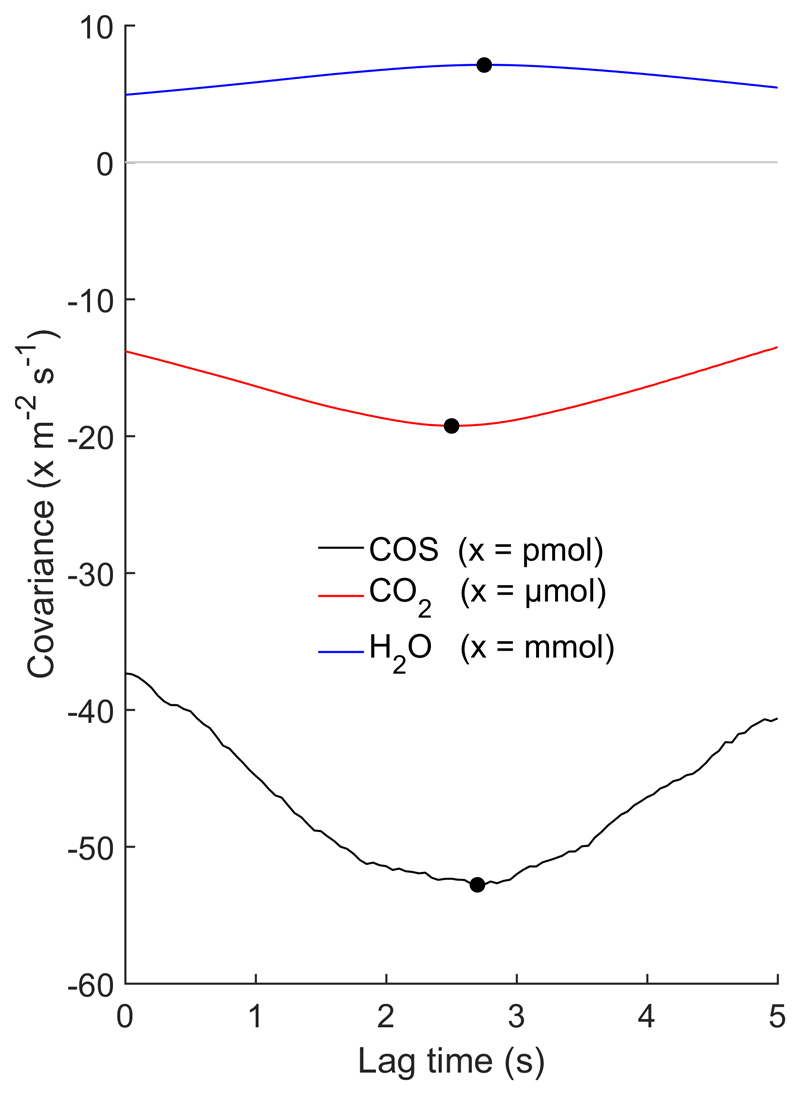
Correcting for the travel time of the gas sample in the intake tube and the resulting lag time of the scalar time series with respect to the vertical wind velocity (lag time determination), is a key post-processing step for closed-path eddy covariance systems (McMillen, 1988). Additional time shifts may occur if the scalar and wind time series are acquired by different data acquisition systems due to drift of the respective clocks. While it would be desirable to avoid such time shifts caused by differing clocks of the data acquisition systems (Langford et al., 2015), we nevertheless chose this approach as preliminary tests showed that the TDLWintel software was unable to keep up the 10 Hz data acquisition rate if the sonic anemometer data were acquired on the same PC. To avoid PC clock drifts we used, based on earlier positive experience (Hörtnagl and Wohlfahrt, 2014, Pierce et al. 2015), a software (NTP, Meinberg, Germany) which kept the clocks synchronized throughout the measurement campaign. As shown in Fig. 1, with this setup the cross correlation functions exhibited clear and, between scalars, consistent peaks (negative for COS and CO2 which exhibit net uptake, positive for H2O which is released to the atmosphere). The resulting lag times were slightly longer than nominal lag times calculated based on tube flow and dimensions (1.9 s), which has been found for other closed-path eddy covariance systems as well and likely reflects unaccounted volumes (e.g. QCLAS cell, filters), horizontal sensor separation and the scalar response time (Massman, 2000). This result illustrates the feasibility and reliability of acquiring scalar and sonic anemometer data on separate PCs provided these are appropriately synchronized.
Figure 1.
The covariance of vertical wind speed with the COS (black line), CO2 (red line) and H2O (blue line) molar density as a function of the (mostly) tube-induced time delay. Lag times in this example were: COS = 2.6 s, CO2 = 2.5 s, H2O = 2.85 s. Data correspond to 05.07.2015 10:00-10:30 am (Central European Time).
3.2. High-pass filtering
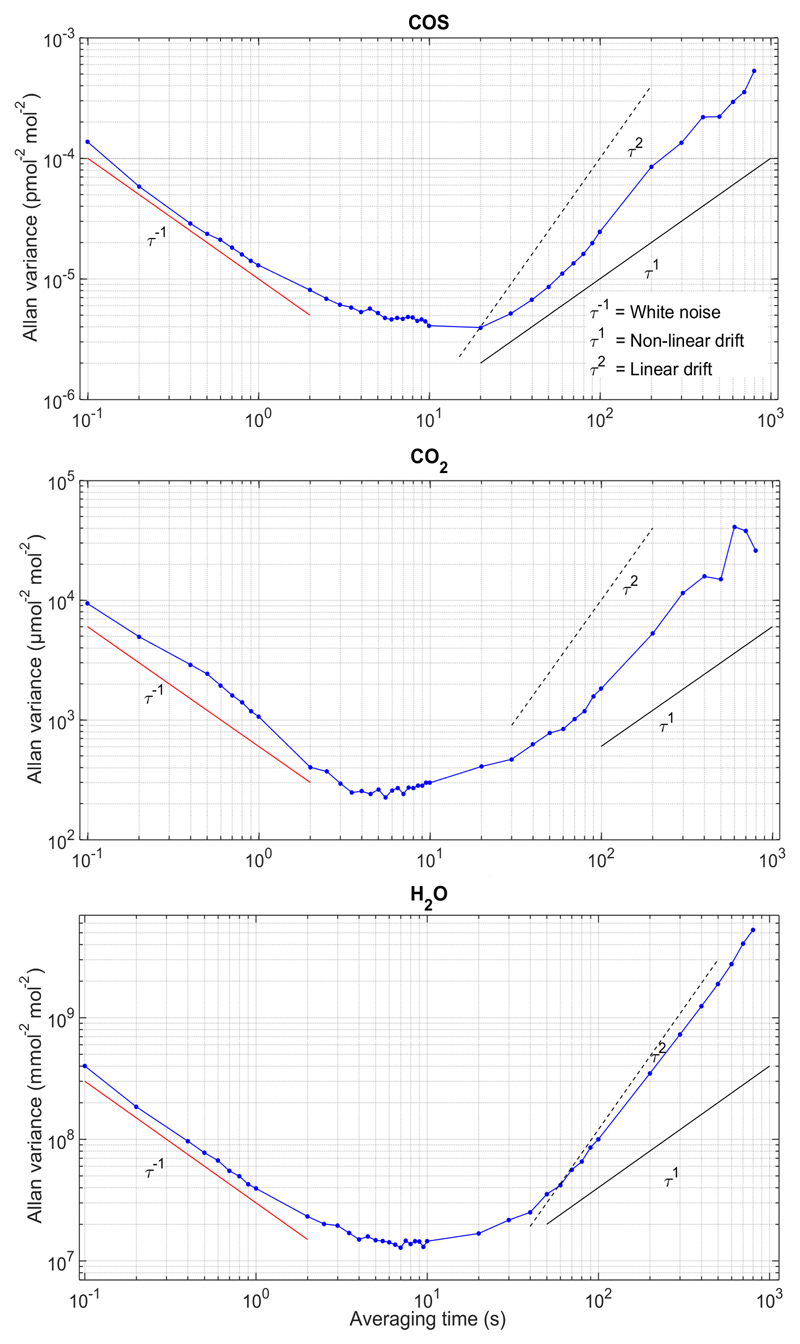
Laser spectroscopy-based eddy covariance flux measurements are well known to be sensitive to sensor drift, which may systematically bias flux estimates, if not corrected for (Kroon et al., 2007; Mammarella et al., 2010). In order to quantify possible drift by the QCLAS we used so-called Allan variance plots (Werle et al., 1993; Werle, 2010, 2011), generated by feeding the QCLAS with pressurized air under ambient conditions in the instrument shelter in the field. As shown in Fig. 2, the system was dominated by white noise up to an averaging time of ca. 10 s and started to drift in an approx. linear fashion after around 50 s. Among the published COS eddy covariance flux studies (Asaf et al., 2013; Maseyk et al., 2014; Billesbach et al., 2014; Commane et al., 2015), this is the first time that QCLAS drift was characterised under field conditions. The Allan variance plot obtained by the manufacturer under laboratory conditions (http://www.aerodyne.com/products/carbonyl-sulfide-monitors) indicates white noise up to ca. 8 s integration time, quite comparable with Fig. 2. At longer integration times, however, the Allan variance plot by the manufacturer exhibits much less increase with increasing averaging time. Most likely, this is the result of less stable thermal conditions in our instrument hut compared to laboratory conditions. This finding highlights the importance of optimising the experimental setup (minimisation of temperature variations, insulation of QCLAS, etc.) for minimising sensor drift in the first place. In order to explore the effects of the drift on flux estimates, the following eddy covariance flux calculations were conducted for three high-pass filtering scenarios commonly used in the literature: (i) block averaging (BA), (ii) linear detrending (LD), and (iii) recursive filtering (RF) with a time constant of 50 s as determined from Fig. 2. In addition, we followed Wehr et al. (2017) and removed the measured instrument offset by linear interpolation between half-hourly background measurements, termed linear background correction (LBC). The latter approach assumes the linear interpolation of half-hourly background measurements (median absolute COS change equal to 20 ppt) to successfully represent any sensor drift, while LD and RF may remove real flux in case of true trends in the ambient concentration time series.
Figure 2.
Plots of the Allan variance (blue symbols and lines) as a function of the averaging time (τ) as described in Werle (2010). The time series was obtained under ambient conditions in the instrument hut in the field by providing pressurized air from a cylinder to the QCLAS. The red line indicates the expected decline of the variance with increasing averaging time in case of white noise, the black dashed and solid lines the expected increase in variance due to non-linear and linear drift, respectively.
3.3. High-frequency correction
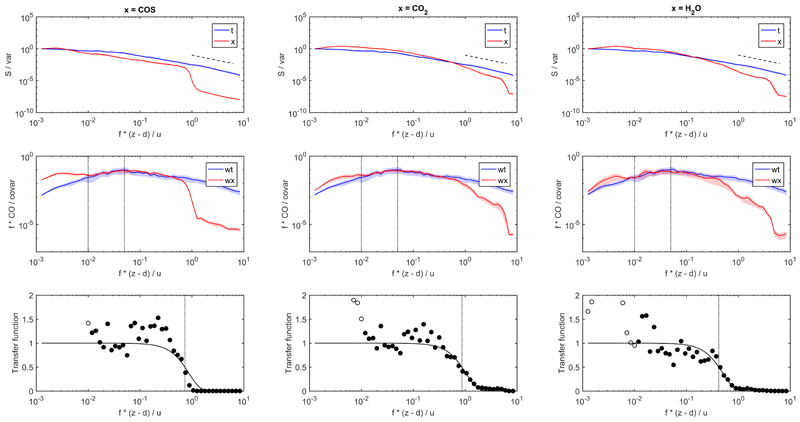
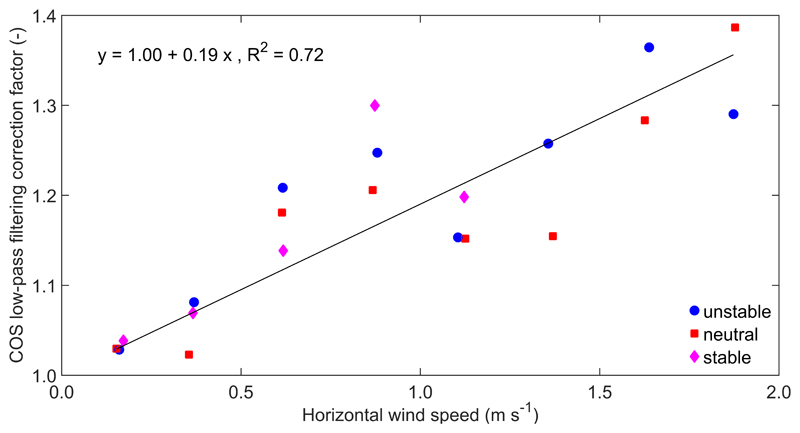
Cospectral analyses, shown for unstable conditions and horizontal wind speeds of 1.00-1.25 m s-1 in Fig. 3, demonstrate the expected high-frequency correction (low-pass filtering) of COS at normalised (natural frequency normalised with the measurement height above the zero-plane displacement height and mean horizontal wind speed) frequencies > 0.5, caused by the combined effects of tube attenuation, limited sensor time response, path averaging and sensor separation (e.g. Moncrieff et al., 1997; Massman, 2000). At normalised frequencies > 1.5, the low-pass filtering effects described above apparently weakened, which coincides with the normalised frequency at which COS power spectra became less dependent of frequency, which suggests an increasing influence of white noise (Eugster et al., 2007). The same behaviour was found for CO2 and H2O, however for these two the effects of low-pass filtering appeared at higher and lower frequencies, respectively, while the onset of noise was confined to the highest frequencies. Similar findings, i.e. noise appearing in the power spectra at natural frequencies > 0.19 Hz, were reported by Eugster et al. (2007) using a QCL for N2O flux measurements above a mixed forest in Switzerland. Figure 3 also shows the ratio of the COS/CO2/H2O to sensible heat cospectra. Recognising that sensible heat cospectra are only marginally affected by low-pass filtering, these ratios represent experimentally derived transfer functions for low-pass filtering of COS, CO2 and H2O. Following Aubinet et al. (2001), each of these transfer functions was fit to a one parameter sigma function by optimising the so-called half-point frequency (indicated by vertical dotted lines in the lowermost panels of Figure 3). By integrating the ratio of the sensible heat cospectrum to the sensible heat cospectrum convoluted with the experimental transfer function, an experimental high-pass filtering correction factor (Aubinet et al. 2001) could be obtained for each species, three stability (z/L < -0.25; -0.25 < z/L < 0.25, z/L > 0.25) and eight wind speed classes (0.25 m s-1 bin size in 0-2 m s-1 range). Consistent with Aubinet et al. (2001), the experimentally derived low-pass filtering correction factors scaled linearly with the horizontal wind speed (Figure 4). Even though low-pass filtering coefficients are expected to be larger for stable compared to unstable/neutral conditions, no such effect was observed. This reflects the findings of Wohlfahrt et al. (2005a), who showed that sensible heat cospectra at this site change much less from unstable/neutral to stable conditions compared to the classical Kaimal cospectra (Kaimal and Finnigan, 1994). Thus a single linear relationship forced through unity was fitted to all experimental low-pass filtering correction factors independent of stability (Fig. 4). These linear relationships explained > 71 % of the variability, with slopes of 0.19 s m-1 (COS), 0.18 s m-1 (CO2) and 0.31 s m-1 (H2O). For comparison, using a closed-path IRGA and similar tubing dimension and flow rate, but half the tube length, Aubinet et al. (2001) obtained slopes of 0.044 and 0.063 s m-1 for CO2 and H2O, respectively. The close correspondence between the slopes for COS and CO2 lends support to other studies (e.g. Wehr et al. 2017), which based low-pass filtering corrections of COS on those determined for CO2. The larger slope (and thus larger low-pass filtering) for H2O compared to COS and CO2 is likely due to interactions of water with the tubing (Ibrom et al. 2007), even though it was heated in this study. A more detailed correction for H2O could be obtained by analysing the dependency of the correction factor on relative humidity, as in Mammarella et al. (2009). The linear relationships with wind speed were then used to correct for low-pass filtering. The overall frequency response corrections included these low-pass filtering corrections, as well as high-pass filtering due to block averaging and linear detrending or recursive filtering (where applicable).
Figure 3.
Spectra (upper panels) and cospectra (middle panels) for temperature (referred to as t and wt) and COS (left column), CO2 (middle column) and H2O (right column) (referred to as x and wx, with x representing the three scalars). Spectra (S) and cospectra (CO) were normalised by their variance (var) and covariance (covar), respectively. The natural frequency (f) was normalised by the measurement height above the zero-plane displacement height (z - d) and the mean horizontal wind speed (u). Solid lines and shaded areas refer to the average and one standard error. Data were filtered for unstable conditions (z/L < -0.25) and wind speeds between 1.00 and 1.25 m s-1. The dashed line in the upper panel indicates the expected -5/3 decay in the inertial subrange. Vertical dotted lines in the middle panel encompass the frequencies between which cospectra were normalized to each other. The lower panels show experimental transfer functions as the ratio of the normalised COS, CO2 and H2O to temperature cospectra. Vertical dotted lines in the lower panels indicate the half-point frequency. Only data indicated by closed symbols in the lower panels were used to estimate the half-point frequency.
Figure 4.
Wind speed dependence of experimentally derived low-pass filtering correction factors for COS. Symbols refer to different stability conditions (unstable: z/L < -0.25; neutral: -0.25 ≤ z/L ≤ 0.25; stable: z/L > 0.25), the solid black line to a linear regression (coefficients and coefficient of determination are indicated in the upper left corner).
3.4. Quality control
For quality control, first, biologically or physically implausible flux values were discarded by percentile filtering, leaving 81 % of the COS (5th – 95th percentile) and 89 % of both the CO2 and H2O (1st – 99th percentile) flux data. See Table 1 for the corresponding flux limits.
Table 1.
List of flags, their limiting values and the percentage of data left after application, for each gas. The first two criteria pertain to all gases and processing scenarios (block averaging (BA), linear detrending (LD), recursive filtering (RF), linear background correction (LBC)).
| Exclusion criteria | Limiting value | Data left (%) | ||||||
|---|---|---|---|---|---|---|---|---|
| Integral turbulence test (%) | ≤ 100 | 99 | ||||||
| Footprint (%) | ≥ 80 | 90 | ||||||
| COS | BA | LD | RF | LBC | BA | LD | RF | LBC |
| Flux range (pmol m-2 s-1) | -91 to 29 | -79 to 19 | -65 to 8 | -100 to 49 | 81 | |||
| u* (m s-1) | 0.08 | 0.10 | 0.12 | 0.09 | 72 | 61 | 53 | 68 |
| Stationarity (%) | ≤ 100 | 67 | 74 | 79 | 68 | |||
| All exclusion criteria | - | 50 | 44 | 39 | 45 | |||
| CO2 | BA | LD | RF | LBC | ||||
| Flux range (µmol m-2 s-1) | -42 to 97 | -35 to 78 | -28 to 42 | - | 89 | - | ||
| u* (m s-1) | 0.12 | 0.12 | 0.14 | - | 55 | 54 | 45 | - |
| Stationarity (%) | ≤ 100 | - | 75 | 78 | 82 | - | ||
| All exclusion criteria | - | 46 | 46 | 40 | - | |||
| H2O | BA | LD | RF | LBC | ||||
| Flux range (mmol m-2 s-1) | -2 to 10 | -0.7 to 10 | -0.3 to 10 | - | 89 | - | ||
| u* (m s-1) | - | - | - | |||||
| Stationarity (%) | ≤ 100 | - | 70 | 74 | 76 | - | ||
| All exclusion criteria | - | 68 | 71 | 73 | - | |||
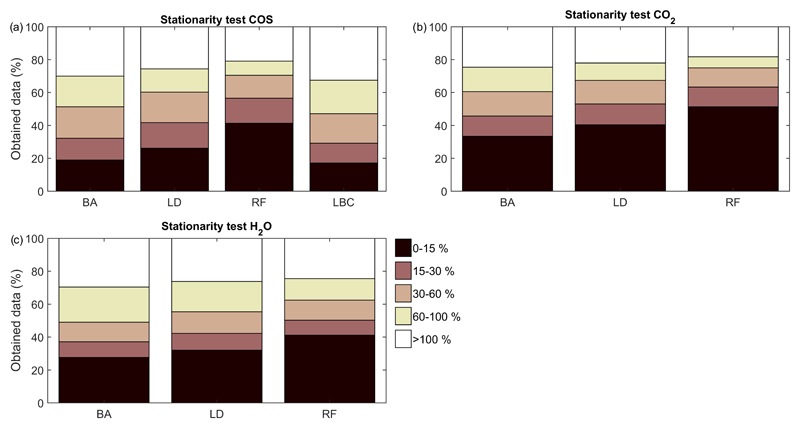
Stationarity, i.e. that the scalar and vertical wind velocity time series and their covariance do not vary over time, is a basic requirement of the eddy covariance method. The stationarity test by Foken and Wichura (1996) assesses how much the covariance deviates (in %) from perfect stationarity by comparing the mean covariance calculated from shorter sub-periods (six 4 min periods in our case) to the 25 min average. Following Foken & Wichura (1996) the results were binned into five classes (0-15 %, 15-30 %, 30-60 %, 60-100 %, >100 % deviation). As shown in Fig. 5, the application of high-pass filtering (LD and RF) compared to block averaging significantly increased the fraction of acceptable data (χ2-test, p = 0.000 for all cases) in the lowest category from 19 % BA to 41 % RF for COS, 33 % BA to 51 % RF for CO2 and 28 % BA to 41 % RF for H2O, and decreased in all other categories. The most prominent decline was observed in the 60-100 % class with 19 % BA to 9 % RF for COS, 15 % BA to 12 % RF for CO2 and 21 % BA to 13% RF for H2O. Allowing a maximum deviation of 100 %, between 67 % (BA) to 79 % (RF) (COS) and 75 % (BA) to 82 % (RF) (CO2) passed the stationarity test (Table 1). The linear background correction (LBC), available only for COS, performed similarly to BA (Table 1).
Figure 5.
Stationarity test after Foken and Wichura (1996) for COS (a), CO2 (b) and H2O (c) fluxes calculated for different high-pass filtering scenarios: block averaging (BA), linear detrending (LD), recursive filtering (RF) and linear background correction (LBC; COS only). The colour coding refers to percentage deviations from perfect stationarity (Foken and Wichura, 1996).
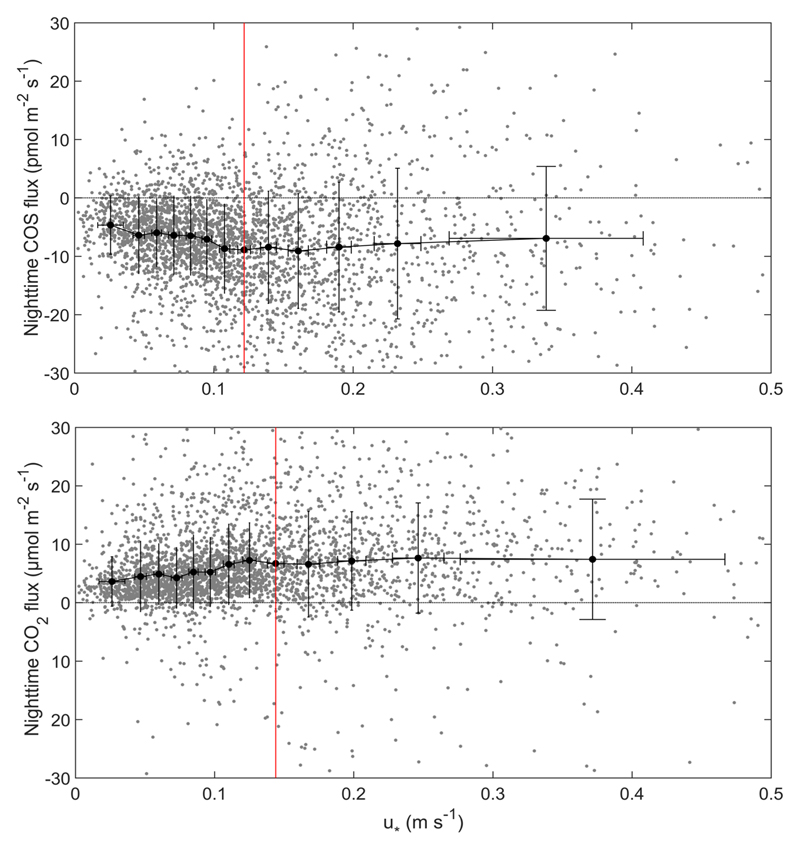
Different authors have shown that during periods of low turbulence and stable stratification, typical nighttime conditions, eddy flux measurements can systematically underestimate ecosystem respiration (Goulden et al., 1996; Aubinet et al., 2000; Papale et al., 2006; Gu et al., 2005; Wohlfahrt et al., 2005a). To assess any underestimation of nighttime (PAR < 5 µmol m-2 s-1) fluxes we plotted CO2 and COS fluxes as a function of the friction velocity (u*) by using a change point detection algorithm (Barr et al., 2013). As shown in Fig. 6, the absolute magnitude of both COS and CO2 fluxes were positively related to friction velocity in the lower range of friction velocities, which is presently understood to indicate insufficient turbulent mixing (Massman and Lee, 2002). Only when fluxes become independent of friction velocity, i.e. for friction velocities higher than 0.12 m s-1 to 0.14 m s-1 (CO2) and 0.09 m s-1 to 0.12 m s-1 (COS), turbulent mixing is deemed sufficient to not result in a systematic underestimation of nighttime fluxes. Using an infrared gas analyser for CO2 flux measurements, Wohlfahrt et al. (2005a) found u* thresholds between 0.1 m s-1 and 0.15 m s-1 for the same study site. Adopting the u* threshold determined for CO2 for COS, as done for example by Commane et al. (2015), thus appears not to result in larger differences. Using these thresholds to filter data, between 28 % - 47 % and 45 % - 55 % of the COS and CO2 fluxes were excluded, respectively, with RF removing the largest and BA the least fraction of data (Table 1).
Figure 6.
Nocturnal COS (upper panel) and CO2 (lower panel) fluxes (inclusive of the storage term) as a function of friction velocity (u*). The flux data, calculated with a recursive filter (RF) using a time constant of 50 s, was divided into 13 bins The u* threshold (vertical red line) was determined on the basis of the change point detection algorithm by Barr et al. (2013).
The following two quality criteria were applied independent of the scalar and high-pass filtering method:
The integral turbulence test (Foken and Wichura, 1996) is able to identify deviations of mechanical turbulence from expected Monin Obukhov similarity theory (Obukhov, 1954), caused for example by flow over complex terrain or flow distortion by measurement infrastructure. Allowing a maximum deviation of 100 %, 1 % of the data was excluded by the integral turbulence test with a larger fraction, mostly during nighttime, being excluded in the sector where the instrument hut is located.
In order to remove unwanted flux contributions by other ecosystem types (forest or settlements) beyond the study site, we used the footprint model by Hsieh et al. (2000) and required 80 % of the flux to originate from within the grassland area, which removed 10 % of all data.
After applying all quality criteria to the data set, between 39 % (RF-COS) and 73 % (RF-H2O) of the data were retained.
3.5. Random flux uncertainty
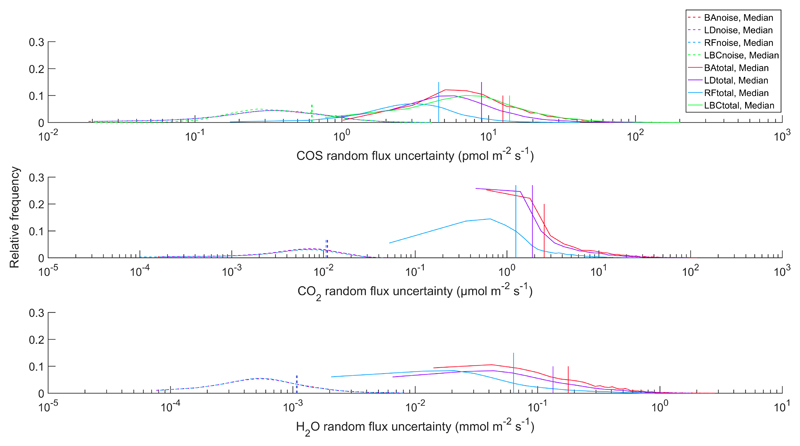
As shown in Figure 7, the total random flux uncertainty (due to the stochastic nature of turbulence and sensor noise) was the smallest for RF, followed by LD and largest with BA (and LBC), i.e. the two high-pass filtering approaches, in particular RF, reduced the random flux uncertainty. As random uncertainties vanish with increasing sample size (Moncrieff et al., 1996), this increases the likelihood of being able to detect relationships between fluxes estimates (e.g. the ecosystem relative uptake rate; Asaf et al., 2013) and between fluxes and environmental conditions. The random flux uncertainty that was due to sensor noise was at least one order of magnitude smaller than the total random flux uncertainty and barely differed between the high-pass filtering scenarios (dashed lines in Figure 7). As a consequence, sensor noise made a relatively larger contribution to the total random flux uncertainty of RF and LD as opposed to BA (and LBC).
Figure 7.
Frequency distribution of calculated total random uncertainties (solid lines) and instrument noise (dashed lines) for COS (upper panel), CO2 (middle panel) and H2O (lower panel) and different high-pass filtering scenarios (block averaging – BA, linear detrending – LD, recursive filtering – RF, LBC – linear background correction). The vertical lines indicate the respective median values.
3.6. Cross-comparison with IRGA CO2 and H2O fluxes
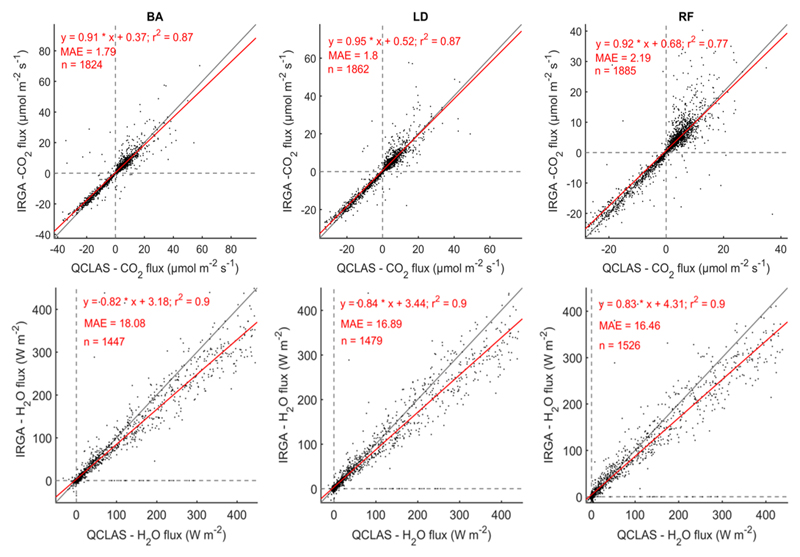
An independent cross-comparison of the entire post-processing chain was conducted by comparison with CO2 and H2O eddy covariance fluxes routinely measured with the closed-path IRGA at the study site. The results are shown in Fig. 8. Both data sets were filtered for flux range, stationarity, footprint and integral turbulence characteristics as described above. IRGA fluxes were calculated based on block averaging only, due to negligible sensor drift. For CO2, the results confirm that the QCLAS is capable of accurately measuring the eddy fluxes as found also by Billesbach et al. (2014), who compared CO2 fluxes measured with the same model of QCLAS and an open-path IRGA. QCLAS-derived H2O fluxes were ca. 15 % higher than those measured with the IRGA, which may be indicative of problems with the closed-path IRGA-based H2O flux measurements (Ibrom et al., 2007) as evident in the lack of energy balance closure (the sum of the latent and sensible heat exchange falling short of the available energy by ca. 25 %; Haslwanter et al. 2009). Possibly, the correspondence could be improved by accounting for variability in relative air humidity in the low-pass filtering corrections, as suggested by Ibrom et al. (2007) or Mammarella et al. (2009). The statistics (R2, MAE) showed only minor differences between the three processing procedures, indicating that our cross-comparison provides no definite outcome in favour for choosing a specific high-pass filter. We however emphasise that this cross-comparison cannot validate the COS fluxes, due to the differences in line strength and noise properties compared to CO2 and H2O.
Figure 8.
Correlation between IRGA and QCLAS CO2 (upper panels) and H2O (lower panels) fluxes using block averaging (BA, left panels), linear detrending (LD, middle panels) and a recursive filter with a 50 s time constant (RF, right panels). The solid grey line indicates the 1:1 line and the solid red line is the geometric mean regression fit. The regression coefficients, the coefficient of determination (r2), the mean absolute error (MAE) and the number of samples (n) are indicated in each panel.
3.7. COS exchange
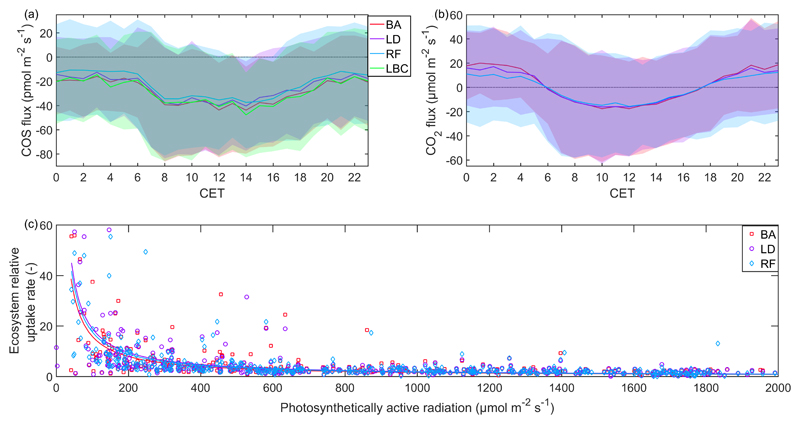
Finally, we investigated how the four processing procedures (BA, LD, RF, LBC) affect the COS flux estimates. As shown in Figure 9a, the mean diurnal cycles of the COS exchange were overall quite similar between the processing options, but RF and, to a lesser degree, LD tended to yield less negative fluxes than BA and LBC. For CO2 fluxes (Fig. 9b), differences between the three processing options (BA, LD, RF) were basically absent during daytime, while during nighttime RF and LD yielded clearly lower fluxes.
Figure 9.
Mean diurnal variation of the COS (a) and CO2 (b) exchange and light dependency of the ecosystem relative uptake rate (c) calculated based on different high-pass filtering scenarios (block averaging – BA, linear detrending – LD, recursive filtering – RF, linear background correction – LBC (COS only)). Data were filtered as described in the text. In addition, data shown in panel c were filtered for negative COS and CO2 fluxes and a leaf area index ≥ 5 m2 m-2. CET stands for Central European Time.
In order to link the COS to the CO2 exchange (e.g. gross primary productivity), a primary motivation for conducting ecosystem-scale COS exchange measurements (Wohlfahrt et al., 2012), the concept of the leaf relative uptake rate (LRU; Sandoval-Soto et al., 2005) has been instrumental (e.g. Asaf et al., 2013). The LRU represents the ratio of the COS to CO2 deposition velocity and has been suggested to converge to a value of ca. 1.7 under conditions of high radiation (Berkelhammer et al., 2014). An emerging pattern, both at the leaf (e.g. Stimler et al. 2010b, 2011) and ecosystem-scale (e.g. Maseyk et al., 2014; Commane et al., 2015; Wehr et al., 2017), is that the LRU and ecosystem relative uptake rate (ERU; the concept of LRU extended to the ecosystem-scale) deviate (increase) from a constant value at low light intensities. This increase is due to the progressive limitation of photosynthesis at low light, which does not affect COS uptake, as the carbonic anhydrase, the enzyme responsible for the hydrolysis of COS, is thought to be light-independent (Wehr et al., 2017). As shown in Figure 9c, the various processing options reproduced the increase of ERU with decreasing incident light, with little differences between BA, LD and RF, suggesting that the underestimation of COS and CO2 fluxes with RF and LD (Figs. 9a and 9b) tends to cancel out in the ERU.
4. Conclusion
Even though the number of published eddy covariance COS flux measurements has increased significantly during the past few years (Asaf et al., 2013; Billesbach et al., 2014; Maseyk et al., 2014; Commane et al., 2015; Wehr et al., 2017), this is the first study to systematically examine the use of QCLAS instruments for making defensible COS flux measurements, the necessary processing steps and QA/QC procedures and characterise the random flux uncertainty.
We found flux measurements to be affected by sensor drift (e.g. Mammarella et al., 2010), which was accounted for using two common high-pass filtering methods, linear detrending (LD) and recursive filtering (RF), and compared these results against flux calculations based on simple block averaging (BA) and by linear removal of regular background measurements (LBC). LD and RF are based on the measured time series only and their application thus risks removing true changes in ambient concentrations and corresponding flux contributions (Mammarella et al., 2010). LBC, in contrast, accounts for changes in the QCLAS background on the basis of half-hourly background measurements and attempts to remove these changes by linear interpolation (Wehr et al., 2017). LBC, even though the Allan variance analysis (Fig. 2) showed drift not to be strictly linear, may thus be considered conceptually superior for correcting for sensor drift. Yet, in this study LBC yielded fluxes that were very close to those calculated with BA (Fig. 9), suggesting that the sensor drift over half-hourly periods (median of absolute COS changes: 20 ppt), had a small effect on inferred fluxes. LD and RF, as expected, yielded fluxes that were lower compared to BA (and LBC), however when COS and CO2 fluxes were combined in the ERU, differences between the high-pass filtering scenarios largely cancelled out. Minor differences between different high-pass filtering methods were also obtained in the cross-comparison with independent IRGA-based CO2 and H2O fluxes (Fig. 8). By using the high-pass filtering operations, LD and RF expectedly increased the fraction of data retained in the stationarity test, but at the same time LD and RF were associated with higher u* thresholds, which caused more nighttime data to be excluded, resulting in overall similar fractions of data retained after QC (Table 1). While high-pass filtering, since it operates at lower frequencies, did not affect the random flux uncertainty due to sensor noise, RF and LD reduced the total random flux uncertainty (due to the stochastic nature of turbulence and sensor noise) compared to BA (and LBC) by the same mechanism that increases stationarity and reduces the flux.
This is the first study to directly address low-pass filtering and u*-filtering for COS eddy covariance flux measurements and shows that previous ad hoc approaches assuming similarity to CO2 appear not to cause systematic bias. Overall, our study thus suggests that previous studies, even though using different post-processing approaches, should be reasonably comparable, in particular with regard to ERU estimates, paving the way for corresponding first cross-site syntheses.
Acknowledgements
This work was funded by the Austrian National Science Fund (FWF) under contract P27176-B16. We thank family Hofer (Neustift, Austria) for kindly granting us access to the study site.
References
- Asaf D, Rotenberg E, Tatarinov F, Dicken U, Montzka SA, Yakir D. Ecosystem photosynthesis inferred from measurements of carbonyl sulphide flux. Nat Geosci. 2013;6:186–190. doi: 10.1038/NGEO1730. [DOI] [Google Scholar]
- Aubinet M, Grelle A, Ibrom A, Rannik U, Moncrieff J, Foken T, Kowalski A, Martin PH, Berbigier P, Bernhofer C, Clement R, et al. Estimates of the annual net carbon and water exchange of forest: The EUROFLUX methodology. Adv Ecol Res. 2000;30:114–173. [Google Scholar]
- Aubinet M, Chermanne B, Vandenhaute M, Longdoz B, Yernaux M, Laitat E. Long term carbon dioxide exchange above a mixed forest in the Belgian Ardennes. Agr Forest Meteorol. 2001;108:293–315. [Google Scholar]
- Baldocchi DD. Assesing the eddy covariance technique for evaluating carbon dioxide exchange rates of ecosystems: past, present and future. Glob Change Biol. 2003;9:479–492. [Google Scholar]
- Baldocchi DD. Measuring fluxes of trace gases and energy between ecosystems and the atmosphere – the state and future of the eddy covariance method. Glob Change Biol. 2014;20:3600–3609. doi: 10.1111/gcb.12649. [DOI] [PubMed] [Google Scholar]
- Barr AG, Richardson AD, Hollinger DY, Papale D, Arain MA, Black TA, Bohrer G, Dragoni D, Fischer ML, Gu L, Law BE, et al. Use of change-point detection for friction–velocity threshold evaluation in eddy-covariance studies, Agricultural and Forest. Meteorology. 2013;171–172:31–45. doi: 10.1016/j.agrformet.2012.11.023. [DOI] [Google Scholar]
- Beer CH, Reichstein M, Tomelleri E, Ciais P, Jung M, Carvalhais N, Rödenbeck Ch, Arain MA, Baldocchi D, Bonan GB, Bondeau A, et al. Terrestrial gross carbon dioxide uptake: Global distribution and covariation with climate. Science. 2010;329:834–838. doi: 10.1126/science.1184984. [DOI] [PubMed] [Google Scholar]
- Berkelhammer M, Asaf D, Still C, Montzka S, Noone D, Gupta M, Provencal R, Chen H, Yakir D. 15 Constraining surface carbon fluxes using in situ measurements of carbonyl sulfide and carbon dioxide. Global Biogeochem Cy. 2014;28:161–179. doi: 10.1002/2013GB004644. [DOI] [Google Scholar]
- Billesbach DP, Berry JA, Seibt U, Maseyk K, Torn MS, Fischer ML, Abu-Naser M, Campbell JE. Growing season eddy covariance measurements of carbonyl sulfide and CO2 fluxes: COS and CO2 relationships in Southern Great Plains winter wheat. Agr Forest Meteorol. 2014;184:48–55. doi: 10.1016/j.agrformet.2013.06.007. [DOI] [Google Scholar]
- Blonquist JM, Jr, Montzka SA, Munger JW, Yakir D, Desai AR, Dragoni D, Griffis TJ, Monson RK, Scott RL, Bowling DR. The potential of carbonyl sulfide as a proxy for gross primary production at flux tower sites. J Geophys Res. 2011;116 doi: 10.1029/2011JG001723. [DOI] [Google Scholar]
- Campbell JL, Kesselmeier J, Yakir D, Berry JA, Peylin P, Belviso S, Vesala T, Maseyk K, Seibt U, Chen H, Whelan ME, et al. Carbon, climate and carbonyl sulfide. EOS. 2017 in press. [Google Scholar]
- Commane R, Meredith LK, Baker IT, Berrye JA, Munger JW, Montzka SA, Templer PH, Juice SM, Zahniser MS, Wofsy SC. Seasonal fluxes of carbonyl sulfide in a midlatitude forest. PNAS. 2015;112:14162–14167. doi: 10.1073/pnas.1504131112. [DOI] [PMC free article] [PubMed] [Google Scholar]
- Eugster W, Zeyer K, Zeeman M, Michna P, Zingg A, Buchmann N, Emmenegger L. Methodical study of nitrous oxide eddy covariance measurements using quantum cascade laser spectrometery over a Swiss forest. Biogeosciences. 2007;4:927–939. [Google Scholar]
- Foken T. The energy balance closure problem: an overview. Ecological Applications. 2008;18:1351–1367. doi: 10.1890/06-0922.1. [DOI] [PubMed] [Google Scholar]
- Foken T, Wichura B. Tools for quality assessment of surface-based flux measurements. Agr. Forest Meteorol. 1996;107:1–48. [Google Scholar]
- Friend A, Arneth A, Kiang N, Lomas M, Ogée J, Rödenbeck Ch, Running SW, Santaren J-D, Sitch S, Viovy N, Woodwards FI, et al. FLUXNET and modelling the global carbon cycle. Glob. Change Biol. 2007;13:610–633. doi: 10.1111/j.1365-2486.2006.01223.x. [DOI] [Google Scholar]
- Goulden ML, Munger JW, Fan S-M, Daube BC, Wofsy SC. Measurements of carbon sequestration by long-term eddy covariance: methods and a critical evaluation of accuracy. Global Change Biology. 1996;2:169–182. [Google Scholar]
- Gu L, Falge EM, Boden T, Baldocchi DD, Black TA, Saleska SR, Suni T, Verma SB, Vesala T, Wofsy SC, Xu L. Objective threshold determination for nighttime eddy flux filtering. Agr Forest Meteorol. 2005;128:179–197. doi: 10.1016/j.agrformet.2004.11.006. [DOI] [Google Scholar]
- Haslwanter A, Hammerle A, Wohlfahrt G. Open- vs. closed-path eddy covariance measurements of the net ecosystem carbon dioxide and water vapour exchange: a long-term perspective. Agr Forest Meteorol. 2009;149:291–302. doi: 10.1016/j.agrformet.2008.08.011. [DOI] [PMC free article] [PubMed] [Google Scholar]
- Hörtnagl L, Wohlfahrt G. Methane and nitrous oxide exchange over a managed hay meadow. Biogeosciences. 2014;11:7219–7236. doi: 10.5194/bg-11-7219-2014. [DOI] [PMC free article] [PubMed] [Google Scholar]
- Hsieh CI, Katul G, Chi TW. An approximate analytical model for footprint estimation of scalar fluxes in thermally stratified atmospheric flows. Adv Water Resour. 2000;23:765–772. [Google Scholar]
- Ibrom A, Dellwik E, Flyvbjerg H, Jensen NO, Pilegaard K. Strong low-pass filtering effects on water vapour flux measurements with closed-path eddy correlation systems. Agr Forest Meteorol. 2007;147:140–156. doi: 10.1016/j.agrformet.2007.07.007. [DOI] [Google Scholar]
- Kaimal JC, Finnigan JJ. Atmospheric boundary layer flows: their structure and measurement. Oxford University Press; Oxford: 1994. p. 289. [Google Scholar]
- Kitz F, Gerdel K, Hammerle A, Laterza T, Spielmann FM, Wohlfahrt G. In situ soil COS exchange of a temperate mountain grassland under simulated drought. Oecologia. 2017;183:851–860. doi: 10.1007/s00442-016-3805-0. [DOI] [PMC free article] [PubMed] [Google Scholar]
- Kroon PS, Hensen A, Jonker HJJ, Zahniser MS, van’t Veen WH, Vermeulen AT. Suitability of quantum cascade laser spectroscopy for CH4 and N2O eddy covariance flux measurements. Biogeosciences. 2007;4:715–728. [Google Scholar]
- Lasslop G, Reichstein M, Papale D, Richardson A, Arneth A, Barr A, Stoy P, Wohlfahrt G. Separation of net ecosystem CO2 exchange into assimilation and respiration using a light response curve approach: critical issues and global evaluation. Glob Change Biol. 2010;16:187–208. [Google Scholar]
- Langford B, Acton W, Ammann C, Valach A, Nemitz E. Eddy-covariance data with low signal-to-noise ratio: time-lag determination, uncertainties and limit of detection. Atmos Meas Tech. 2015;8:4197–4213. doi: 10.5194/amt-8-4197-2015. [DOI] [Google Scholar]
- Mahecha MD, Reichstein M, Carvalhais N, Lasslop G, Lange H, Seneviratne SI, Vargas R, Ammann C, Arain MA, Cescatti A, Janssens IA, et al. Global convergence in the temperature sensitivity of respiration at ecosystem level. Science. 2010;329:383–840. doi: 10.1126/science.1189587. [DOI] [PubMed] [Google Scholar]
- Mammarella I, Launiainen S, Gronholm T, Keronen P, Pumpanen J, Rannik Ü, Vesala T. Relative Humidity Effect on the High-Frequency Attenuation of Water Vapor Flux Measured by a Closed-Path Eddy Covariance System. Journal of Atmospheric and Oceanic Technology. 2009;26:1856–1866. [Google Scholar]
- Mammarella I, Werle P, Pihlatie M, Eugster W, Haapanala S, Kiese R, Markkanen T, Rannik Ü, Vesala T. A case study of eddy covariance flux of N2O measured within forest ecosystems: quality control and flux error analysis. Biogeosciences. 2010;7:427–440. [Google Scholar]
- Mammarella I, Peltola O, Nordbo A, Järvi L, Rannik Ü. Quantifying the uncertainty of eddy covariance fluxes due to the use of different software packages and combinations of processing steps in two contrasting ecosystems. Atmospheric Measurement Techniques. 2016;9:4915–4933. doi: 10.5194/amt-9-4915-2016. [DOI] [Google Scholar]
- Maseyk K, Berry JA, Billesbach D, Campbell JE, Torne MS, Zahniser M, Seibt U. Sources and sinks of carbonyl sulfide in an agricultural field in the Southern Great Plains. PNAS. 2014;111:9064–9069. doi: 10.1073/pnas.1319132111. [DOI] [PMC free article] [PubMed] [Google Scholar]
- Massman WJ. A simple method for estimating frequency response corrections for eddy covariance systems. Agr Forest Meteorol. 2000;104:185–198. doi: 10.1016/S0168-1923(00)00164-7. [DOI] [Google Scholar]
- Massman WJ, Lee X. Eddy covariance flux corrections and uncertainties in long-term studies of carbon and energy exchanges. Agr Forest Meteorol. 2002;113:121–144. [Google Scholar]
- Mauder M, Foken T, Clement R, Elbers JA, Eugster W, Grünwald T, Heusinkveld B, Kolle O. Quality control of CarboEurope flux data – Part 2: Inter-comparison of eddy-covariance software. Biogeosciences. 2008;5:451–462. doi: 10.5194/bg-5-451-2008. [DOI] [Google Scholar]
- McMillen RT. An eddy correlation system with extended applicability to non-simple terrain. Bound-Layer Meteor. 1988;43:231–245. [Google Scholar]
- Moncrieff JB, Massheder JM, de Bruin H, Ebers J, Friborg T, Heusinkveld B, Kabat P, Scott S, Soegaard H, Verhoef A. A system to measure surface fluxes of momentum, sensible heat, water vapor and carbon dioxide. J Hydrol. 1997;188–189:589–611. doi: 10.1016/S0022-1694(96)03194-0. [DOI] [Google Scholar]
- Moncrieff JB, Malhi Y, Leuning R. The propagation of errors in long-term measurements of land-atmosphere fluxes of carbon and water. Global Change Biol. 1996;2:231–240. doi: 10.1111/j.1365-2486.1996.tb00075.x. [DOI] [Google Scholar]
- Monin AS, Obukhov AM. Basic laws of turbulent mixing in the surface layer of the atmosphere. Tr Akad Nauk SSSR Geophiz Inst. 1954;24:163–187. [Google Scholar]
- Neftel A, Ammann C, Fischer C, Spirig C, Conen F, Emmenegger L, Tuzson B, Wahlen S. N2O exchange of managed grassland: Application of a quantum cascade laser spectrometer for micrometeorological flux measurements. Agricultural and Forest Meteorology. 2010;150:775–785. [Google Scholar]
- Papale D, Reichstein M, Aubinet M, Canfora E, Bernhofer C, Kutsch W, Longdoz B, Rambal S, Valentini R, Vesala T, Yakir D. Towards a standardized processing of net ecosystem exchange measured with eddy covariance technique: algorithms and uncertainty estimation. Biogeosciences. 2006;3:571–583. [Google Scholar]
- Peltola O, Hensen A, Helfter C, Belelli Marchesini L, Bosveld FC, van den Bulk WCM, Elbers JA, Haapanala S, Holst J, Laurila T, Lindroth A, et al. Evaluating the performance of commonly used gas analysers for methane eddy covariance flux measurements: the InGOS inter-comparison field experiment. Biogeosciences. 2014;11:3163–3186. doi: 10.5194/bg-11-3163-2014. [DOI] [Google Scholar]
- Pierce AM, Moore CW, Wohlfahrt G, Hörtnagl L, Kljun N, Obrist D. Eddy Covariance Flux Measurements of Gaseous Elemental Mercury Using Cavity Ring-Down Spectroscopy. Environ Sci Technol. 2015;49:1559–1568. doi: 10.1021/es505080z. [DOI] [PubMed] [Google Scholar]
- Rannik Ü, Haapanala S, Shurpali NJ, Mammarella I, Lind S, Hyvönen N, Peltola O, Zahniser M, Martikainen PJ, Vesala T. Intercomparison of fast response commercial gas analysers for nitrous oxide flux measurements under field conditions. Biogeosciences. 2015;12:415–432. doi: 10.5194/bg-12-415-2015. [DOI] [Google Scholar]
- Rannik Ü, Peltola O, Mammarella I. Random uncertainties of flux measurements by the eddy covariance technique. Atmospheric Measurement Techniques. 2016;9:5163–5181. doi: 10.5194/amt-9-5163-2016. [DOI] [Google Scholar]
- Reichstein M, Falge E, Baldocchi D, Papale D, Aubinet M, Berbigier P, Bernhofer Ch, Buchmann N, Gilmanov T, Granier A, Grünwald T, et al. On the separation of net ecosystem exchange into assimilation and ecosystem respiration: review and improved algorithm. Glob Change Biol. 2005;11:1424–1439. doi: 10.1111/j.1365-2486.2005.001002.x. [DOI] [Google Scholar]
- Sandoval-Soto L, Stanimirov M, von Hobe M, Schmitt V, Valdes J, Wild A, Kesselmeier J. Global uptake of carbonyl sulfide (COS) by terrestrial vegetation: Estimates corrected by deposition velocities normalized to the uptake of carbon dioxide (CO2) Biogeosciences. 2005;2:125–132. doi: 10.5194/bg-2-125-2005. [DOI] [Google Scholar]
- Seibt U, Kesselmeier J, Sandoval-Soto L, Kuhn U, Berry JA. A kinetic analysis of leaf uptake of COS and its relation to transpiration, photosynthesis and carbon isotope fractionation. Biogeoscience. 2010;7:333–341. doi: 10.1016/j.agrformet.2005.02.001. [DOI] [Google Scholar]
- Stimler K, Nelson D, Yakir D. High precision measurements of atmospheric concentrations and plant exchange rates of carbonyl sulfide using mid-IR quantum cascade laser. Global Change Biol. 2010a;16:2496–2503. doi: 10.1111/j.1365-2486.2009.02088.x. [DOI] [Google Scholar]
- Stimler K, Montzka SA, Berry JA, Rudich Y, Yakir D. Relationships between carbonyl sulfide (COS) and CO2 during leaf gas exchange. New Phytol. 2010b;186(4):869–878. doi: 10.1111/j.1469-8137.2010.03218.x. [DOI] [PubMed] [Google Scholar]
- Stimler K, Berry JA, Montzka SA, Yakir D. Association between Carbonyl Sulfide Uptake and 18Δ during Gas Exchange in C3 and C4 Leaves. Plant Physiology. 2011;157(1):509–517. doi: 10.1104/pp.111.176578. [DOI] [PMC free article] [PubMed] [Google Scholar]
- Sturm P, Eugster W, Knohl A. Eddy covariance measurements of CO2 isotopologues with a quantum cascade laser absorption spectrometer. Agr Forest Meteorol. 2012;152:73–82. doi: 10.1016/j.agrformet.2011.09.007. [DOI] [Google Scholar]
- Webb EK, Pearman GI, Leuning R. Correction of flux measurements for density effects due to heat and water-vapor transfer. Quarterly Journal of the Royal Meteorological Society. 1980;106:85–100. [Google Scholar]
- Wehr R, Commane R, Munger JW, McManus JB, Nelson DD, Zahniser MS, Saleska SR, Wofsy SC. Dynamics of canopy stomatal conductance, transpiration, and evaporation in a temperate deciduous forest, validated by carbonyl sulfide uptake. Biogeosciences. 2017;14:389–401. doi: 10.5194/bg-14-389-2017. [DOI] [Google Scholar]
- Werle P. Time domain characterization of micrometeorological data based on a two sample variance. Agr Forest Meteorol. 2010;150:832–840. doi: 10.1016/j.agrformet.2009.12.007. [DOI] [Google Scholar]
- Werle P. Accuracy and precision of laser spectrometers for trace gas sensing in the presence of optical fringes and atmospheric turbulence. Appl Phys B. 2011;102:313–329. doi: 10.1007/s00340-010-4165-9. [DOI] [Google Scholar]
- Werle P, Mücke R, Slemr F. The limits of signal averaging in atmospheric trace-gas monitoring by tunable diode-laser absorption spectroscopy (TDLAS) Appl Phys B. 1993;57:131–139. [Google Scholar]
- Wienhold GF, Welling M, Harris GW. Micrometeorological measurement and source region analysis of nitrous oxide fluxes from an agricultural soil. Atmospheric Environment. 1995;29:2219–2227. [Google Scholar]
- Wohlfahrt G, Galvagno M. Revisiting the choice of the driving temperature for eddy covariance CO2 flux partitioning. Agricultural and Forest Meteorology. 2017;237–238:135–142. doi: 10.1016/j.agrformet.2017.02.012. [DOI] [PMC free article] [PubMed] [Google Scholar]
- Wohlfahrt G, Gu L. The many meanings of gross photosynthesis and their implication for photosynthesis research from leaf to globe. Plant Cell Environ. 2015;38:2500–2507. doi: 10.1111/pce.12569. [DOI] [PMC free article] [PubMed] [Google Scholar]
- Wohlfahrt G, Anfang Ch, Bahn M, Haslwanter A, Newesely Ch, Schmitt M, Drösler M, Pfadenhauer J, Cernusca A. Quantifying nighttime ecosystem respiration of a meadow using eddy covariance, chambers and modelling. Agr Forest Meteorol. 2005a;128:141–162. [Google Scholar]
- Wohlfahrt G, Bahn M, Haslwanter A, Newesely Ch, Cernusca A. Estimation of daytime ecosystem respiration to determine gross primary production of a mountain meadow. Agr Forest Meteorol. 2005b;130:13–25. [Google Scholar]
- Wohlfahrt G, Brilli F, Hörtnagl L, Xu X, Bingemer H, Hansel A, Loreto F. Carbonyl sulfide (COS) as a tracer for canopy photosynthesis, transpiration and stomatal conductance: potential and limitations. Plant Cell Environ. 2012;35:657–667. doi: 10.1111/j.1365-3040.2011.02451.x. [DOI] [PMC free article] [PubMed] [Google Scholar]


