Background:
National Strategic Plans (NSPs) for HIV have become foundational documents that frame responses to HIV. Both Global Fund and PEPFAR require coordination with NSPs as a component of their operations. Despite the role of NSPs in country planning, no rigorous assessment of NSP targets and performance outcomes exists. We performed a quantitative analysis of the quality of NSP indicators and targets and assessed whether historical NSP targets had been achieved.
Methods:
All targets and indicators from publicly available NSPs from 35 countries are coded as structural, input, output, or impact indicators. Targets were evaluated for specificity, measurability, achievability, relevance, and being time-bound. In addition, progress toward achieving targets was evaluated using historical NSPs from 4 countries.
Results:
NSPs emphasized output indicators, but inclusion of structural, input, or impact indicators was highly variable. Most targets lack specificity in target population, numeric baselines or targets, and a data source for monitoring. Targets were, on average, 205% increases or decreases relative to baselines. Alignment with international indicators was variable. Metrics of indicator quality were not associated with NSP funding needs. Monitoring of historical NSP targets was limited by a lack of defined targets and available data.
Conclusions:
Country NSPs are limited by a lack of specific, measurable, and achievable targets. The low achievement of targets in historical NSPs corroborates that targets are often poorly defined and aspirational, and not linked to available data sources. NSP quality may be improved through better use of programmatic data and greater inclusion of targets for process measures.
Key Words: National Strategic Plans, HIV, AIDS, Africa, monitoring, evaluation
INTRODUCTION
National Strategic Plans (NSPs) for HIV are foundational documents that frame the national response to HIV. These documents, written by or on behalf of the Ministry of Health, National AIDS Commission, or similar body, describe the current state of the epidemic and strategic government actions to address HIV in the ensuing 5 years and include a set of indicators to measure progress toward these goals. This overarching NSP structure is descended from early guidance from The Joint United Nations Programme on HIV/AIDS (UNAIDS) for strategic planning, which proposed a “management by objectives” process in which country teams identify desired strategic outcomes and develop stepwise targets for their achievement.1
Both the Global Fund2 and the United States President's Emergency Plan for AIDS Relief (PEPFAR)3 require coordination with NSPs as part of their funding processes. Because of the Global Fund's emphasis on a country-led response, NSPs are a central component of the application for support from the Global Fund. In its guidance, the Global Fund recommends that countries base their funding requests (including targets and objectives) on their NSP to ensure that the funding be integrated with larger strategic planning.1 In addition, an NSP costing exercise is used as the basis for a financial gap analysis that is included in Global Fund concept notes. The Global Fund specifically recommends that NSPs be developed through partnerships with appropriate stakeholders, reflect international guidance, and be based on disaggregated epidemiological data.4 Technical assistance for NSP development is available on request through Global Fund and its partners.5 In addition to using NSPs during the application process, the Global Fund regularly monitors the alignment of supported programs with national strategies as part of its Strategic Key Performance Indicator Framework.6
NSPs are also considered as part of PEPFAR's Country Operational Plan planning process, although their role is less significant compared with Global Fund planning. PEPFAR's Country Operational Plan guidance instructs its country teams to ensure alignment with national plans and to adjust activities according to the current NSP. In addition, teams have the flexibility to use NSP indicators in the place of, or in addition to, other PEPFAR indicators.2
In addition, NSPs serve as a mechanism to align international target setting with country planning. For example, after the release of the Millennium Development Goals, the United Nations released guidance urging countries to develop “MDG-based national development strategies” with bolder interventions and more ambitious goals to achieve the MDGs.7 Today, NSPs can serve as an important means to align country planning and priorities with the Sustainability Development Goals, the Global AIDS Monitoring indicators, or the UNAIDS 90–90–90 targets.
Despite the central role of these plans, NSPs have received criticism for both quality and scope. Past cross-country and country-specific analyses of NSPs have found that these plans are frequently too narrow in their inclusion of interventions and indicators that concern key populations, including men who have sex with men, women, and girls.8–11 Similarly, although a review of 14 NSPs found widespread inclusion of human rights principles, these were rarely included in the monitoring framework or linked to specific actions.12 A 2007 UNAIDS review of NSP development in Eastern and Southern Africa warned that few NSPs were truly “results-focused,” with most NSPs lacking clear objectives and goals that were supported by measurable indicators.13 The weaknesses identified in this analysis caution against the use of NSPs as a tool for grant applications or monitoring and evaluation. Furthermore, these shortcomings may ultimately hinder the ability of countries to achieve their targets.
To our knowledge, no publicly available assessment of indicator quality has been performed since this UNAIDS report in 2007, nor any multicountry evaluation of previous performance. Global Fund does not systematically review the quality of NSPs, despite their serving as the basis for concept note and funding request development. Furthermore, although several countries release interim and final progress reports on achieving NSP targets, no recent cross-country assessment of NSP target quality and progress has been performed. This analysis fills an important gap in the literature by providing a contemporary and quantitative analysis of the quality of indicators and targets in the NSPs for all high HIV burden countries. In addition, an analysis of progress toward historical NSP targets using current data is presented.
METHODS
NSPs for HIV from the 37 countries with generalized HIV epidemics (as defined by HIV prevalence greater than 1.0%) and current eligibility for Global Fund support for HIV14 were included in this assessment. Two countries without publicly available NSPs (Jamaica and South Sudan) were excluded from the analysis, for a final sample of 35 NSPs. The most recent and available NSPs were used in this analysis, with all except Angola, Benin, Cape Verde, Equatorial Guinea, Ghana, Mali, and Suriname produced in 2010 or later. Non-English NSPs were translated to English by the research team. More recent NSPs may exist in some cases, but these were either not discovered by the investigators or were not publicly available. Because of the variable structure of NSPs, all indicators and targets were manually extracted. Most indicators and targets appeared in indexes but were in some cases identified through assessing the narrative sections of NSP. In those cases where indicators included separate, disaggregated targets for multiple population groups, the indicators were coded as separate indicators to allow for separate analysis of the targets.
Indicators were first categorized using an adapted version of the World Health Organization monitoring and evaluation of health systems strengthening framework.15 In this modified framework, indicators are first coded as “structural” or “nonstructural,” with the former including indicators relating to health systems, governance, and policy. Nonstructural indicators were further subclassified as relating to either HIV prevention (interventions to prevent new infections) or treatment (interventions for treatment, care, and support for people living with HIV). Nonstructural indicators were also subclassified according to 3 levels of service delivery: inputs and processes; outputs and outcomes; and impact. Input indicators include investments into programs (eg, inventory of rapid tests for HIV, school-based educational programs, or number of organizations implementing prevention programs in the workplace). Output and outcome indicators include the number of condoms, the uptake of HIV testing, or behavioral changes to prevent new infections. Finally, impact indicators include epidemiological measures, such as incidence, prevalence, and viral suppression. Impact indicators did not differentiate between prevention and treatment, as both prevention and treatment interventions often produce impact simultaneously and indistinguishably.
In the second phase, NSP indicators and targets were categorized using the SMART framework for setting goals and objectives.16 Nonstructural indicators were evaluated based on the framework's 5 criteria (specificity, measurability, achievability, relevance, and being time-bound). All targets in this assessment were considered time-bound by the NSP's specified 3–5-year period; as such, this criterion was not assessed. Structural indicators were evaluated based on relevance only, as these indicators cannot be appropriately or sufficiently evaluated based on their specificity, measurability, and achievability; eg, many targets for structural indicators are binomial (yes/no), and additionally will not have different results by population group (and therefore are not suited to being disaggregated).
Specificity was assessed by identifying whether each indicator listed a target subpopulation (sex, age or age category, or high-risk population group), as high-quality indicators should explicitly identify which individuals will receive an intervention, as well as the population in which progress will be measured. Indeed, vague indicators risk programs being delivered to populations that are not at the greatest need or may result in an entirely separate population being measured in monitoring and evaluation processes. Indicators with neither a baseline nor a target were categorized by default as not disaggregated, regardless of indicator description.
Measurability was evaluated by 2 criteria: whether an indicator includes a numeric baseline or target value, and whether an indicator has an explicitly identified data source for baseline or target monitoring. Targets that are represented as percentage changes (eg, “50% increase in the number of PLHIV receiving antiretroviral therapy”) were categorized as nonnumeric unless a baseline value was included.
Achievability (and ambitiousness) was evaluated by comparing the numeric baseline and target values. For indicators that included both numeric and baseline targets, we calculated the percent numeric increase or decrease of the target relative to baseline. Indicators that did not include both a numeric target and baseline could not be measured and are therefore excluded from this measure.
Based on the World Health Organization guidance and for cross-comparability, the relevance of both structural and nonstructural indicators was measured by identifying the number of international targets included in the NSPs; specifically, the Global Fund core outcome and impact indicators and 2010 United Nations General Assembly Special Session on HIV/AIDS (UNGASS) indicators were identified.17,18 Regardless of whether NSPs predated these documents, these indicators were used for comparison because of their alignment with earlier international targets, such as the Millennium Development Goals. In addition, in the 5 countries with NSPs from 2015 or later, the inclusion of the UNAIDS 90–90–90 indicators was assessed.
In the third phase of the analysis, the funding needs of the NSP and the calculated financial gap were extracted from Global Fund concept notes. For combined HIV and tuberculosis concept notes, only the funding gap for the HIV component is included. Although not routinely described in the NSPs themselves, this measure is included in all concept notes and is derived from an analysis of the interventions planned in the NSPs. Countries that have not submitted concept notes under the New Funding Model were excluded from this portion of the analysis.
Finally, 4 countries (Botswana, Kenya, Malawi, and South Africa) were selected for an in-depth evaluation of country progress toward achieving NSP targets. These countries were chosen based on 3 criteria: (1) the availability of government-produced NSP progress reports; (2) a generalized epidemic with a total population of HIV prevalence greater than 5%19; and (3) receipt of Global Fund grants in the latest round of funding (2015–2017). The list of indicators, targets, and progress toward targets was manually extracted from the NSPs and the NSP progress reports as described above. Targets were classified as being achieved, or on track to being achieved by the end of the NSP period, if the target had been reached or surpassed, or if a linear extrapolation of the progress report data predicted achievement by the end of the NSP period.
All analyses were performed using Stata/IC, version 14.1.20
RESULTS
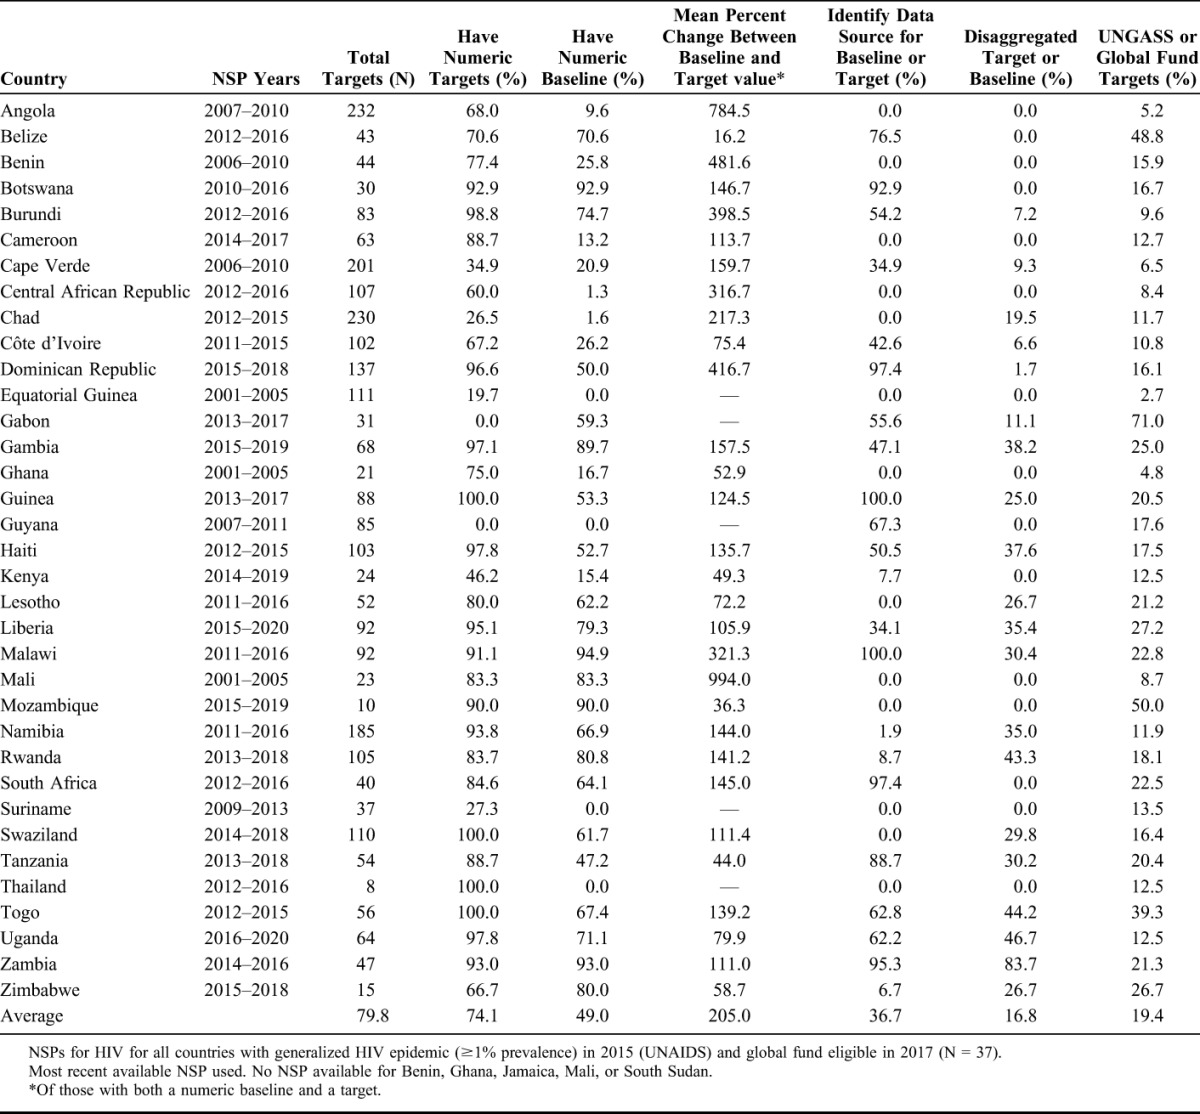
All NSPs included indicators for measuring progress, ranging from a total of 8 in Thailand to 232 in Angola (Table 1). In total, 2703 indicators were identified and evaluated. Indicators address a wide range of topics, such as disease trend goals, targets for individuals reached by programs, health system priorities, information systems, and national planning activities.
TABLE 1.
Targets in NSPs
Indicator Domains
A proportional average of 24% of indicators were categorized as structural across all NSPs (Table 2). There was considerable variability in this proportion: 4 countries had no structural targets, whereas among those countries that did have structural indicators, proportions ranged from 1% (Rwanda) to 46% (Angola).
TABLE 2.
Indicator categories, as a Percent of Total Indicators in NSP
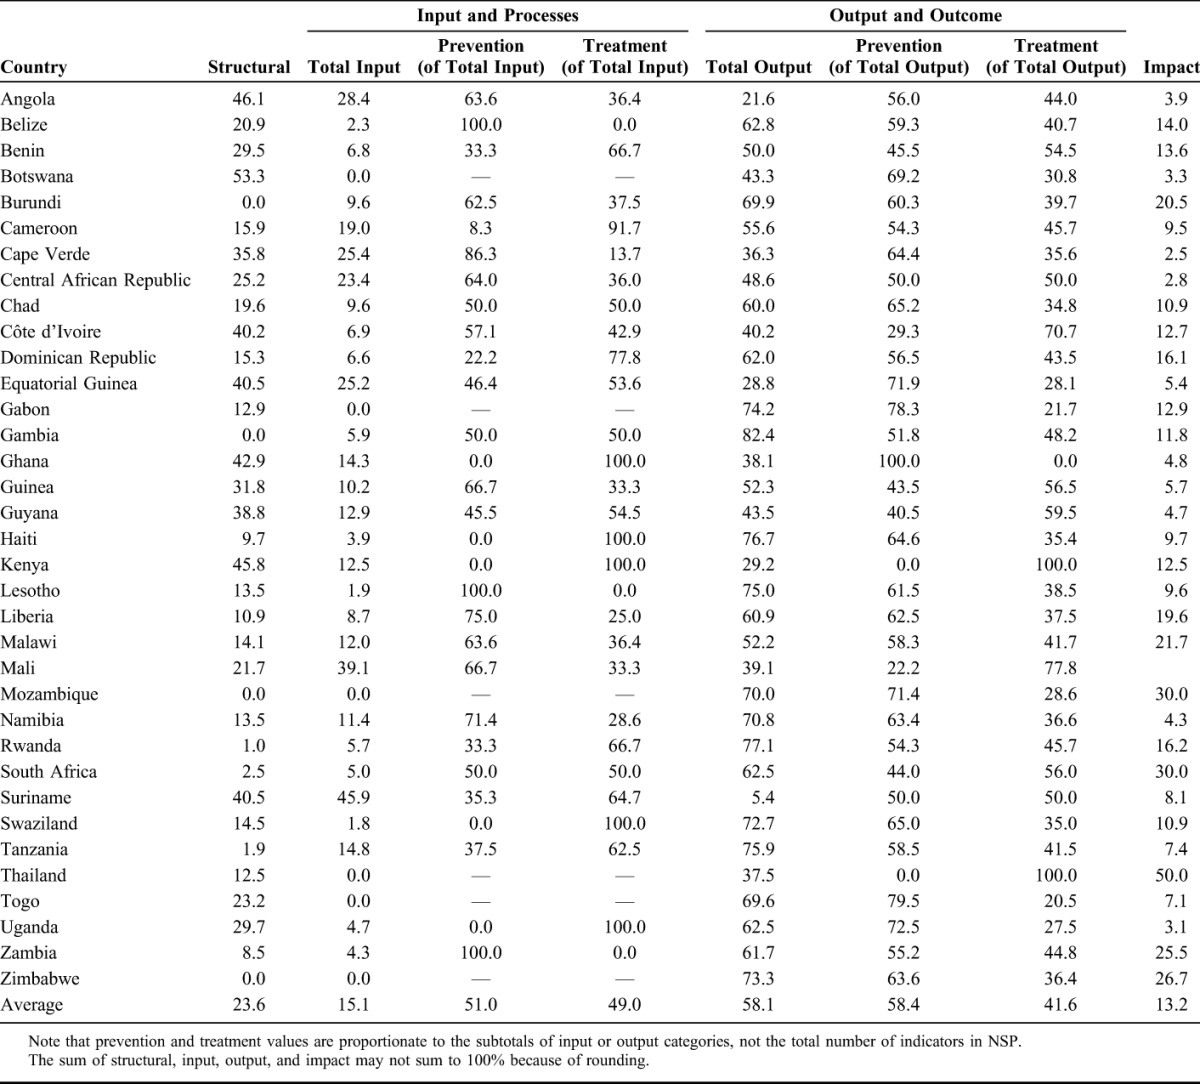
Nonstructural indicators were for inputs (15%), outputs (58%), or impact (13%). The emphasis on output indicators was nearly uniform: In 91% of NSPs analyzed, there were more output indicators than input indicators. Six countries did not include any input indicator, and only the Mali NSP had no impact indicators. The input and output targets were nearly evenly distributed between prevention and treatment activities: Of input targets, 51% related to HIV prevention activities, whereas the remainder were for treatment; similarly, 58% of the output indicators measured prevention and 42% measured treatment.
Indicator Quality
Measures of indicator quality are presented in Table 1. Most targets lack specificity, as they do not specifically address target populations. The percent of targets in each NSP that included a disaggregated target (by sex, age, or population group) ranged from 0% to 100%, with an average of 16.8%. Fifteen NSPs had no disaggregated indicators.
The measurability of indicators was limited by a lack of numeric targets. Overall, the percent of nonstructural indicators that included numeric targets ranged from 0% in Gabon and Guyana to 100% in Guinea, Swaziland, Thailand, and Togo, with an average of 74%. Fewer NSPs included numeric baseline values for indicators (49%, on average). No NSP had baseline data for all nonstructural indicators, and 4 NSPs (Equatorial Guinea, Guyana, Suriname, and Thailand) had no baseline data for any indicator.
Across all NSPs, 37% of nonstructural indicators included a data source listed for the baseline or target. Thirteen NSPs had no data sources listed for any indicator. Commonly identified data sources included UNAIDS Spectrum, vital registration systems, program data and reports, Demographic and Health Surveys (DHS), and national and subnational surveys.
Of nonstructural indicators that included both a numeric baseline and target value, targets across all countries amounted to an average of a 205% increase or decrease relative to baselines, with NSP averages ranging from 16% in Belize to 994% in Mali.
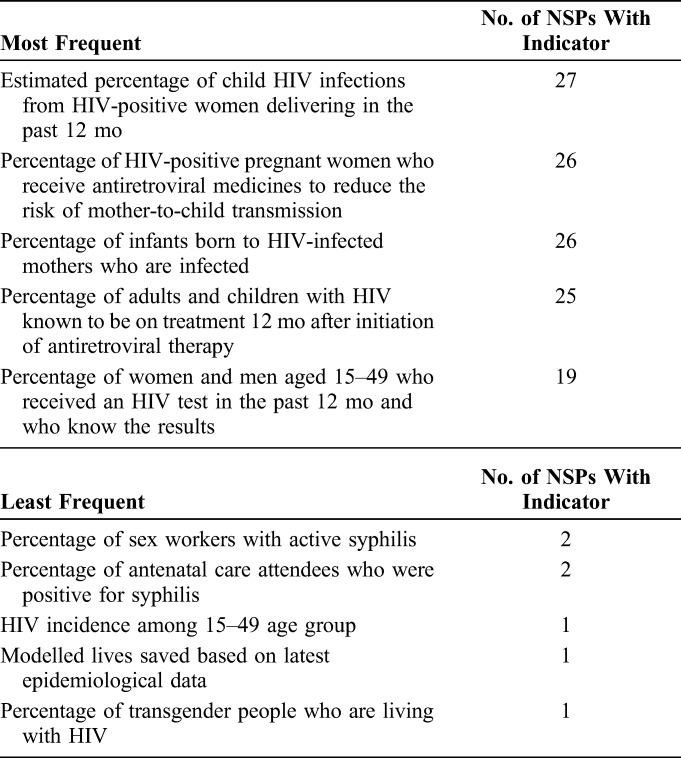
Relevance of indicators is assessed by alignment with standardized international indicators. Every NSP included at least 1 UNGASS or Global Fund indicator. The percent of NSP indicators that are standard UNGASS or Global Fund indicators ranged from 2.7% in Equatorial Guinea to 50% in Mozambique. The most common international targets were “Percentage of most-at-risk populations who are HIV infected” (UNGASS) and “Percentage of most-at-risk populations that have received an HIV test in the last 12 months and who know the results” (UNGASS), whereas the least common were “Modelled lives saved based on latest epidemiological data” (Global Fund) and “Percentage of transgender people who are living with HIV” (Global Fund) (Table 3).
TABLE 3.
Most and Least Frequently Appearing UNGASS and Global Fund Indicators
Five countries had available NSPs from 2015 or later: Dominican Republic, Gambia, Mozambique, Uganda, and Zimbabwe. Each of these countries included at least 1 of the 3 Fast Track indicators, although not all indicators included a target of 90% or higher. Only Zimbabwe included an indicator to measure the percent of PLHIV with known status (the first 90), with a target of 80%. All 5 countries included targets for the proportion of PLHIV receiving antiretroviral treatment (the second 90); only the Dominican Republic, Gambia, and Uganda set their target at 90% or above. Finally, only the Dominican Republic and Zimbabwe NSPs included targets for viral load suppression among those receiving treatment (the third 90), with targets of 80% and 95%, respectively.
Financial Gap
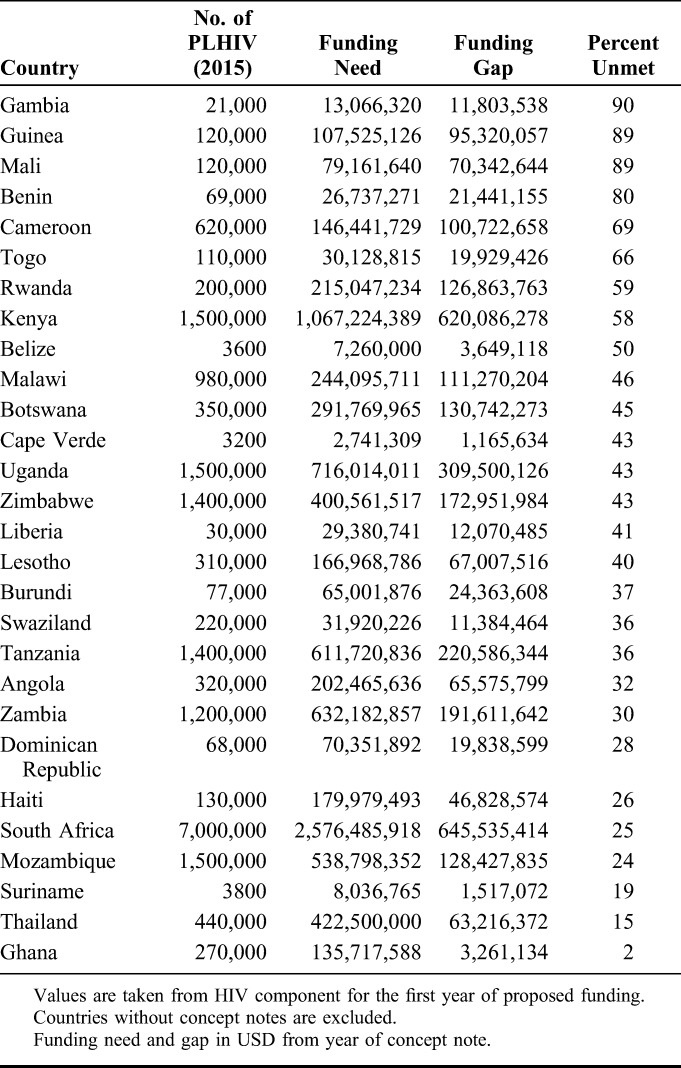
The financial needs of the NSPs and the financial gap are shown in Table 4. The annual cost of each NSP varied from $2.74 million in Cape Verde to $2.58 billion in South Africa. Overall, the cost of the NSP was strongly correlated with the number of PLHIV in that country (R2 = 0.94).15 NSPs that contain indicators that are poorly defined or include targets that are unrealistic or difficult to achieve may inflate the cost of the NSP implementation, which can be assessed by proxy through the financial gap listed in Global Fund concept notes. However, no statistically significant linear association was found between the funding gap reported in Global Fund concept notes and any of the quality metrics assessed above (specificity, measurability, achievability, or relevance); the percent of NSP indicators that were for structural, impact, prevention (input or output), or treatment (input or output) interventions (α = 0.05). The percent of indicators that are for treatment output measures was positively associated with the funding gap (β = 0.91, P = 0.04); however, this effect was not statistically significant in multivariate regression with other measures of indicator quality or type included.
TABLE 4.
Funding Gap and Funding Needs for Concept Notes
Progress Monitoring
Figure 1 displays the results of the progress evaluations for Botswana, Kenya, Malawi, and South Africa. Achievement of NSP indicators ranged from 2% in Malawi to 21% in South Africa. However, assessment of achievement was limited by the dearth of established targets, lack of available data, and poorly defined indicators. Overall, progress was measurable for 27% of Botswana's indicators; 44% of Kenya's indicators; 15% of Malawi's indicators; and 65% of South Africa's indicators. An average of 18% of NSP indicators did not include a numeric target. Six percent of indicators in Kenya's NSP and 27% of indicators in Botswana's NSP were not measurable (ie, the indicator contained terms that were undefined and/or dependent on subjective measurements that were not accompanied by numeric targets or baselines). For more than half of the NSP indicators in Botswana, Kenya, and Malawi, progress could not be assessed because of the unavailability of data. In South Africa, 21% of indicators did not have available data.
FIGURE 1.
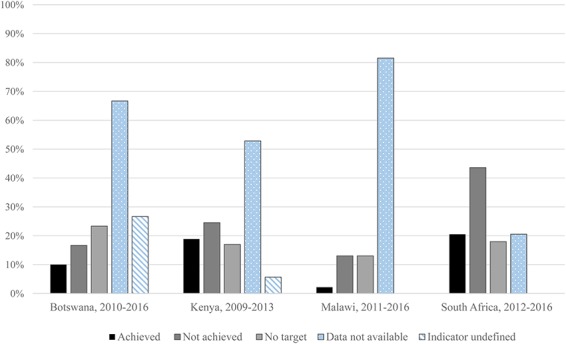
Progress toward NSP targets. “Achieved” targets represent both targets that have been achieved and targets on track to be achieved, based on most recent data. “Not achieved” targets represent both targets that have not been achieved, and targets that are not on track to be achieved, based on the most recent data. No target, data not available, and indicator undefined are not independent categories; columns do not sum to 100%.
DISCUSSION
As foundational documents asserting a national planning and coordination process, NSPs potentially serve as a useful role. To do so, NSPs must be accountable to a clear assessment of the problems facing the country's response to the epidemic and must present a clear, reasonable vision for responding to those problems. Our analysis reveals that the indicators in the NSPs are not likely meeting these needs, and therefore it is unlikely that the NSPs themselves will fulfill these functions either.
The NSP indicators are strongly biased toward output measures, with considerably fewer indicators measuring inputs or impact. Although there is no standard guidance for how many of each type of indicator should be included, the bias toward outcome measures may risk countries failing to measure programmatic or planning gaps or more distal metrics for impact. In most countries, there was not a strong bias toward prevention versus treatment indicators, and there was considerable variation in the proportion of indicators that were for structural interventions.
Per the SMART criteria21 for monitoring and evaluation, most NSP indicators and targets lack specificity, measurability, achievability, and relevance, according to the proxies measured in this analysis. A minority of indicators meet all the criteria of a high-quality indicator—inclusion of a numeric baseline and target value with data sources specified, targets within an achievable percent of the baseline value, specification of the population group to be targeted and measured, and alignment with standard international monitoring and evaluation indicators. This finding raises considerable doubts about the utility and achievability of national targets as they are currently formulated.
Indeed, the review of progress suggests that countries have struggled to meet targets established in historical NSPs. In corroboration with the findings in the current NSPs, this analysis finds that progress monitoring has been limited by a lack of numeric targets and baselines, poorly defined indicators, and the absence of identified data sources for monitoring. One major weakness identified in this review was the lack of available or accessible data for monitoring progress. For example, in all countries but South Africa, progress toward more than half of the NSP indicators could not be measured because data were not available. This weakness is clear in the progress reports themselves; whereas South Africa's progress report closely aligned with the NSP, in Botswana, Malawi, and Kenya, the progress report described progress toward a different set of indicators or simply did not report on all the NSP indicators.
The implications of these findings reach far beyond the NSPs themselves. In 2014, UNAIDS set the overarching 90–90–90 targets to reach the end of the AIDS epidemic by 2030. The results from this analysis cast doubt on countries' abilities to achieve these targets while using poorly designed NSPs as strategic and monitoring frameworks for their response. Indeed, although several NSPs that postdate the release of the UNAIDS targets did include the three 90–90–90 targets in their NSPs, these indicators nonetheless suffer from many of the same technical limitations as described in this analysis. Furthermore, the 90–90–90 testing and treatment targets are unlikely to be achieved if accompanied by a complementary set of HIV prevention, governance, and health system indicators that lack specificity, achievability, or measurability.
Whether correctly, incorrectly, or simply pragmatically, many core output indicators used in HIV programs are established outside the NSP planning process. In many of the countries assessed here, PEPFAR is the main funder of HIV services and its decisions about testing, initiation, treatment, and retention targets (now aligned to the 90–90–90 Fast Track agenda) are likely to set the broad outline of how most direct HIV resources will be allocated and on what they will be spent. The impact of other international bodies such as UNAIDS and the World Bank is also felt in the NSP development process. Despite the involvement of ministries of health, representatives of national AIDS councils, and other government officials, NSPs are frequently sidelined in favor of the indicators decided on by PEPFAR and other stakeholders.
Nonetheless, because NSPs could be an important tool in accountability monitoring, development partners and donors both have a vested interest in improving these documents. Although the development of goals and targets that are purely aspirational can be valuable in some contexts, the costs and administrative burden of producing NSPs can be exceptionally high. The reliance on NSPs by country governments, international monitoring bodies, and donors in developing grant priorities, funding needs, target setting, and progress monitoring is warranted only if the NSPs themselves contain evidence-based priorities and rigorous targets. The purpose and potential utility of NSPs may be greatly increased by focusing only on critical gaps in implementation with realistic, incremental, monitor-able, and short-term actions necessary to fill gaps.
There are several strategies that may be adopted to improve the quality and value of NSPs. First, the strategic importance of NSPs must be reassessed and reinvigorated, given the current context of international targets and implementation. Strategic planning should be better focused on specifically improving process and implementation gaps that exist and should occur in conjunction with the annual budget planning process to ensure that strategic activities are linked with financial planning. Second, regular and independent evaluations of progress toward NSP targets should be made central to the planning process. The finding that several countries do not release public reports on progress toward NSP targets, and the ambiguity in NSPs about data sources, suggests that target data are not used in program monitoring, accountability, or in the development of new NSPs. Independent analysis and publishing on NSP progress would ensure greater accountability, limit unachievable target setting, and provide valuable feedback on which interventions are successful. Finally, the finding that targets are dominated by outcome objectives suggests an overreliance on the “management by objectives” approach. The neglect of intermediate steps in the form of systems-wide process indicators risks not only failing to achieve outcomes, but may also ignore the epidemiological context, and the health system capacity, while producing distortions in program reporting and quality.
Ultimately, ending HIV as a public health threat is critically dependent on strategic planning that is collaborative, outcome oriented, and that holds all parties accountable for achieving national goals.
Footnotes
The authors have no funding or conflicts of interest to disclose.
REFERENCES
- 1.Guide to the Strategic Planning Process for a National Response to HIV/AIDS. Joint United Nations Programme on HIV/AIDS; 1999. Available at: http://pdf.usaid.gov/pdf_docs/Pnacj446.pdf. Accessed March 16, 2017. [Google Scholar]
- 2.Funding Process and Steps. The Global Fund; Available at: http://www.theglobalfund.org/en/fundingmodel/process/. Accessed March 16, 2017. [Google Scholar]
- 3.PEPFAR Country/Regional Operational Plan Guidance 2017. U.S. President's Emergency Plan for AIDS Relief; 2017. Available at: https://www.pepfar.gov/documents/organization/267162.pdf. Accessed March 16, 2017. [Google Scholar]
- 4.Engage! Practical Tips to Ensure the New Funding Model Delivers the Impact Communities Need. The Global Fund; 2014. Available at: http://www.theglobalfund.org/documents/publications/other/Publication_EngageCivilSociety_Brochure_en/. Accessed March 16, 2017. [Google Scholar]
- 5.Technical Cooperation. The Global Fund; Available at: http://www.theglobalfund.org/en/fundingmodel/technicalcooperation/. Accessed March 16, 2017. [Google Scholar]
- 6.GF/B35/07a—Revision 1: 2017–2022 strategic key performance indicator framework. Presented at: 35th Board Meeting; 2016; Geneva, Switzerland. The Global Fund.
- 7.United Nations Millennium Project. Preparing National Strategies to Achieve the Millennium Development Goals: A Handbook. 2005. Available at: http://www.unmillenniumproject.org/documents/handbook111605_with_cover.pdf. Accessed April 5, 2017. [Google Scholar]
- 8.Gibbs A, Mushinga M, Crone ET, et al. How do national strategic plans for HIV and AIDS in southern and eastern Africa address gender-based violence? A women's rights perspective. Health Hum Rights. 2012;14:10–20. [PubMed] [Google Scholar]
- 9.Gibbs A, Crone ET, Willan S, et al. The inclusion of women, girls and gender equality in National Strategic Plans for HIV and AIDS in southern and eastern Africa. Glob Public Health. 2012;7:1120–1114. [DOI] [PubMed] [Google Scholar]
- 10.Makofane K, Gueboguo C, Lyons D, et al. Men who have sex with men inadequately addressed in Africans AIDS National Strategic Plans. Glob Public Health. 2013;8:129–143. [DOI] [PMC free article] [PubMed] [Google Scholar]
- 11.Daly F, Spicer N, Willan S. Sexual rights but not the right to health? Lesbian and bisexual women in South Africa's National Strategic Plans on HIV and STIs. Reprod Health Matters. 2016;24:185–194. [DOI] [PubMed] [Google Scholar]
- 12.Gruskin S, Tarantola D. Universal access to HIV prevention, treatment and care: assessing the inclusion of human rights in international and national strategic plans. AIDS 2008;22(suppl 2):S123–S132. [DOI] [PMC free article] [PubMed] [Google Scholar]
- 13.Preparing National HIV/AIDS Strategies and Action Plans—Lessons of Experience. The World Bank; 2007. Available at: http://siteresources.worldbank.org/INTHIVAIDS/Resources/375798-1151090631807/2693180-1151090665111/StrategyPracticeNoteFinal19October07.pdf. Accessed March 16, 2017. [Google Scholar]
- 14.Eligibility List 2017. The Global Fund; 2016. Available at: http://www.theglobalfund.org/documents/core/eligibility/Core_EligibleCountries2017_List_en/. Accessed March 16, 2017. [Google Scholar]
- 15.Boerma T, Abou-Zahr C, Bos E, et al. Monitoring and Evaluation of Health Systems Strengthening: An Operational Framework. Geneva, Switzerland: World Health Organization; 2009. Available at: http://www.who.int/healthinfo/HSS_MandE_framework_Nov_2009.pdf. Accessed February 1, 2017. [Google Scholar]
- 16.Doran GT. There's a S.M.A.R.T. way to write management's goals and objectives. Management Rev. 1981;70:35–36. Available at: http://community.mis.temple.edu/mis0855002fall2015/files/2015/10/S.M.A.R.T-Way-Management-Review.pdf. Accessed February 2017. [Google Scholar]
- 17.List of Core Indicators—HIV. The Global Fund; Available at: http://theglobalfund.org/documents/monitoring_evaluation/ME_SummaryListOfIndicators-HIV_List_en/. Accessed February 1, 2017. [Google Scholar]
- 18.Guidelines on Construction of Core Indicators—2010 Reporting. UN General Assembly Special Session on HIV/AIDS; 2009. Available at: http://data.unaids.org/pub/Manual/2009/JC1676_Core_Indicators_2009_en.pdf. Accessed February 1, 2017. [Google Scholar]
- 19.Aidsinfo [database online]. UNAIDS; Available at: http://aidsinfo.unaids.org/. Accessed February 1, 2017. [Google Scholar]
- 20.Stata/IC [computer Program]. Version 14.1. College Station, TX: StataCorp; 2015. [Google Scholar]
- 21.Develop Smart Objectives. Centers for Disease Control and Prevention; 2011. Available at: https://www.cdc.gov/phcommunities/resourcekit/evaluate/smart_objectives.html. Accessed March 16, 2017. [Google Scholar]


