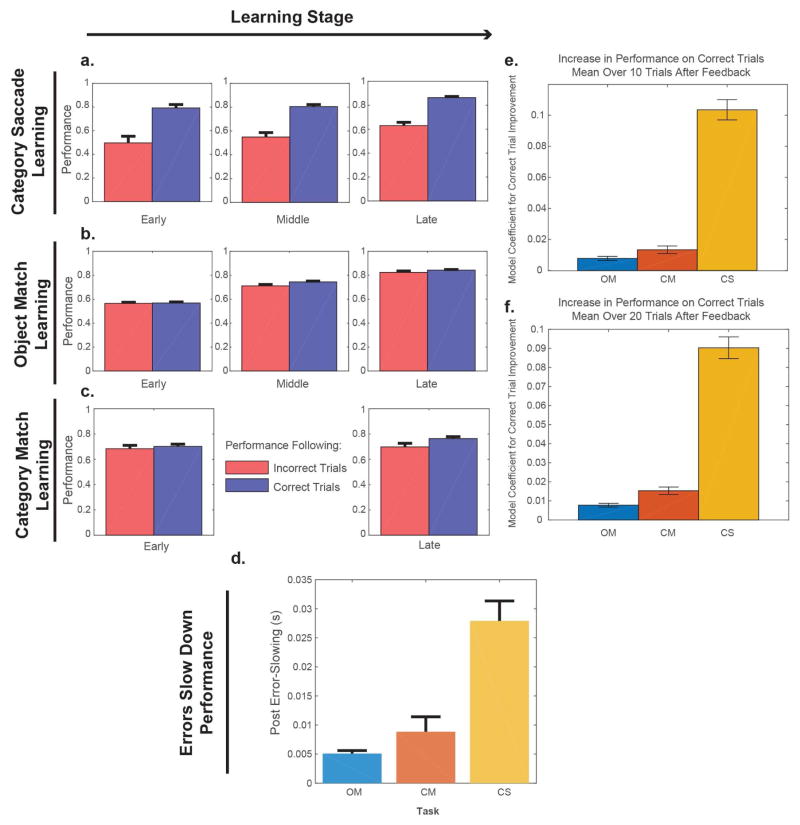
Figure 2.
In A, each bar represents performance separated out by monkey on trials following either an incorrect response (red bar) or a correct response (blue bar) during Category-Saccade learning. All trials were pooled across days for each stage of learning (presented as separate columns). Error bars show 95% confidence interval generated from a binomial distribution. In B, C we again plotted performance following a correct and incorrect trial for both the Object-Match and Category-Match tasks; however, both monkeys in each task were pooled. D. Post-error slowing across the 3 different learning tasks: Object-Match (OM), Category-Match (CM), and Category-Saccade (CS). CM and OM post-error slowing were not significantly different (p = 0.172). CS post-error slowing was significantly larger than both Match tasks (p < 1 × 10⁻⁴). Error bars represent the SEM. In E, F mean performance changes over 10 trials and 20 trials following feedback (correct vs. error) after regressing out total mean performance. In both Match tasks, performance increased marginally following correct trials, while in the Category-Saccade task performance improved by 10-fold relative to the Match tasks. See also Figure S1.

