Figure 7.
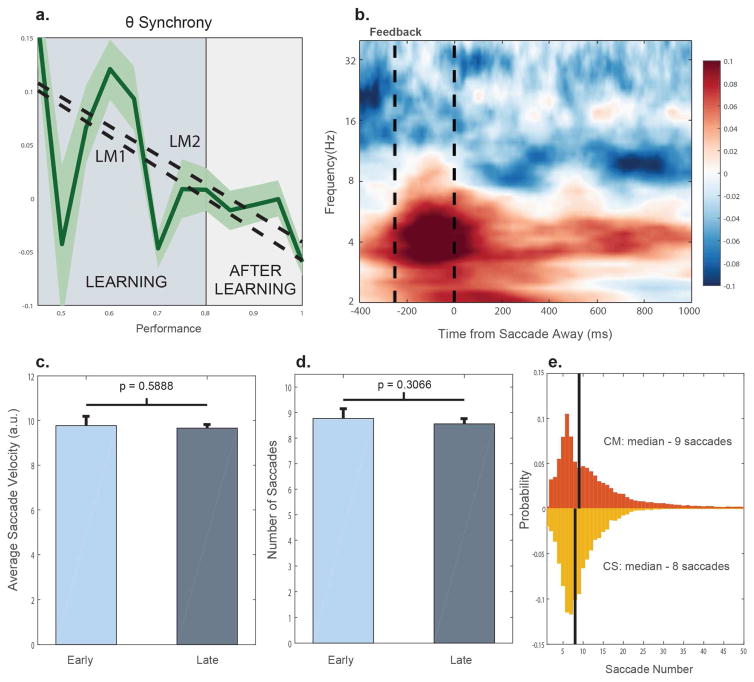
A, Theta band synchrony binned by non-overlapping, 20-trial window intervals in the Category-Saccade task. LM1 and LM2 estimate changes with learning from 50–80% learning, and 80–100% learning respectively. B, Instead of aligning the LFPs to the feedback, all of the data was aligned to the saccade away from the target – which occurred on average 339ms after feedback. For the sake of visualization, this data has been normalized to the mean synchrony across the theta and beta bands. Here, theta synchrony increased on correct trials prior to the saccade away. C, Average saccade velocity early and late in learning (the mean of the first derivative of the eye position signal relative to the center of the screen). D, The number of saccades was taken as the number of threshold crossings of the eye signal during the entire feedback period (1.7s). E, Probability distributions of the number of saccades for both the Category-Match and Category-Saccade tasks. All of the error bars reflect ± SEM.

