Abstract
Background:
This study aimed to identify key genes associated with acute myocardial infarction (AMI) by reanalyzing microarray data.
Methods:
Three gene expression profile datasets GSE66360, GSE34198, and GSE48060 were downloaded from GEO database. After data preprocessing, genes without heterogeneity across different platforms were subjected to differential expression analysis between the AMI group and the control group using metaDE package. P < .05 was used as the cutoff for a differentially expressed gene (DEG). The expression data matrices of DEGs were imported in ReactomeFIViz to construct a gene functional interaction (FI) network. Then, DEGs in each module were subjected to pathway enrichment analysis using DAVID. MiRNAs and transcription factors predicted to regulate target DEGs were identified. Quantitative real-time polymerase chain reaction (RT-PCR) was applied to verify the expression of genes.
Result:
A total of 913 upregulated genes and 1060 downregulated genes were identified in the AMI group. A FI network consists of 21 modules and DEGs in 12 modules were significantly enriched in pathways. The transcription factor-miRNA-gene network contains 2 transcription factors FOXO3 and MYBL2, and 2 miRNAs hsa-miR-21-5p and hsa-miR-30c-5p. RT-PCR validations showed that expression levels of FOXO3 and MYBL2 were significantly increased in AMI, and expression levels of hsa-miR-21–5p and hsa-miR-30c-5p were obviously decreased in AMI.
Conclusion:
A total of 41 DEGs, such as SOCS3, VAPA, and COL5A2, are speculated to have roles in the pathogenesis of AMI; 2 transcription factors FOXO3 and MYBL2, and 2 miRNAs hsa-miR-21-5p and hsa-miR-30c-5p may be involved in the regulation of the expression of these DEGs.
Keywords: acute myocardial infarction, differentially expressed genes, gene functional interaction, pathway enrichment analysis, transcription factor-miRNA-gene network
1. Introduction
Acute myocardial infarction (AMI) is the world's leading cause of morbidity and mortality. A ruptured atherosclerotic plaque, causing thrombosis and occlusion of the coronary artery, is widely accepted for the occurrence of an AMI. Early reperfusion of the occluded artery after MI, including primary percutaneous coronary intervention (PCI) or thrombolytic therapy, will improve long-term prognosis of patients. Thrombolytic therapy has become the standard therapy for AMI since 1980s.[1] Recently, primary PCI seems to be more effective than fibrinolytic therapy in acute ST-segment elevation myocardial infarction.[2] However, approximately one-third of eligible patients failed to receive early reperfusion therapy because of late presentation.[3,4] Thus, an early diagnosis may benefit the survival remarkably.
Cardiac troponins (T/I) have been long considered as the “gold standard” biomarkers for early detection of AMI.[5,6] However, more sensitive and potent makers are preferred. Mccann et al[7] have proposed that heart fatty acid binding protein (H-FABP) is superior than cardiac troponin T. Several circulating microRNAs (miR-208a, miR-499, and miR-1) have also been recommended as potential biomarkers for early diagnosis of myocardial infarction.[8–10] Here, using 3 public gene expression profile datasets, we attempted to identify novel genes that may be useful for the early detection of AMI by bioinformatics methods.
2. Materials and methods
2.1. Source of microarray data
Three gene expression profile datasets GSE66360, GSE34198, and GSE48060 were downloaded from GEO (Gene Expression Omnibus, http://www.ncbi.nlm.nih.gov/geo/) database. The samples included in each dataset and annotation platform are listed in Table 1.
Table 1.
Information on platform and study subjects in each gene expression profile dataset.

2.2. Microarray data preprocessing
For the raw data in GSE66360 and GSE34198, they were first subjected to background correction and quantile normalization using the Affy package of R/Bioconductor.[11] For data in GSE34198, the Limma package of R/Bioconductor was used for background correction, normalization between arrays, and microarray data condensation.
2.3. Heterogeneity test and screening of characteristic genes
First, heterogeneity of each gene across different platforms was examined by measuring tau2, Q value, and Q P value using MetaDE.ES function; tau2 of 0 and Q pval >0.05 indicate no heterogeneity. Next, genes without heterogeneity were subjected to differential expression analysis of their expression levels between the AMI group and the control group using metaDE package; P < .05 was used as the cutoff for a differentially expressed gene (DEG). The log2FC (fold change) value of a gene in each dataset was further calculated, with log2FC > 0 as upregulated and log2FC < 0 as downregulated.
2.4. Pathway enrichment analysis of DEGs
The screened DEGs were submitted to DAVID (v6.8, Database for Annotation, Visualization and Integrated Discovery, https://david.ncifcrf.gov/) to examine the pathways in which these genes were enriched based on the KEGG database (Kyoto Encyclopedia of Genes and Genomes) (P < .05).[12]
2.5. Construction of gene functional interaction network
The expression data matrix of DEGs was submitted to ReactomeFIViz to investigate gene–gene interaction based on known human pathway data.[13] ReactomeFIViz first constructs a functional interaction (FI) network by merging interactions extracted from human curated pathways and the average Pearson correlation coefficient among genes involved in the same FIs are also calculated as weights for edges (i.e., FIs) in the whole FI network; next, using MCL (Monte Carlo Localization) graph clustering algorithm, subnetworks for a list of selected network modules were generated based on module size and average correlation. The FI network was finally visualized using Cytoscape 2.8.0 (National Institute of General Medical Sciences of the National Institutes of Health).[14]
2.6. Prediction of AMI-related microRNAs and construction of miRNA-gene network
First, microRNAs related to AMI were identified from the miR2disease database (http://www.mir2disease.org/). Next, the target genes that have been experimentally validated were downloaded from Mirwalk2,[15] which were further compared with the DEGs screened above. Next, these miRNAs and their target DEGs were used to construct a miRNA-gene network.
2.7. Prediction of transcription factor-miRNA-gene network
Transcription factors of the DEGs in the miRNA-gene network constructed above were predicted using a Cytoscape plug-in iRegulon,[16] which includes gene-transcription factor pairs in Transfac, Jaspar, Encode, etc. Minimum identity between orthologous genes was 0.05 and maximum false discovery rate on motif similarity: 0.001. The transcription factors predicted with normalized enrichment score (NES) >3 were retained.
2.8. Validation of DEGs
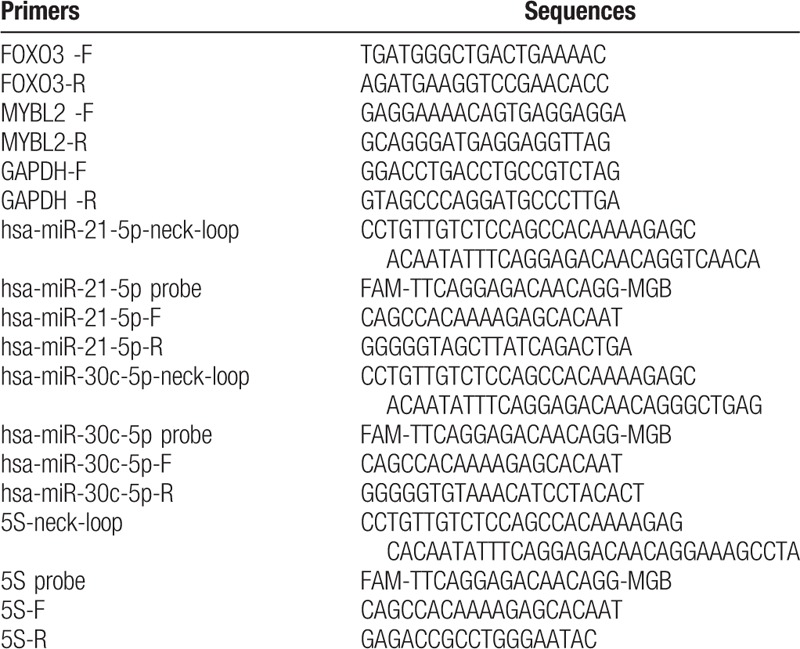
A total of 16 blood samples, including 8 normal control and 8 AMI blood samples, were collected from the Second Affiliated Hospital of Harbin Medical University to verify the expression levels of FOXO3, MYBL2, hsa-miR-30c-5p, and hsa-miR-21-5p identified in this study using quantitative real-time polymerase chain reaction (RT-PCR). Total RNAs were isolated using TRI pure LS Reagent Blood RNA Extraction Kit (Bioteke, Lot: RP1102, Beijing, China). Then, 4 μg of total RNA was utilized miRNA reverse transcription using Rayscript cDNA Synthesis Kit (GCK8030, GENEray, Shanghai, China) with neck-loop premiers instead of Oligo (dT). Amplification of miRNA was carried out on a ViiA7 real-time PCR instrument (ABI, Foster City, CA) using the following system: 50°C for 3 minutes, then 40 cycles of 95°C for 3 minutes, 95°C for 10 seconds, and 60°C for 30 seconds. Meanwhile, 0.5 μg of total RNA was applied to mRNA reverse transcription using using Rayscript cDNA Synthesis Kit (GCK8030, GENEray, Shanghai, China). Amplification of mRNA was performed using the following system: 95°C for 2 minutes, then 40 cycles of 95°C for 15 seconds, 60°C for 20 seconds, and 72°C for 20 seconds. Primers of RNAs are tabulated in Table 2. GAPDH was utilized as the internal control for mRNA evaluation, and 5S was utilized as the internal reference for miRNA evaluation. The ethics committee of the Second Affiliated Hospital of Harbin Medical University approved this study, and informed written consents were obtained from the included subjects.
Table 2.
Primers of genes determined by quantitative real-time PCR.
3. Results
3.1. Screening of candidate characteristic genes
According to the analytical results, a total of 913 upregulated genes and 1060 downregulated genes were identified in the AMI group compared with the control group. Then, KEGG enrichment analyses for upregulated and downregulated genes were carried out. The enrichment results performed that the upregulated genes and downregulated genes were enriched in 35 and 27 KEGG pathways, respectively (Fig. 1).
Figure 1.
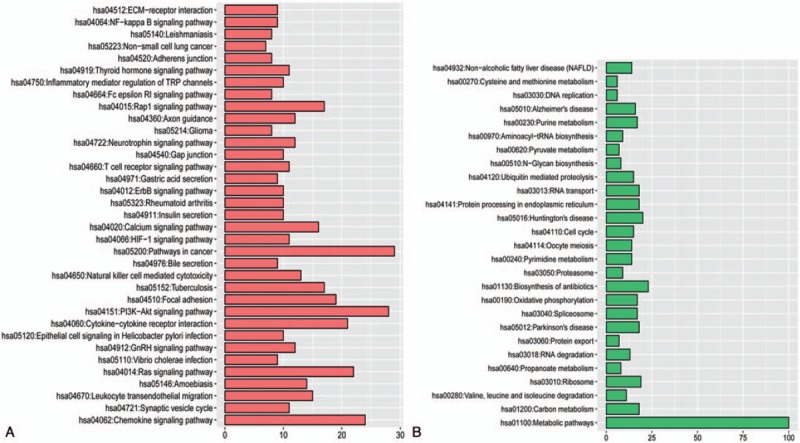
Pathway enrichment analysis of differentially expressed genes A, pathways enriched by the upregulated genes; B, pathways enriched by the downregulated genes.
3.2. Construction of FI network and pathway enrichment analysis
On the basis of the expression data matrices, a FI network was constructed, which contained 249 nodes forming 1071 interaction pairs (Fig. 2). The network includes 21 modules, of which 12 modules had Pearson correlation coefficient > 0.9.
Figure 2.
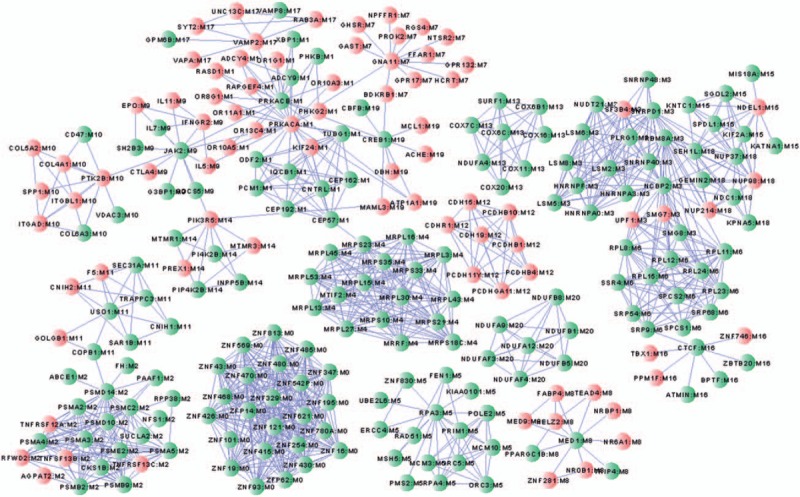
Modules of the gene functional interaction network.
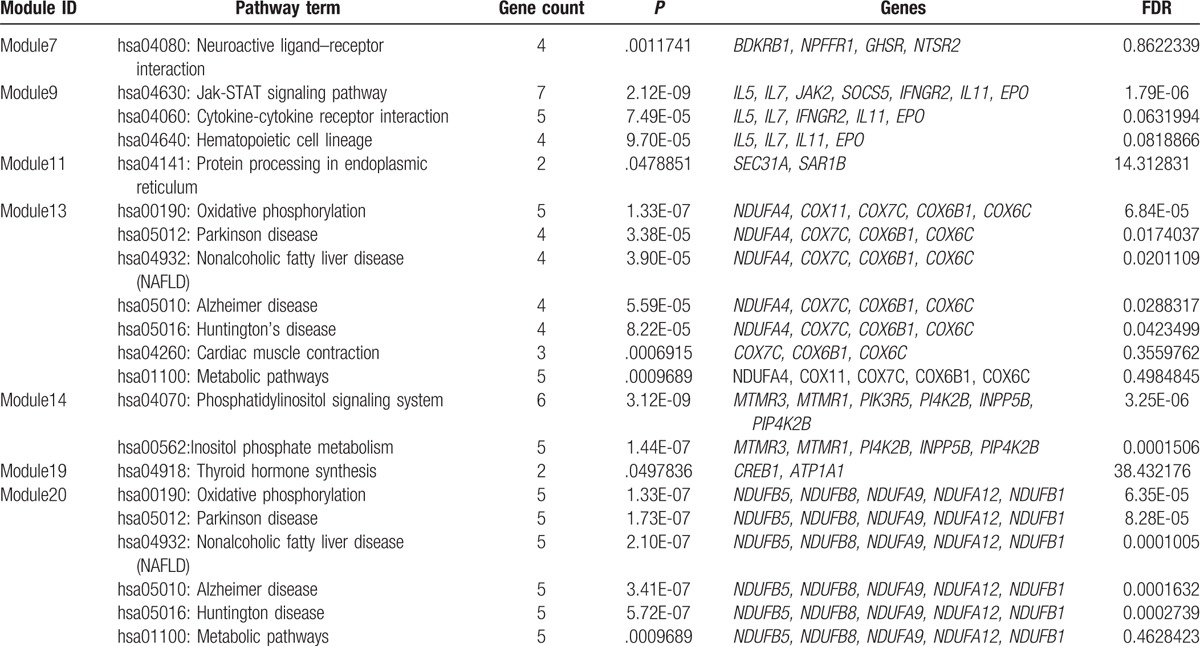
KEGG pathway enrichment of DEGs in each module shows that DEGs in Module 1 were significantly enriched in 38 KEGG pathways, such as DEGs in Module 5 and 13 were enriched in 7 pathways each; DEGs in Module 20 were enriched in 6 pathways; DEGs in Module 3 were enriched in 4 pathways; DEGs in Module 9 were enriched in 3 pathways, such as hsa04630: Jak-STAT signaling pathway; DEGs in Module 6 and 14 were enriched in 2 pathways each; DEGs in Module 2, 4, 7, 11, and 19 were enriched in 1 pathway each (Table 3 ).
Table 3.
Pathway enrichment analysis of differentially expressed genes in the modules of the gene functional interaction network.

Table 3 (Continued).
Pathway enrichment analysis of differentially expressed genes in the modules of the gene functional interaction network.
3.3. Construction of miRNA-gene network
The miRNA-gene network consists of 9 miRNAs (hsa-miR-21, hsa-miR-133, hsa-miR-29, hsa-miR-30c, hsa-miR-1, hsa-miR-133a, hsa-miR-133b, hsa-miR-208, hsa-miR-499) and 191 genes, forming 213 miRNA–gene pairs (Fig. 3). Among the DEGs in this network, 28 were also found in the FI network.
Figure 3.

A microRNA-gene network consisting of differentially expressed genes and the miRNAs regulating them, A, triangle represents a microRNA, B, a circle represents a differentially expressed gene.
3.4. Prediction of transcription factor-miRNA-gene network
The transcription factor-miRNA-gene network contains 40 DEGs, including 14 upregulated gens (CBX4, CCR1, COL5A2, FGF12, FKBP5, IGF1R, LAMP2, MEGF9, MMP2, OTUD1, TGFB2, NDEL1, UBN1, and VAPA) and 26 downregulated genes (ADNP, CD47, CDK6, CKAP5, CLIP4, DAAM1, DOCK10, FAM20B, FAM3C, FBXL17, FOXN2, HPS5, LCORL, MTMR9, NBEA, NEK1, PER3, PHACTR2, POLR3B, PRRC1, SCRN1, SEC63, SLK, SOCS5, TET1, and ZBTB20 ), 2 upregulated transcription factors FOXO3 and MYBL2, and 2 downregulated miRNAs hsa-miR-21-5p and hsa-miR-30c-5p (Fig. 4).
Figure 4.
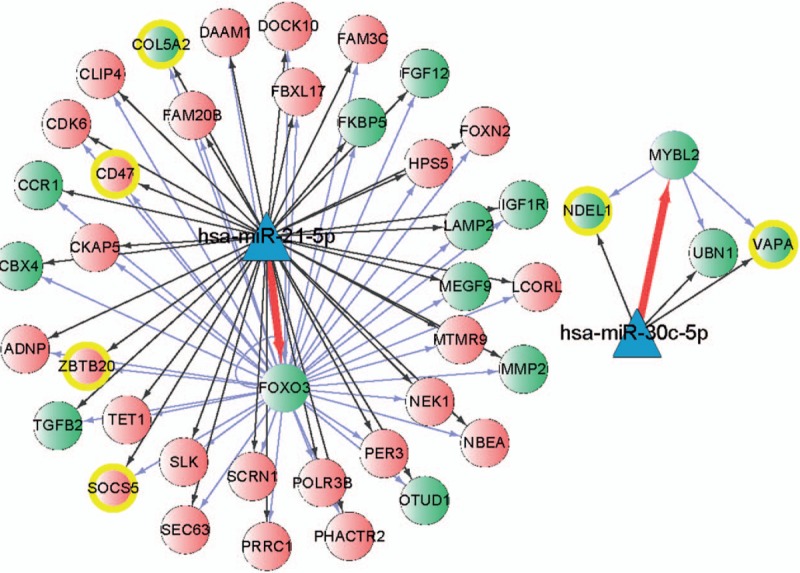
The transcription factor-miRNA-gene network, A, triangle represents a microRNA, B, green circle represents the upregulated differentially expressed gene or upregulated transcription factor, and red circle represents the downregulated differentially expressed gene.
3.5. Experimental validations of DEGs
To further confirm our identifications, the expression levels of FOXO3 and MYBL2 and 2 miRNAs hsa-miR-21-5p and hsa-miR-30c-5p were determined in AMI patients and normal controls. The RT-PCR results presented that the relative mRNA expression levels of FOXO3 and MYBL2 were significantly increased in AMI patients compared with the normal controls (Fig. 5A and B). Meanwhile, the expression levels of hsa-miR-30c-5p and hsa-miR-21-5p were significantly decreased in AMI patients compared with the normal controls (Fig. 5C and D).
Figure 5.

Expression levels of FOXO3, MYBL2, hsa-miR-21-5p, and hsa-miR-30c-5p determined using quantitative real-time PCR.
4. Discussion
In the present study, we first identified genes differentially expressed in patients with AMI across 3 different platforms using an R package MetaDE; then, we constructed a FI network and also subnetworks consisting of genes with close interaction; finally, miRNAs and transcription factors which might regulate these DEGs were predicted. Consequently, we found out 41 DEGs that were speculated to have critical roles in AMI, as well as 2 transcription factors FOXO3 and MYBL2, and 2 miRNAs hsa-miR-21-5p and hsa-miR-30c-5p that were predicted to regulate them.
An integrated analysis of the 3 gene expression profile datasets found that the downregulated DEGs were slightly more than the upregulated ones in patients with AMI. From the perspective of gene–gene interaction based on known human pathway data, 41 DEGs that were speculated to have important roles in AMI were further identified. Among them, SOCS5 encodes suppressor of cytokine signaling 5 protein belonging to the suppressor of cytokine signaling (SOCS) family, each member containing a central SH2 domain and a carboxyl-terminal 40-residue SOCS box. Many studies have reported that SOCS proteins (especially SOCS1 and SOCS3) have a negative regulation of JAKJ/STAT pathway.[17,18] Actually, SOCS5 was predicted to function in AMI with some other genes in Module 9 (IL5, IL7, JAK2, IFNGR2, IL11, and EPO) via the Jak-STAT signaling pathway. Seki et al[19] have demonstrated that SOCS5 can bind to the interleukin 4 receptor α chain via the first 100 residues of its N-terminal region to suppresses the interaction of JAK1 and its corresponding receptor, by which to inhibit the downstream signaling transduction of JAK1. A further study has specified that SOCS5 can directly bind to the JAK1 via N-terminal residues 175 to 244 inhibiting the phosphorylations of JAK1 and JAK2, as well as their downstream signaling pathway.[20] A recent research has documented that SOCS5 is downregulated in the blood of multiple sclerosis patients,[21] while JAK/STAT signaling pathway has been revealed to involve in the onset of AMI and the ventricular remodeling after AMI.[22] Thus, decreased SOCS5 expression may have an adverse effect on the onset of AMI and the left ventricular remodeling after AMI, which seems to agree with its downregulation observed in the AMI patients here. By contrast, COL5A2 encoding the alpha chain of collagen type V showed an increased expression in AMI patients. Moreover, this gene was found to be highly expressed in the left ventricle after MI by Azuaje et al[23] using a network-based discovery strategy. Wang et al[24] have recently revealed that the expression of COL5A2 is significantly elevated in AMI patients, and its expression can be significantly reduced by a Chinese Herbal Medicine Qishenyiqi. These identifications might suggest that COL5A2 served a critical role in the pathogenesis of AMI, but the detailed mechanism was still needed to be further analyzed.
Interestingly, both SOCS3 and COL5A2 were found to be regulated by both FOXO3 and hsa-miR-21-5p. Actually, FOXO3 and hsa-miR-21-5p seem to regulate most of the DEGs identified in AMI here. FoxO3 encodes an evolutionarily conserved transcription factor belonging to the forkhead family of transcriptional regulators. This family members negatively regulate cardiomyocyte proliferation and promote neonatal cell cycle withdrawal during heart development.[25] Furthermore, FoxO1 and FoxO3 promote cardiomyocyte survival via inducing antioxidants and cell survival pathways upon induction of oxidative stress,[26] which seemed consistent with the upregulation expression identified in this study. Thus, we concluded that FoxO3 may also have a role in AMI via regulating SOCS3 and COL5A2 expression. Previously, Dong et al[27] reported that miR-21 expression was significantly decreased in infarcted areas of rat hearts rat hearts 6 hours after AMI. Dong et al[27] have confirmed that miR-21 has a protective effect against cardiac cell apoptosis via its target gene PDCD4 in the early phase of AMI. An elevated expression of hsa-miR-21-5p was also identified in this study. Thus, hsa-miR-21-5p may also be involved in AMI via regulating various DEGs, such as SOCS3 and COL5A2.
VAPA encoding vesicle-associated membrane protein associated protein-A showed an upregulated expression in AMI patients here. According to the previously published literatures, VAPA is commonly involved in the regulation of endoplasmic reticulum to Golgi transportation via binding to oxysterol-binding protein, by which to regulate vesicle transport and sterol homeostasis.[28–30] However, the biofunction of VAPA in AMI is rarely reported, and only Zhao et al[31] have reported that VAPA is markedly decreased in the infarcted myocardium of rats, which is contrary to our identification. Therefore, further investigation of VAPA in AMI was still required. Here, VAPA expression was predicated to be regulated by MYBL2 and hsa-miR-30c-5p. MYBL2 encodes a member of the MYB family member Myb-related protein B. Increased MYBL2 expression was reported in the peripheral blood leukocytes of humans with acute ischemic stroke[32] and it is also implicated to participate in the regulation of genes downregulated in left ventricular remodeling following myocardial infarction.[33] Taken together, VAPA upregulation observed here may be elevated by transcription factor MYBL2. Hsa-miR-30c-5p has been reported as an apoptosis-related microRNA in myocardial infarction.[34] Duisters et al[35] further reported that miR-30 directly downregulated connective tissue growth factor (CTGF), which thus was considered to have an important role in the control of structural changes in the extracellular matrix of the myocardium, which was consistent with the result validated in this study. Thus, this miRNA may perform an adverse effect in the regulation of VAPA expression in AMI. Another 2 upregulated genes UBN1 and NDEL1 were also speculated to be regulated by MYBL2 and hsa-miR-30c-5p. UBN1 encodes the shutting protein ubinuclein 1, which was an interacting partner of RACK1 protein, and the latter is confirmed to have a role in the process of myocardial damage.[36] Thus, we assume that UBN1 may be involved in the pathogenesis of AMI. However, NDEL1 encoding a thiol-activated oligopeptidase that is involved in the regulation of cytoplasmic dynein function and microtubule organization during mitotic cell division has never been reported in AMI.
However, there were also some limitations that should be strengthened in this study. First, because most of the results in this study were obtained from in silico analysis, thus, further experimental validations should be required. Second, although expression levels of several DEGs and predicted miRNA were verified to be consistent with the bioinfomatic analysis results, the regulatory ships between them were still not be confirmed, as well as the enrichment analytical results. Third, some of the results identified in this study were not consistent with previously published results in other diseases. Therefore, further validations in both in vivo and in vitro were still needed. Despite these limitations, our study also provided some new insights in the mechanism of AMI.
In summary, we identified 41 DEGs, such as SOCS3, VAPA, and COL5A2, that were speculated to have a role in the pathogenesis of AMI, as well as 2 transcription factors FOXO3 and MYBL2, and 2 miRNAs hsa-miR-21-5p and hsa-miR-30c-5p that might regulate the expression of these DEGs. Our work provides some potential genes for the targeted therapy of AMI and its early detection. However, as some of our findings are not consistent with the published references, we have to further validate them by other means.
Footnotes
Abbreviations: AMI = acute myocardial infarction, CTGF = connective tissue growth factor, FI = functional interaction, H-FABP = heart fatty acid binding protein, RT-PCR = real-time PCR.
MC and SA should be regarded as cofirst authors.
Funding/support: This study was supported by Youth Science Foundation of Heilongjiang Province (No.: QC2013C116) and Sub-project of National Hi-tech Research and Development Plan Foundation (No.: 2007AA021907).
The authors declare that they have no competing interests.
References
- [1].Granger CB, Califf RM, Topol EJ. Thrombolytic therapy for acute myocardial infarction. Drugs 1992;44:293–325. [DOI] [PubMed] [Google Scholar]
- [2].Aversano T, Aversano LT, Passamani E, et al. Thrombolytic therapy vs primary percutaneous coronary intervention for myocardial infarction in patients presenting to hospitals without on-site cardiac surgery: a randomized controlled trial. JAMA 2002;287:1943–51. [DOI] [PubMed] [Google Scholar]
- [3].Eagle KA, Goodman SG, Avezum A. Practice variations and missed opportunities for reperfusion in ST-segment elevation myocardial infarction: findings from the Global Registry of Acute Coronary Events (GRACE) ☆. Lancet 2002;11:16. [DOI] [PubMed] [Google Scholar]
- [4].Cohen M, Gensini GF, Maritz F, et al. Prospective evaluation of clinical outcomes after acute ST-elevation myocardial infarction in patients who are ineligible for reperfusion therapy: preliminary results from the TETAMI registry and randomized trial. Circulation 2003;108:14–21. [DOI] [PubMed] [Google Scholar]
- [5].Keller T, Zeller T, Peetz D, et al. Sensitive troponin I assay in early diagnosis of acute myocardial infarction. N Engl J Med 2009;361:868–77. [DOI] [PubMed] [Google Scholar]
- [6].Roppolo LP, Fitzgerald R, Dillow J, et al. A comparison of troponin T and troponin I as predictors of cardiac events in patients undergoing chronic dialysis at a Veteran's Hospital: a pilot study. J Am Coll Cardiol 1999;34:448–54. [DOI] [PubMed] [Google Scholar]
- [7].Mccann CJ, Glover BM, Menown IB, et al. Novel biomarkers in early diagnosis of acute myocardial infarction compared with cardiac troponin T. Eur Heart J 2008;29:2843–50. [DOI] [PubMed] [Google Scholar]
- [8].Adachi T, Nakanishi M, Otsuka Y, et al. Plasma microRNA 499 as a biomarker of acute myocardial infarction. Clin Chem 2010;56:1183–5. [DOI] [PubMed] [Google Scholar]
- [9].Wang GK, Zhu JQ, Zhang JT, et al. Circulating microRNA: a novel potential biomarker for early diagnosis of acute myocardial infarction in humans. Eur Heart J 2010;31:659–66. [DOI] [PubMed] [Google Scholar]
- [10].Ai J, Zhang R, Li Y, et al. Circulating microRNA-1 as a potential novel biomarker for acute myocardial infarction. Biochem Biophys Res Commun 2010;391:73–7. [DOI] [PubMed] [Google Scholar]
- [11].Carvalho B, Bengtsson H, Speed TP, et al. Exploration, normalization, and genotype calls of high-density oligonucleotide SNP array data. Biostatistics 2007;8:485–99. [DOI] [PubMed] [Google Scholar]
- [12].Huang da W, Sherman BT, Lempicki RA. Systematic and integrative analysis of large gene lists using DAVID bioinformatics resources. Nat Protoc 2008;4:44–57. [DOI] [PubMed] [Google Scholar]
- [13].Wu G, Dawson E, Duong A, et al. ReactomeFIViz: a Cytoscape app for pathway and network-based data analysis. F1000Res 2014;3:146–246. [DOI] [PMC free article] [PubMed] [Google Scholar]
- [14].Shannon P, Markiel A, Ozier O, et al. Cytoscape: a software environment for integrated models of biomolecular interaction networks. Genome Res 2003;13:2498–504. [DOI] [PMC free article] [PubMed] [Google Scholar]
- [15].Dweep H, Gretz N. miRWalk2.0: a comprehensive atlas of microRNA-target interactions. Nat Methods 2015;12:697. [DOI] [PubMed] [Google Scholar]
- [16].Janky R, Verfaillie A, Imrichová H, et al. iRegulon: from a gene list to a gene regulatory network using large motif and track collections. PLoS Comput Biol 2014;10:e1003731. [DOI] [PMC free article] [PubMed] [Google Scholar]
- [17].Terrell AM, Crisostomo PR, Wairiuko GM, et al. Jak/STAT/SOCS signaling circuits and associated cytokine-mediated inflammation and hypertrophy in the heart. Shock 2006;26:226–34. [DOI] [PubMed] [Google Scholar]
- [18].Shi J, Wei L. Regulation of JAK/STAT signalling by SOCS in the myocardium. Cardiovasc Res 2012;96:345–7. [DOI] [PubMed] [Google Scholar]
- [19].Seki YI, Hayashi K, Matsumoto A, et al. Expression of the suppressor of cytokine signaling-5 (SOCS5) negatively regulates IL-4-dependent STAT6 activation and Th2 differentiation. Proc Natl Acad Sci U S A 2002;99:13003–8. [DOI] [PMC free article] [PubMed] [Google Scholar]
- [20].Linossi EM, Chandrashekaran IR, Kolesnik TB, et al. Suppressor of Cytokine Signaling (SOCS) 5 utilises distinct domains for regulation of JAK1 and interaction with the adaptor protein Shc-1. PLoS One 2013;8:e70536. [DOI] [PMC free article] [PubMed] [Google Scholar]
- [21].Toghi M, Taheri M, Arsang-Jang S, et al. SOCS gene family expression profile in the blood of multiple sclerosis patients. J Neurol Sci 2017;375:481. [DOI] [PubMed] [Google Scholar]
- [22].Zhang S, Liu X, Goldstein S, et al. Role of the JAK/STAT signaling pathway in the pathogenesis of acute myocardial infarction in rats and its effect on NF-(B expression. Mol Med Rep 2013;7:93–8. [DOI] [PubMed] [Google Scholar]
- [23].Azuaje F, Lu Z, Jeanty C, et al. Analysis of a gene co-expression network establishes robust association between Col5a2 and ischemic heart disease. BMC Med Genomics 2012;6:1988–94. [DOI] [PMC free article] [PubMed] [Google Scholar]
- [24].Wang Y, Lin W, Li C, et al. Multipronged therapeutic effects of Chinese herbal medicine Qishenyiqi in the treatment of acute myocardial infarction. Front Pharmacol 2017;8:98. [DOI] [PMC free article] [PubMed] [Google Scholar]
- [25].Evans-Anderson HJ, Alfieri CM, Yutzey KE. Regulation of cardiomyocyte proliferation and myocardial growth during development by FOXO transcription factors. Circ Res 2008;102:686–94. [DOI] [PubMed] [Google Scholar]
- [26].Sengupta A, Molkentin JD, Paik JH, et al. FoxO transcription factors promote cardiomyocyte survival upon induction of oxidative stress. J Biol Chem 2011;286:7468–78. [DOI] [PMC free article] [PubMed] [Google Scholar]
- [27].Dong S, Cheng Y, Yang J, et al. MicroRNA expression signature and the role of microRNA-21 in the early phase of acute myocardial infarction. J Biol Chem 2009;284:29514–25. [DOI] [PMC free article] [PubMed] [Google Scholar]
- [28].Prosser DC, Tran D, Gougeon PY, et al. FFAT rescues VAPA-mediated inhibition of ER-to-Golgi transport and VAPB-mediated ER aggregation. J Cell Sci 2008;121:3052–61. [DOI] [PMC free article] [PubMed] [Google Scholar]
- [29].Wyles JP, Mcmaster CR, Ridgway ND. Vesicle-associated membrane protein-associated protein-A (VAP-A) interacts with the oxysterol-binding protein to modify export from the endoplasmic reticulum. J Biol Chem 2002;277:29908–18. [DOI] [PubMed] [Google Scholar]
- [30].Weber-Boyvat M, Kentala H, Lilja J, et al. OSBP-related protein 3 (ORP3) coupling with VAMP-associated protein A regulates R-Ras activity. Exp Cell Res 2015;331:278–91. [DOI] [PubMed] [Google Scholar]
- [31].Zhao W, Zhao T, Chen Y, et al. Modification of oxidative stress on gene expression profiling in the rat infarcted heart. Mol Cell Biochem 2013;379:243–53. [DOI] [PMC free article] [PubMed] [Google Scholar]
- [32].Yan J, Liu J, Greer JM, et al. Increased expression of the hypoxia-related genes in peripheral blood leukocytes of human subjects with acute ischemic stroke. Clin Exp Neuroimmunol 2014;5:216–26. [Google Scholar]
- [33].Kuster DWD, Merkus D, Kremer A, et al. Left ventricular remodeling in swine after myocardial infarction: a transcriptional genomics approach. Basic Res Cardiol 2011;106:1269–81. [DOI] [PMC free article] [PubMed] [Google Scholar]
- [34].Liu Q, Du GQ, Zhu ZT, et al. Identification of apoptosis-related microRNAs and their target genes in myocardial infarction post-transplantation with skeletal myoblasts. J Transl Med 2015;13:1–1. [DOI] [PMC free article] [PubMed] [Google Scholar]
- [35].Duisters RF, Tijsen AJ, Schroen B, et al. miR-133 and miR-30 regulate connective tissue growth factor implications for a role of micrornas in myocardial matrix remodeling. Circ Res 2009;104:170–261. [DOI] [PubMed] [Google Scholar]
- [36].Jia X, Zhang L, Mao X. S-propranolol protected H9C2 cells from ischemia/reperfusion-induced apoptosis via downregultion of RACK1 gene. Int J Clin Exp Pathol 2015;8:10335–44. [PMC free article] [PubMed] [Google Scholar]


