Abstract
Is to measure the corneal epithelial thickness (CET) in a group of healthy Egyptian population and to investigate its variation with age and sex using spectral domain-anterior segment optical coherence tomography (SD-AS-OCT).
This cross-sectional observational study includes 240 eyes of 120 healthy individuals (60 men, 60 women). Each gender was divided into 4 equal groups according to age as follows (18–29 years), (30–44 years), (45–59 years), and (60–80 years). The CET in 17 points over a corneal diameter of 6.0 mm was measured in each subject by SD-AS-OCT. The regional thickness changes were compared in different age groups of each gender separately and the correlations between the CET, age, and gender were analyzed.
The CET of the central cornea (2 mm), the paracentral and the midperipheral zones (2–5 and 5–6 mm, respectively) of all males and females groups demonstrates highly significant changes with age (P < .001) with no significant difference between males and females. The measured parameters in the 2 age groups below 45 and above 45 years old revealed statistically significant difference with lower values in the elderly group (P < .001).
The CET became thinner with age in the central, paracentral, and midperipheral zones in both genders and there is no difference between males and females. These findings could be valuable in refractive surgeries especially in age over 45.
Keywords: age, anterior segment optical coherence tomography, corneal epithelial thickness, gender
1. Introduction
The corneal epithelium plays an important role in the optics of the eye. It maintains the corneal integrity and function and influences tear film stability.[1] The alterations of corneal epithelial thickness (CET) are found in many pathological conditions such as contact lens wearing,[2] dry eye and keratoconus.[3] Knowledge of the topographic CET profile and of how it can change has been applied in clinical evaluation of various corneal disorders[4–7] and in refractive surgery.[8–10]
Several imaging modalities, such as high frequency scanning ultrasound biomicroscopy,[8,11] confocal microscopy,[12–14] and optical coherence tomography (OCT)[9,15,16] have facilitated measurement of CET. Spectral domain-anterior segment optical coherence tomography (SD-AS-OCT) has been reported as noninvasive, repeatable and reproducible method with higher scanning speed and resolution.[4–7]
The influence of age, sex, and ethnic variability on CET has yet to be fully explored.[8,9,13,14,17] Some authors using very high frequency (VHF) digital ultrasound and spectral domain-OCT reported no correlation between CET and age,[8,18] but other study found thinning of the CET with age.[19] Also, there are some reports of the cornea being thicker in men than in women.[9,20–22]
1.1. Objective
After controlling the gender and ethnic factors, our objective was to map the corneal epithelium, measuring its thickness in different age groups, study the effect of age and sex and to compare between both genders using SD-AS-OCT. This study had been performed in the Ophthalmic Unit, Faculty of Medicine, Ain Shams University Hospitals, Cairo, Egypt, during the period of September 2016 through February 2017.
2. Methods
The study was approved from the ethical committee of the university and a written informed consent was obtained from all the participants.
Two hundred forty eyes from a 120 normal healthy adults were included in the study. Cases were divided into 8 equal groups, 4 groups of each gender according to age as follows: group 1 (18–29 years), group 2 (30–44 years), group 3 (45–59 years), and group 4 (60–80 years). The CET in 4 groups of each gender was compared with each other regarding age changes. Males and females groups were compared together regarding gender effect.
Before enrollment, subjects with definite diagnosis of diabetes mellitus, autoimmune disease, ocular trauma or surgery, current or long-term topical medications, corneal opacity, corneal dystrophies, keratoconus, myopia of >−5.00, history of contact lens wear, and dry eye were excluded from the study.
All subjects underwent anterior segment Spectral Domain AC-OCT with the Cirrus HD-OCT model 5000 (Carl Zeiss Meditec, Germany). The machine takes 27,000 A-scans per second. It has an axial resolution of 5 μm, transverse resolution of 15 μm, and A-scan depth of 2 mm. The super luminescent diode optical source has a scan beam wavelength of 840 nm and exposure power at the cornea of less than 720 μW. The CET was obtained automatically by the built-in analysis software of the OCT system.
The patient was positioned on the headrest. All scans were performed with the patient's eye wide open with no topical anesthesia. The CET was measured over a 6-mm diameter. The CET maps were generated automatically and divided into a total of 17 sectors: 1 central 2-mm diameter zone, 8 paracentral zones within an annulus between the 2- and 5-mm-diameter rings, and 8 midperipheral zones within an annulus between the 5- and 6-mm-diameter rings. In addition to the average values in the 17 areas, the minimal/maximal thickness, nasal/temporal difference, inferior–superior difference, the mean values of 8 paracentral zones and 8 midperipheral zones and the topographic thickness variability in these zones were calculated and compared among the 4 age groups in both genders.
2.1. Statistics
Statistical analyses were performed using SPSS version 20.0 for Windows (IBM Corp., Armonk, NY). One-way ANOVA was used to compare the means of 3 or more categories. The 2-way ANOVA was used to compare means across 2 categorical variables. Spearman correlation was used to correlate between 2 variables that are ranks in nature. Pearson correlation was used to correlate between 2 numerical variables. Both spearman and Pearson correlation coefficient measure the linear association between 2 variables. Pairwise post hoc was used to compare pairwise and is usually done using Bonferroni correction. P-value of <.001 was taken to indicate a significant differences.
3. Results
A total of 240 eyes of 120 healthy Egyptian individuals (60 men, 60 women) with a mean age of 46.34 ± 18.36 for males and 44.74 ± 18.07 for females were included in the study.
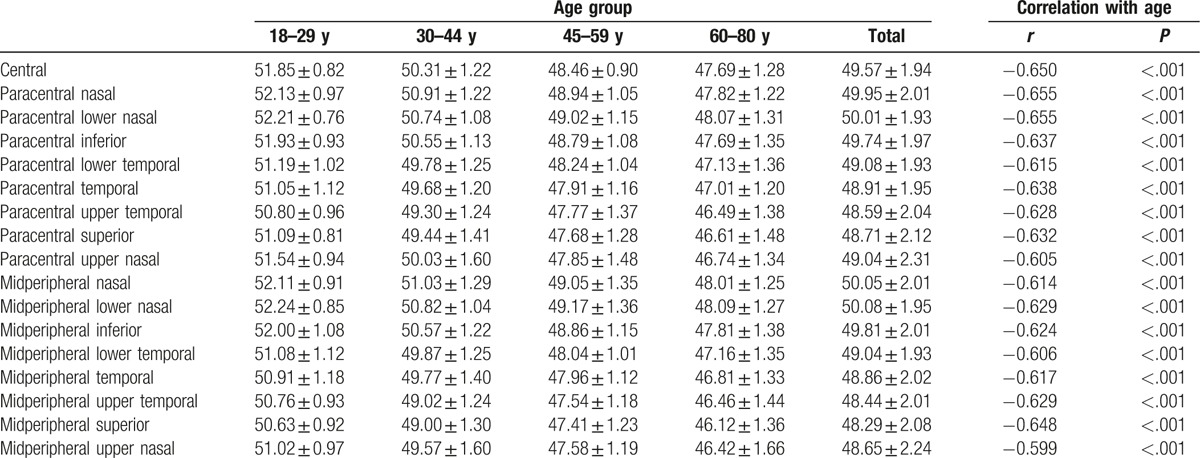
The corneal epithelium thickness (CET) of the central cornea (2 mm) was 52.19 ± 0.77 μm, 50.30 ± 1.44 μm, 47.48 ± 1.48 μm, and 47.89 ± 1.60 μm for the 4 males groups, respectively, and 51.58 ± 0.82 μm, 50.31 ± 1.22 μm, 48.46 ± 0.9 μm, and 47.69 ± 1.28 μm for the 4 females groups, respectively, demonstrating highly significant change with age (P < .001) in both gender. The CET in all the paracentral and all the midperipheral zones (2–5 and 5–6 mm, respectively) differed significantly among the 4 groups of both genders demonstrating highly significant change with age (P < .001) (Tables 1 and 2).
Table 1.
Corneal epithelial thickness in different sectors in male groups according to age.
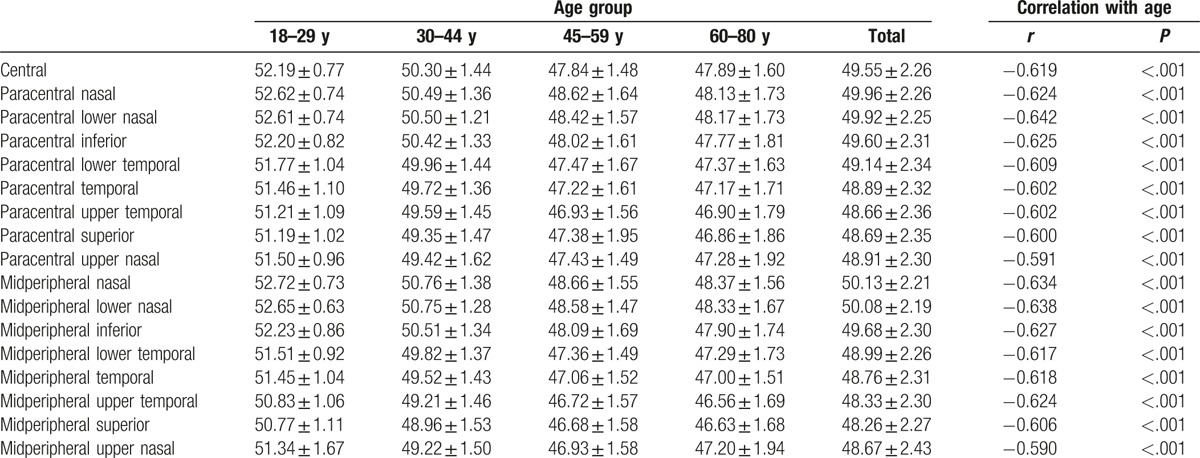
Table 2.
Corneal epithelial thickness in different sectors in 4 female groups according to age.
The average CET of the central cornea measured 49.55 ± 2.26 μm for males and 49.57 ± 1.94 μm for females (P = .937). The paracentral zones measured 49.22 ± 2.22 μm for males and 49.25 ± 1.96 μm for females (P = .912). The midperipheral zones measured 49.11 ± 2.2 μm for males and 49.15 ± 1.95 μm for females (P = .881), demonstrating no statistically significant difference between males and females in each of the measured parameters. The effect of age on the parameters is not altered by the gender (Table 3).
Table 3.
Gender differences in corneal epithelial thickness.

Figure 1 shows the distribution of the mean CET of the total subjects in different age groups. There is significant difference in regional thickness in all sectors P < .001. Figure 2 shows the distribution of CET of total subjects and correlation with age (the mean SD and the correlation coefficient in the 17 measured sectors).
Figure 1.
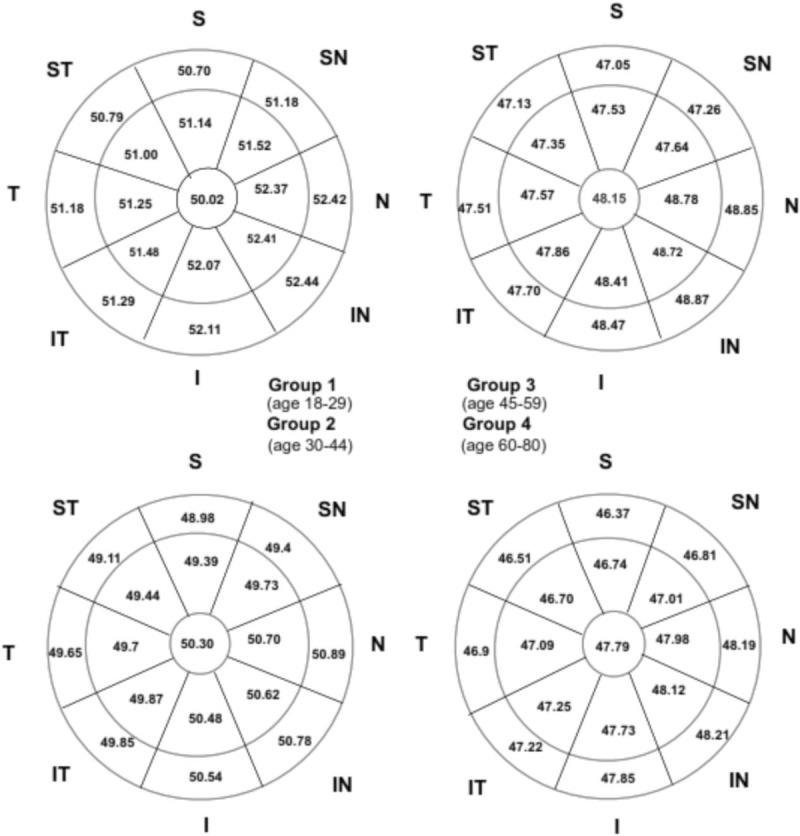
Distribution of the mean corneal epithelium thickness of the total subjects in different age groups. There is significant difference in regional thickness in all sectors (P < .001).
Figure 2.
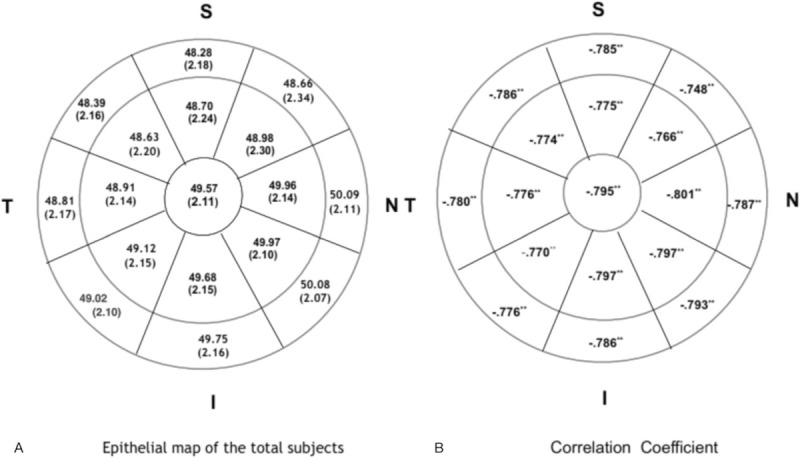
Distribution of corneal epithelium thickness of total subjects and correlation with age (the mean standard deviation and the correlation coefficient in the 17 measured sectors).
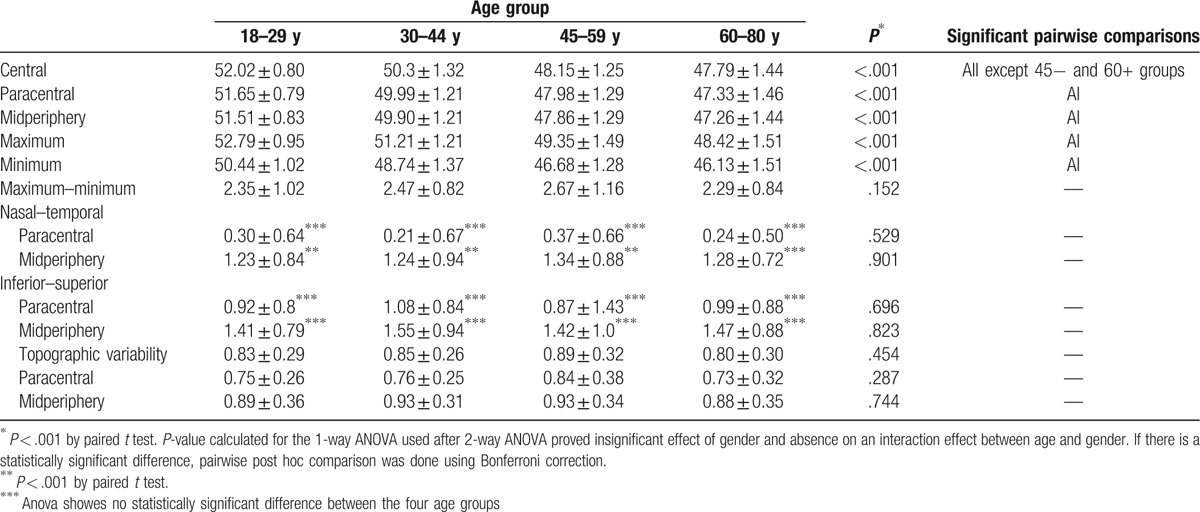
Comparing the measured parameters in the 2 age groups below 45 and above 45 years old revealed statistically significant difference with lower values in the elderly group (P < .001). Pairwise comparison showed statistically significant difference between each pair except the 45 to 59 years and 60+ years where in most of the parameters there was no statistically significant difference.
In this study the mean CET found to be 49.21 ± 2.24 μm. The superior thickness was 48.61 ± 2.25 μm, inferior thickness was 49.60 ± 2.16 μm, minimum thickness was 48.0 ± 2.15 μm, maximum thickness was 50.45 ± 2.14 μm, and topographic variability was 0.83 ± 0.29 μm. All the obtained data were compared among different age groups. The inferior–superior differences and the nasal–temporal differences were significant in all of the groups. The inferior epithelium was thicker than the superior one, and the nasal epithelium was thicker than the temporal one. The inferior–superior difference was larger than the nasal–temporal difference. The minimum and the maximum CET values showed a significant tendency toward thinning with age. The difference in the maximal and minimal CET and topographic variability are insignificantly affected.
The effect of age on the parameters is not altered by the gender of the subject. Spearman correlation coefficient was calculated between each of the measured parameters and age in years and there was statistically significant negative moderate to strong correlation between age and each of the measured parameters in the whole group as well as in either gender (Table 4).
Table 4.
Comparison of corneal epithelium thickness among different age groups of both gender.
4. Discussion
Recent advances in ophthalmic technology allowed the measurement of the CET, which improve corneal refractive surgery and provide more diagnostic accuracy in some corneal diseases.[8–10] Demographic, ethnic, and ophthalmologic factors have been reported to be correlated with corneal thickness[20,22–25] and these factors could also influence the CET.
The influence of age on CET has yet to be fully explained.[8,9,13,14,17]
Different studies reported no correlation between CET and age. Reinstein et al[8] reported that the CET is correlated with neither age nor refraction. The same finding had been reported by Rush et al.[26] Francoz et al[18] reported no identified significant associations between CET and age. Kanellopoulos and Asimellis[9] noted increase in the topographic variability of CET with age, but they did not find age-related differences in CET. The contrary has been also reported. Yang et al[19] reported age-related thinning of the CET in the paracentral and midperiphery with age while the central 2-mm diameter zone showing no significant change. The same finding had been reported by Kim et al.[27]
In this study we did control gender to evaluate the correlation of CET with age because there are some reports of the cornea being thicker in men than in women,[9,20–22,26] and some suggestions that endocrine differences may affect ocular tissue growth.[28,29] In spite of this potential hormonal influence on corneal thickness, the exact role is obscure.
There was no statistically significant difference between males and females regarding CET in all the measured areas in all groups of age (Table 3). There was also significant thinning in the central 2 mm of the central cornea in both genders in the different age groups (Tables 1 and 2). Thinning of the central 2 mm of CET in our study is uncommon finding in the previous studies.[19,27] We also reported thinning of the paracentral and midperipheral areas, a common finding previously reported.[19,27]
The mean CET (central 6 mm) was 49.21 ± 2.24 μm. This is in the range of (48–59 μm) which has been reported in literature.[8,9,15,26–30] We reported superior thickness of 48.61 ± 2.25 μm, inferior 49.60 ± 2.16 μm, minimum 48.0 ± 2.15 μm, maximum 50.45 ± 2.14 μm, and topographic variability was 0.83 ± 0.29 μm (Table 4).
The inferior epithelium was thicker than the superior one, and the nasal epithelium was thicker than the temporal one. The inferior–superior difference and the nasal–temporal differences were significant in all of the groups and the inferior–superior difference was larger than the nasal–temporal difference. In accordance with our study, it has been reported that the inferior–superior difference was always significant in most of the studies, but the nasal–temporal difference was not always significant.[19,27]
In all studies, inferior–superior difference was always larger than the nasal–temporal difference.[26,27] The thinner superior epithelium has been attributed to the effect of blinking and friction produced by the eyelid.[8] We also reported that both the maximum and the minimum CET tend to thin with age. In contrary, some studies reported that the minimal CET value showed a significant tendency toward thinning with increasing age, while the maximum CET value remained unchanged.[19,27] The nasal epithelium being thicker than the temporal is a previously reported unexplained finding. The reason could be due to the fact that the nasal cornea is more protected than the temporal cornea.
In a study done by Kanellopoulos and Asimellis[9] central epithelial thickness was 53.28 ± 3.34 μm, superior 51.86 ± 3.78 μm, inferior 53.81 ± 3.44 μm, minimum 48.65 ± 4.54 μm, maximum 56.35 ± 3.80 μm, and topographic variability was 1.78 ± 0.78 μm. In a study done in normal eyes by Li et al[15] the central, superior, and inferior epithelial thickness averages were 52.3 ± 3.6 μm, 49.6 ± 3.5 μm, and 51.2 ± 3.4 μm.
Agarwal[30] reported mean epithelial thickness of 58.5 ± 2 μm on Fourier domain OCT. Tao et al[31] reported thickness of 52.5 ± 2.4 μm on Fourier domain OCT. Sin and Simpson[32] reported thickness of 52 ± 3 μm on time domain OCT while Reinstein et al[8] reported thickness of 53.4 ± 4.6 μm on Artemis 1 (Arc Scan) very high-frequency digital ultrasound. Yang et al[19] reported average CET (53.2 ± 2.9 μm) measured by OCT system (Optovue, Inc., Fremont, CA) in the range of (48.0–59.9 μm). Rush et al[26] reported a mean CET of 51.0 μm with a range of 43 to 61 μm. The average central CET reported by Kim et al falls within the range of (48.0–59.9 μm). Central ET (2 mm) was reported to be 54.49 ± 3.36 for males and 52.98 ± 3.69 for females.[27]
The epithelium was found to have a nonuniform thickness, which is a common finding of previous studies.[8,9,11,15,33]Comparing the measured parameters in the 2 age groups below 45 and above 45 years revealed statistically significant difference with lower values in the elderly group. Pairwise comparison showed statistically significant difference between each pair except the 45 to 59 years and 60 to 80 years where in most of the parameters there was no statistically significant difference. Similar results have been reported by Yang et al.[19]
Refractive status is another variable that could affect CET. In all studies including our as well, all individuals were within the range of mild refractive error (<−5.00 D). Individuals with high myopia (>−5.00) were excluded.[21,34] Reinstein et al[8] reported that the CET is not correlated with refraction. The same finding had been reported by Rush et al.[26]
Ethnic variability could be a considerable factor in CET. Our study includes only healthy Egyptian adults of all ages, the results demonstrate that the CET did thin with age in the central 2 mm zone, paracentral zone 2 to 5 mm and midperipheral zones 5 to 6 mm in all age groups and in both genders. It also demonstrated that gender was not correlated with CET. In a study including only healthy Korean adults of all ages the results demonstrate that the CET did thin with age in paracentral and midperipheral with the exception of the central zone. It also demonstrated that gender was correlated with CET.[27]
In conclusion, age seemed to have its effect on CET of the central 2 mm, the paracentral and midperipheral cornea up to 6 mm in diameter, being thinner with increasing age. There was no difference between males and females. These findings could be valuable in corneal refractive surgeries especially in age above 45.
The possible explanation for the inconsistencies in the results of different studies could be the uncontrolled factors affecting the CET measurement such as gender, race, ethnic variability, refraction, tear film thickness, the climatic state in the tested region and using equipment of different technology.
We hope to have future imaging technologies with higher resolution, with capability to cover the entire cornea and with the ability to exclude tear film thickness in the measurement. All these will help in evaluation CET more accurately and confirm its association with aging.
Acknowledgment
To Dr. Mustafa, HM, Professor of Community and Public Health, Faculty of Medicine Ain Shams University for performing the statistics of this study.
Footnotes
Abbreviations: CET = corneal epithelial thickness, SD-AS-OCT = spectral domain-anterior segment optical coherence tomography.
The authors have no conflicts of interest to disclose.
References
- [1].Tseng SCG. Concept and application of limbal stem cells. Eye 1989;3:141–57. [DOI] [PubMed] [Google Scholar]
- [2].Hong J, Qian T, Yang Y, et al. Corneal epithelial thickness map in long-term soft contact lenses wearers. Optom Vis Sci 2014;91:1455–61. [DOI] [PubMed] [Google Scholar]
- [3].Temstet C, Sandali O, Bouheraoua N, et al. Corneal epithelial thickness mapping using Fourier-domain optical coherence tomography for detection of form fruste keratoconus. J Cataract Refract Surg 2015;41:812–20. [DOI] [PubMed] [Google Scholar]
- [4].Wang J, Fonn D, Simpson TL, et al. The measurement of corneal epithelial thickness in response to hypoxia using optical coherence tomography. Am J Ophthalmol 2002;133:315–9. [DOI] [PubMed] [Google Scholar]
- [5].Shen M, Wang MR, Yuan Y. SD-OCT with prolonged scan depth for imaging the anterior segment of the eye. Ophthalmic Surg Lasers Imaging 2010;(suppl 41):S65–9. [DOI] [PubMed] [Google Scholar]
- [6].Kanellopoulos AJ, Asimellis G. In vivo 3-dimensional corneal epithelial thickness mapping as an indicator of dry eye. Am J Ophthalmol 2014;157:63–8. [DOI] [PubMed] [Google Scholar]
- [7].Prakash G, Agarwal A, Mazhari AI. Reliability and reproducibility of assessment of corneal epithelial thickness by Fourier domain optical coherence tomography. Invest Ophthalmol Vis Sci 2012;53:2580–5. [DOI] [PubMed] [Google Scholar]
- [8].Reinstein DZ, Archer TJ, Gobbe M, et al. Epithelial thickness in the normal cornea: three-dimensional display with artemis very high-frequency digital ultrasound. J Refract Surg 2008;24:571–81. [DOI] [PMC free article] [PubMed] [Google Scholar]
- [9].Kanellopoulos AJ, Asimellis G. In vivo three-dimensional corneal epithelium imaging in normal eyes by anterior-segment optical coherence tomography: a clinical reference study. Cornea 2013;32:1493–8. [DOI] [PubMed] [Google Scholar]
- [10].Reinstein DZ, Yap TE, Archer TJ, et al. Comparison of corneal epithelial thickness measurement between Fourier-domain OCT and very high-frequency digital ultrasound. J Refract Surg 2015;31:438–45. [DOI] [PMC free article] [PubMed] [Google Scholar]
- [11].Kanellopoulos AJ, Aslanides I, Asimellis G. Correlation between epithelial thickness in normal corneas, untreated ectatic corneas, and ectatic corneas previously treated with CXL; is overall epithelial thickness a very early ectasia prognostic factor. Clin Ophthalmol 2012;6:789–800. [DOI] [PMC free article] [PubMed] [Google Scholar]
- [12].Eckard A, Stave J, Guthoff RF. In vivo investigations of the corneal epithelium with the confocal Rostock Laser Scanning Microscope (RLSM). Cornea 2006;25:127–31. [DOI] [PubMed] [Google Scholar]
- [13].Li HF, Petroll WM, Møller-Pedersen T, et al. Epithelial and corneal thickness measurements by in vivo confocal microscopy through focusing (CMTF). Curr Eye Res 1997;16:214–21. [DOI] [PubMed] [Google Scholar]
- [14].Patel S, McLaren J, Hodge D, et al. Normal human keratocyte density and corneal thickness measurement by using confocal microscopy in vivo. Invest Ophthalmic Vis Sci 2001;42:333–9. [PubMed] [Google Scholar]
- [15].Li Y, Tan O, Brass R, et al. Corneal epithelial thickness mapping by Fourier-domain optical coherence tomography in normal and keratoconic eyes. Ophthalmology 2012;119:2425–33. [DOI] [PMC free article] [PubMed] [Google Scholar]
- [16].Haque S, Simpson T, Jones L. Corneal and epithelial thickness in keratoconus: a comparison of ultrasonic pachymetry, Orbscan II, and optical coherence tomography. J Refract Surg 2006;22:486–93. [DOI] [PubMed] [Google Scholar]
- [17].Niederer RL, Perumal D, Sherwin T, et al. Age-related differences in the normal human cornea: a laser scanning in vivo confocal microscopy study. Br J Ophthalmol 2007;91:1165–9. [DOI] [PMC free article] [PubMed] [Google Scholar]
- [18].Francoz M, Karamoko I, Baudouin C, et al. Ocular surface epithelial thickness evaluation with spectral-domain optical coherence tomography. Invest Ophthalmol Vis Sci 2011;52:9116–23. [DOI] [PubMed] [Google Scholar]
- [19].Yang Y, Hong J, Deng SX, et al. Age-related changes in human corneal epithelial thickness measured with anterior segment optical coherence tomography. Invest Ophthalmol Vis Sci 2014;55:5032–8. [DOI] [PubMed] [Google Scholar]
- [20].Shimmyo M, Ross AJ, Moy A, et al. Intra ocular pressure, Goldmann applanation tension, corneal thickness, and corneal curvature in Caucasians, Asians, Hispanics, and African Americans. Am J Ophthalmol 2003;136:603–13. [DOI] [PubMed] [Google Scholar]
- [21].Wang X, Dong J, Wu Q. Corneal thickness, epithelial thickness and axial length differences in normal and high myopia. BMC Ophthalmol 2015;15:49–53. [DOI] [PMC free article] [PubMed] [Google Scholar]
- [22].Suzuki S, Suzuki Y, Iwase A, et al. Corneal thickness in an ophthalmologically normal Japanese population. Ophthalmology 2005;112:1327–36. [DOI] [PubMed] [Google Scholar]
- [23].Hahn S, Azen S, Ying-Lai M, et al. Central corneal thickness in Latinos. Invest Ophthalmol Vis Sci 2003;44:1508–12. [DOI] [PubMed] [Google Scholar]
- [24].Hashemi H, Yazdani K, Mehravaran S, et al. Corneal thickness in a population-based, cross-sectional study: the Tehran Eye Study. Cornea 2009;28:395–400. [DOI] [PubMed] [Google Scholar]
- [25].Cho P, Lam C. Factors affecting the central corneal thickness of Hong Kong-Chinese. Curr Eye Res 1999;18:368–74. [DOI] [PubMed] [Google Scholar]
- [26].Rush SW, Matulich J, Biskup J, et al. Corneal epithelial thickness measured by manual electronic caliper spectral domain optical coherence tomography: distributions and demographic correlations in preoperative refractive surgery patients. Asia Pac J Ophthalmol 2016; 5:147–150. [DOI] [PubMed] [Google Scholar]
- [27].Kim BJ, Ryu IH, Kim SW. Age-related differences in corneal epithelial sickness measurements with anterior segment optical coherence tomography. Jpn J Ophthalmol 2016;60:357–64. [DOI] [PubMed] [Google Scholar]
- [28].Gupta PD, Johar K, Sr, Nagpal K, et al. Sex hormone receptors in the human eye. Surv Ophthalmol 2005;50:274–84. [DOI] [PubMed] [Google Scholar]
- [29].Giuffre G, Di Rosa L, Fiorino F, et al. Variations in central corneal thickness during the menstrual cycle in women. Cornea 2007;26:144–6. [DOI] [PubMed] [Google Scholar]
- [30].Agarwal A. Assessment of corneal epithelial thickness by Fourier domain OCT. Ocular Surgery News US Edition, September 10, 2011. [Google Scholar]
- [31].Tao A, Wang J, Chen Q, et al. Topographic thickness of Bowman's layer determined by ultra-high resolution spectral domain-optical coherence tomography. Invest Ophthalmol Vis Sci 2011;52:3901–7. [DOI] [PMC free article] [PubMed] [Google Scholar]
- [32].Sin S, Simpson TL. The repeatability of corneal and corneal epithelial thickness measurements using optical coherence tomography. Optom Vis Sci 2006;83:360–5. [DOI] [PubMed] [Google Scholar]
- [33].Simon G, Ren Q, Kervick GN, et al. Optics of the corneal epithelium. Refract Corneal Surg 1993;9:42–50. [PubMed] [Google Scholar]
- [34].Chang SW, Tsai IL, Hu FR, et al. The cornea in young myopic adults. Br J Ophthalmol 2001;85:916–20. [DOI] [PMC free article] [PubMed] [Google Scholar]


