Abstract
Purpose
Sorafenib is currently the only Food and Drug Administration–approved first-line therapy for patients with advanced hepatocellular carcinoma. There are few data examining how sorafenib starting dose may influence patient outcomes and costs.
Patients and Methods
We retrospectively evaluated 4,903 patients from 128 Veterans Health Administration hospitals who were prescribed sorafenib for hepatocellular carcinoma between January 2006 and April 2015. After 1:1 propensity score matching to account for potential treatment bias, hazard ratios (HRs) were calculated using Cox regression and were tested against a noninferiority margin of HR = 1.1. A matched multivariate logistic regression was performed to adjust for potential confounders. The primary end point was overall survival (OS) of patients who were prescribed standard starting dosage sorafenib (800 mg/d per os) versus that of patients who were prescribed reduced starting dose sorafenib (< 800 mg/d per os).
Results
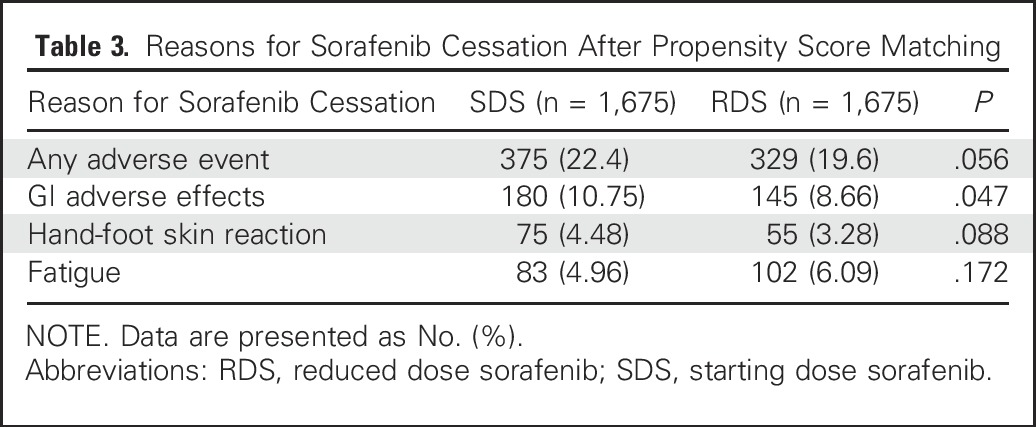
There were 3,094 standard dose sorafenib patients (63%) and 1,809 reduced starting dose sorafenib patients (37%). Reduced starting dose sorafenib patients had more Barcelona Clinic Liver Cancer stage D (P < .001), higher Model for End-Stage Liver Disease Sodium scores (P < .001), higher Child-Turcotte-Pugh scores (P < .001), and higher Cirrhosis Comorbidity Index scores (P = .01). Consequently, reduced starting dose sorafenib patients had lower OS (median, 200 v 233 days, HR = 1.10). After propensity score matching and adjusting for potential confounders, there was no longer a significant OS difference (adjusted hazard ratio [HRadj], 0.92; 95% CI, 0.83 to 1.01), and this fell significantly below the noninferiority margin (P < .001). Reduced starting dose sorafenib patients experienced significantly lower total cumulative sorafenib cost and were less likely to discontinue sorafenib because of gastrointestinal adverse effects (8.7% v 10.8%; P = .047).
Conclusion
The initiation of sorafenib therapy at reduced dosages was associated with reduced pill burden, reduced treatment costs, and a trend toward a decreased rate of discontinuing sorafenib because of adverse events. Reduced dosing was not associated with inferior OS relative to standard dosing.
INTRODUCTION
Hepatocellular carcinoma (HCC) is the second-leading cause of cancer-related deaths worldwide.1-3 Although there are several systemic therapies for HCC, sorafenib, a multikinase inhibitor,4,5 is currently the only Food and Drug Administration–approved first-line therapy for this disease.6,7
One of the primary limitations of sorafenib is its toxicity. In a phase 4 noninterventional study, adverse events (AEs) were reported at a rate of 85.3%, with 31.7% of patients experiencing a grade 3 or 4 AE, and 31.4% discontinuing sorafenib permanently because of an AE.8
Sorafenib is prescribed at a starting dosage of 400 mg per os twice daily.9 A prior study examined an alternative dose-escalation strategy in which a subset of patients was started at a 50% dose of sorafenib and were escalated only if tolerability was maintained.11 Lower rates of AEs and drug discontinuation were observed in the experimental group. However, this was a small study with limited statistical power to assess differences in outcomes between groups. A second, as-yet-unpublished study by Cabrera et al,12 started patients at a 25% dose and increased the dose by 200 mg once every 2 weeks. No differences in outcomes were found.12
Among a large multicenter cohort of Veterans Health Administration (VHA) patients with HCC, we investigated whether initiating sorafenib at a reduced starting dose was associated with a change in overall survival (OS) and whether this was inferior to standard dosing. We also studied the effect of a reduced starting dose on total sorafenib duration, AEs, total sorafenib pill burden, and aggregate drug cost.
PATIENTS AND METHODS
Identification of Patients
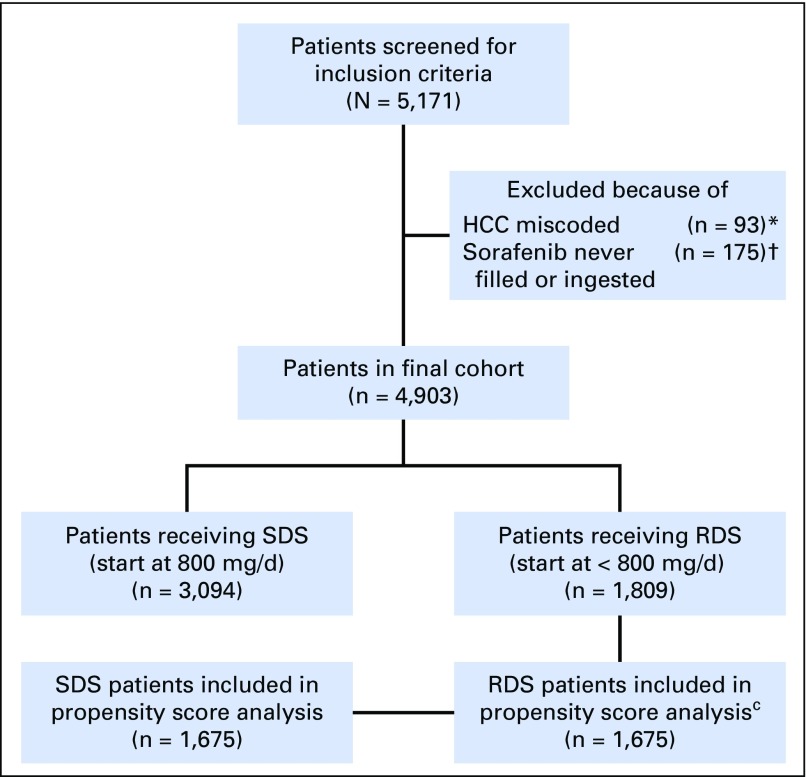
Data were extracted on patients with HCC treated with sorafenib between January 23, 2006, and April 15, 2015, from 128 Veterans Affairs (VA) hospitals via the VHA Corporate Data Warehouse (CDW). The diagnosis of HCC was confirmed by the presence of at least two outpatient encounters or one inpatient encounter with International Classification of Diseases, Ninth Revision, Clinical Modification codes for malignant neoplasm of the liver (155.0 and 155.2), as validated previously.13 Patients incorrectly classified as having HCC and those who were prescribed sorafenib but never ingested pills were excluded (Fig 1). This study was approved by the institutional review board at the VA Connecticut Healthcare System (West Haven, CT) and the Corporal Michael J. Crescenz VA Medical Center (Philadelphia, PA).
Fig 1.
Description of cohort. HCC, hepatocellular carcinoma; RDS, reduced dose sorafenib; SDS, starting dose sorafenib. (*) Patients who were determined to have miscoding of their HCC ICD9 codes based on manual chart review; (†) Patients who were prescribed sorafenib but either never picked up the prescription or never ingested pills; (C)Of the 1,809 RDS patients, 134 patients (7%) had at least one missing variable and therefore could not have propensity score calculated. The remaining 1,675 RDS patients were 1:1 matched to 1,675 SDS patients.
Data Collection
The VA CDW is an integrated and centralized data repository that captures clinical, laboratory, radiologic, procedural, and prescription data for all VA patients. Data available within the 90 days before the sorafenib start date were used. If multiple data points were available, the one closest to the sorafenib start date was used. Baseline demographic data, including age, sex, race, ethnicity, concurrent comorbidities, and Alcohol Use Disorder Identification Test Consumption scores, were collected from the CDW.14 The Cirrhosis Comorbidity Index (CirCom) score was calculated on the basis of relevant comorbidities.15 Active alcohol use was defined as an Alcohol Use Disorder Identification Test Consumption score > 4 in the 1 year before initiation of sorafenib. The presence of active hepatitis B was determined using viral serologies, including a positive hepatitis B surface antigen. The presence of active hepatitis C was defined as the presence of hepatocellular virus (HCV) RNA by standard viral-load polymerase chain reaction assays.
Laboratory data were extracted for all patients. The Model for End-Stage Liver Disease Sodium (MELD-Na) score was calculated on the basis of component laboratory values.16 The electronic Child-Turcotte-Pugh (CTP) score was determined using a previously validated algorithm.17 The presence of concurrent liver-directed therapy, including transarterial chemoembolization, radiofrequency ablation, percutaneous ethanol injection, and 90Y transarterial radioembolization, was determined by querying CDW radiology procedure tables using relevant search phrases.
For any data not available in the CDW, manual chart abstraction was performed by two trained research assistants (R.M. and K.D.). This included the date of HCC diagnosis, tumor characteristics including the number and size(s) of HCC tumors, the presence of macrovascular invasion, local invasion (eg, into gallbladder or diaphragm), lymph node spread and extrahepatic metastatic spread, the presence and severity of ascites and hepatic encephalopathy, Eastern Cooperative Oncology Group (ECOG) performance status, and the specialty of the treating physician. The date of HCC diagnosis was determined using the first date of any of the following: contrast-enhanced computed tomography or magnetic resonance imaging that met diagnostic criteria for HCC,5 pathology report if biopsies were performed, or tumor board discussion in cases of equivocal imaging results. The Barcelona Clinic Liver Cancer (BCLC) stage was calculated on the basis of collected nonmutually exclusive component variables.18
Definition of Study Groups
Pharmacy data were collected for every sorafenib prescription released from a VA pharmacy. The date of first prescription, prescribed dosage (milligrams per day), total number of pills prescribed, total days taking sorafenib, and total treatment-related costs were calculated for each patient.
Patients were classified as receiving standard starting dose sorafenib (SDS) if their first sorafenib dosage was equal to 800 mg/d per os, or as receiving reduced starting dose sorafenib (RDS) if their first sorafenib dosage was < 800 mg/d per os. Our ultimate sample consisted of 3,094 patients classified as standard dose, and 1,809 classified as reduced dose (N = 4,903).
Definition of Outcomes
Our primary outcome of interest was OS, calculated as the time from initiation of sorafenib to date of death, or date of censoring if death did not occur by the cutoff date of December 31, 2015. The date of death was ascertained using the VHA Vital Status Master File, an aggregate of all the main federal mortality databases, shown previously to have a > 97% agreement with the gold standard state death certificate registries.19
Secondary outcomes included total number of days taking sorafenib and the percentage of patients stopping sorafenib because of AEs. The total number of days taking sorafenib was estimated as the total cumulative number of days of therapy per patient, taking treatment breaks into account. This was calculated as the sum of all prescription durations. Total sorafenib cost was calculated by multiplying the total number of sorafenib pills filled per patient by the per-pill cost obtained from the VA pharmacy tables. Reason for sorafenib cessation was obtained via manual chart abstraction.
Statistical Analysis
Univariate analysis was performed using Fisher’s exact test for dichotomous variables and the t test or Wilcoxon rank sum test for normal and non-normal continuous variables, respectively. Hazard ratios (HRs) and 95% CIs were calculated using the Cox proportional hazards model. Separate Cox models were applied to each individual subgroup during subgroup analysis. Groups selected for subgroup analyses were selected a priori, including subgroups that were based on ECOG performance status, CTP class, and BCLC stage. Survival curves for time-to-event variables were estimated using the Kaplan-Meier method.
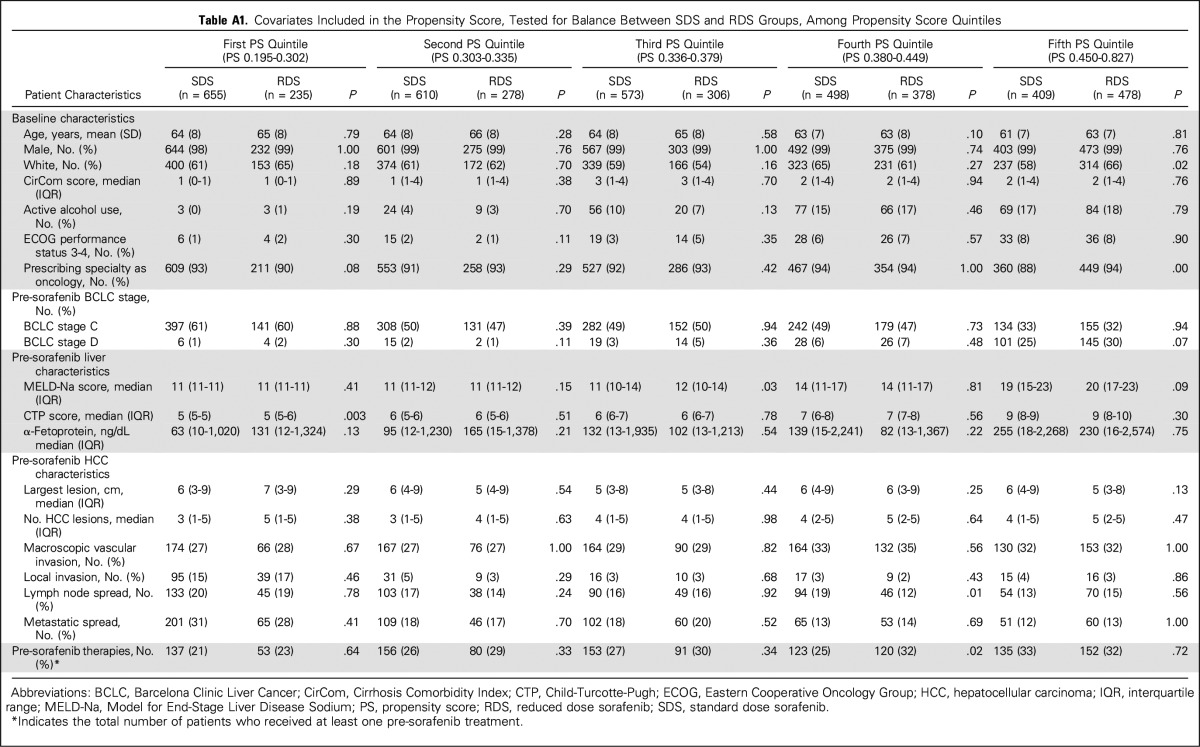
A propensity score was constructed to account for potential treatment bias. All covariates related to the exposure or treatment variable (P < .10) were included in a logistic regression model. These variables included CirCom score, MELD-Na score, CTP score, BCLC stage D, presence of active alcohol use, local invasion, metastatic spread, and pre-sorafenib radiofrequency ablation. Each RDS patient was matched to one SDS patient using a greedy-match algorithm20 that minimizes differences in propensity score. RDS patients were not matched if there were no available SDS patients with a < 10% difference in propensity score. During matching, every RDS patient was matched successfully to an SDS patient. To assess the adequacy of the constructed propensity score, covariate balance was tested within quintiles of the propensity score and was found to be well balanced (Appendix Table A1, online only). An HR was calculated subsequently using matched pairs, after stratification by pair number.
A matched multivariate logistic regression was also performed to account for potential confounders. Variables were included in the model if they produced a change-in-estimate in the HR of > 5%. After testing for change-in-estimates, only the CTP score and the MELD-Na score met this threshold.
We hypothesized that RDS would be noninferior to SDS after adjustment for confounding variables, with a non-inferiority hazard ratio (HRni) margin of 1.1. Our sample of 4,903 yielded 88% power to identify noninferiority if present, using a one-sided test with 2.5% type I error. We were able to identify 1,675 matched pairs in our propensity cohort, which provided a 77% power to detect noninferiority (HRni = 1.1) if time to event was uncorrelated within pairs, and an 82% power if times to event were slightly correlated within pairs (r = 0.075, reflecting our matched sample). A noninferiority boundary of HR = 1.1 corresponds to a difference of 3 weeks in median survival.
All analyzed variables were > 99% complete with the exceptions of ethnicity (missing 6%), comorbidities (missing 7%), ECOG performance status (missing 4%), BCLC stage (missing 4%), albumin (missing 3%), international normalized ratio (missing 4%), and α-fetoprotein (missing 6%). Missing measurements were treated as missing during subsequent analyses. OS tested with a noninferiority approach used a one-sided z test (P = .025) that was based on the log of the HR, against a null hypothesis that RDS is inferior to SDS, with an HR ≥ 1.1. All statistical analyses were performed using SAS 9.2/9.4 (SAS Institute, Cary, NC), PASS (NCSS, Kaysville, Utah), and STATA (StataCorp, College Station, Texas).
RESULTS
The median age of our cohort was 62 years (range, 26 to 93 years) and consisted of 98.9% men and 61.2% white patients. The majority of patients (58%) had CTP class A disease, 37% had class B, and 4% had class C. In our cohort, 59% of patients had a diagnosis of either active hepatitis B or C, 43% had BCLC stage A or B HCC, 46% had BCLC stage C, and 8% had BCLC stage D.
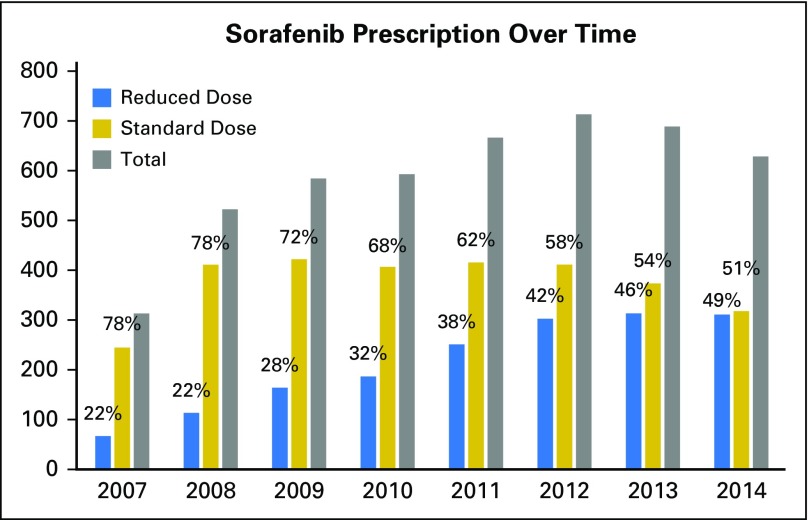
Of the 4,903 patients, 3,094 (63%) were prescribed SDS and 1,809 (37%) were prescribed RDS (Fig 1). Of VHA sorafenib prescribers, 93.0% were oncologists and 7.0% were gastroenterologists or hepatologists. There were temporal changes in prescribing behavior over the observation period, with full-dose initial prescriptions accounting for 78% of all new sorafenib prescriptions in 2007 but decreasing to 51% in 2014 (Appendix Fig A1, online only).
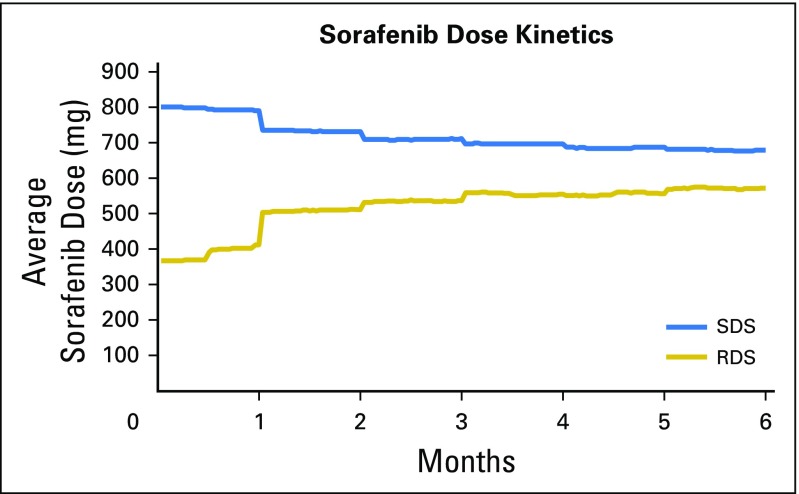
In comparing the average sorafenib dosage over time for the SDS and RDS groups, we observed a convergence of dosages (Appendix Fig A2, online only). The average sorafenib starting dosage for RDS patients was 367 mg/d. Overall, approximately 40% of RDS patients underwent dosage escalation within the first 2 months of starting sorafenib, whereas 60% did not. By the end of the first month, the average sorafenib dosage was 791 ± 62 mg/d for SDS and 412 ± 152 mg/d for RDS (P < .001). At 6 months, average dosages remained lower in RDS groups: 678 ± 200 mg/d for SDS patients and 573 ± 227 mg/d for RDS patients (P < .001).
Among SDS patients, 68 (2.2%) underwent dosage reduction within the first month, and 360 (11.6%) within the first 2 months. Among RDS patients, 211 (11.7%) underwent dosage escalation within the first month, and 539 (29.8%) within the first 2 months. At the end of 2 months, 31.7% of RDS and 33.7% of SDS patients had stopped sorafenib for any reason.
Patient Characteristics Associated With Receipt of RDS
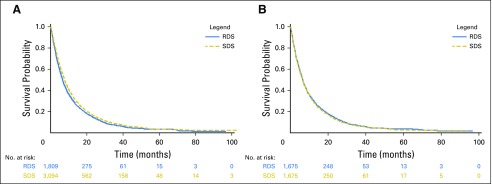
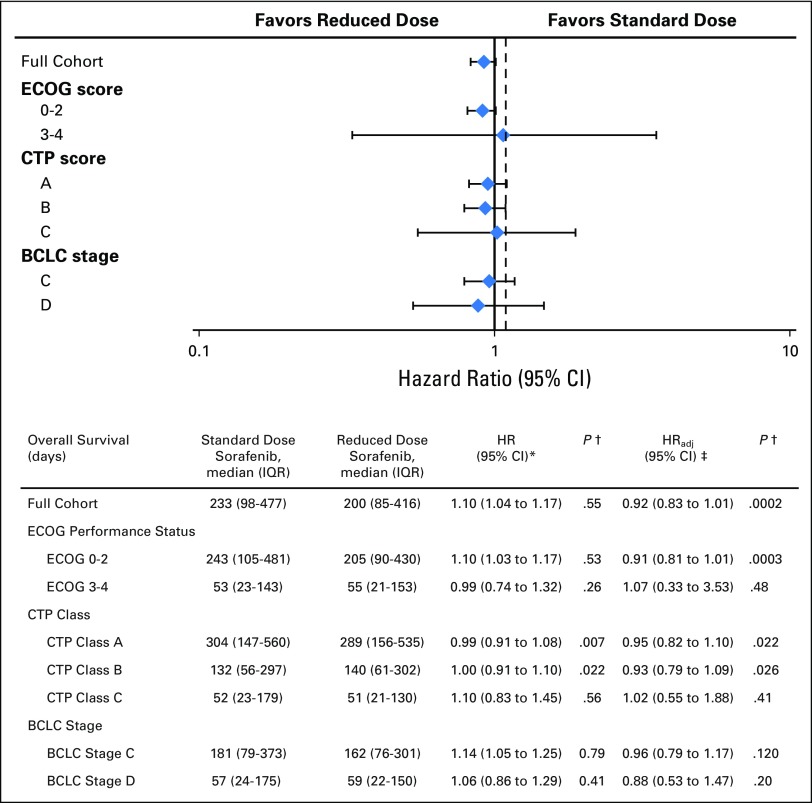
RDS patients were sicker at baseline, BCLC D stage was more common (P < .001), they had higher MELD-Na scores (P < .001), higher electronic CTP scores (P < .001), higher CirCom scores (P = .01), more frequent active alcohol abuse (P = .003), increased severity of ascites (P < .001), and more frequent hepatic encephalopathy (P < .001; Table 1). In addition, there was a trend toward an older age (P = .07) and poorer ECOG performance status (P = .07) in RDS patients. In unadjusted analyses, RDS patients had a reduced OS (median, 200 days) compared with SDS patients (233 days), with an HR of 1.10 (95% CI, 1.04 to 1.18; P = .002; Table 2; Fig 2). This result is also not significantly different from inferiority on the basis of the one-sided noninferiority test (Fig 3).
Table 1.
Baseline Demographics and Pre-Sorafenib Patient Characteristics (comparison between SDS and RDS groups)
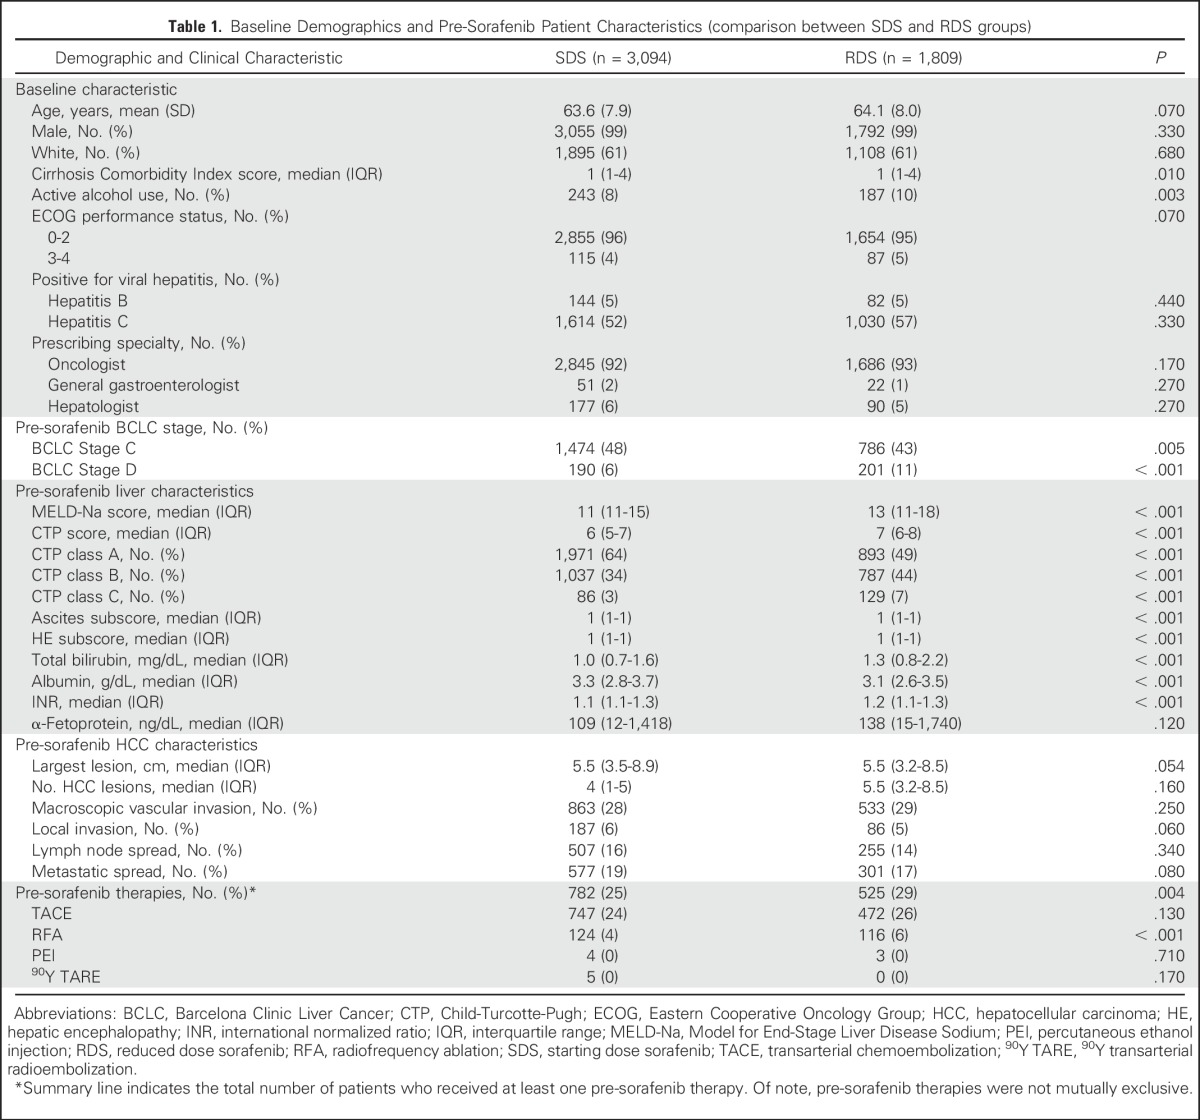
Table 2.
Summary of Outcomes (comparison between SDS and RDS groups)
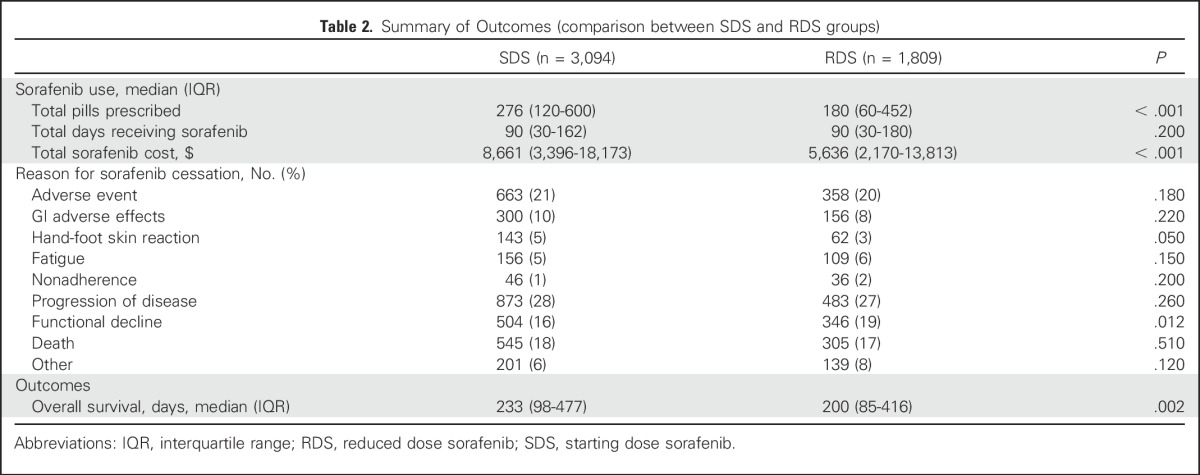
Fig 2.
Kaplan-Meier estimates of overall survival. (A) Comparison between reduced dose sorafenib (RDS) and standard dose sorafenib (SDS) patients, unmatched. (B) Comparison between RDS and SDS patients, propensity score matched.
Fig 3.
Overall survival of selected subgroups. (*) Hazard ratio calculated prior to propensity score matching and without adjustment. (†) P values here indicate comparison against non-inferiority bound of HR 1.1 (Pni). Figure above based on the adjusted hazard ratio. Dashed reference line indicates non-inferiority boundary at HR = 1.1. (‡) Hazard ratio calculated after propensity score matching and after adjustment for Child-Turcotte-Pugh and Model for End-Stage Liver Disease Sodium scores in a multivariate model. BCLC, Barcelona Clinic Liver Cancer; CTP, Child-Turcotte-Pugh; ECOG, Eastern Cooperative Oncology Group; HR, hazard ratio.
Cost Analysis
RDS patients received a similar number of days of sorafenib therapy (median, 90 days) compared to SDS patients (90 days; P = .20). However, because RDS patients received less sorafenib per day on average, they were prescribed fewer pills (median, 180 pills) than were SDS patients (median, 276 pills; P < .001). Consequently, total pill-related costs were also significantly lower for RDS patients (median, $5,636) than for SDS patients (median, $8,661; P < .001).
AEs
In an unmatched and unadjusted analysis, RDS patients and SDS patients had similar rates of discontinuing sorafenib because of an AE (20% v 21%; P = .18) and were equally likely to take sorafenib until disease progression (27% v 28%; P = .26). Among patients who discontinued sorafenib because of an AE, gastrointestinal toxicity was the most common reason for sorafenib cessation (456 patients), followed by fatigue (265 patients) and hand-foot skin reaction (205 patients). RDS patients were significantly less likely to discontinue sorafenib for a hand-foot skin reaction (5% v 3%; P = .05).
Matched Analyses
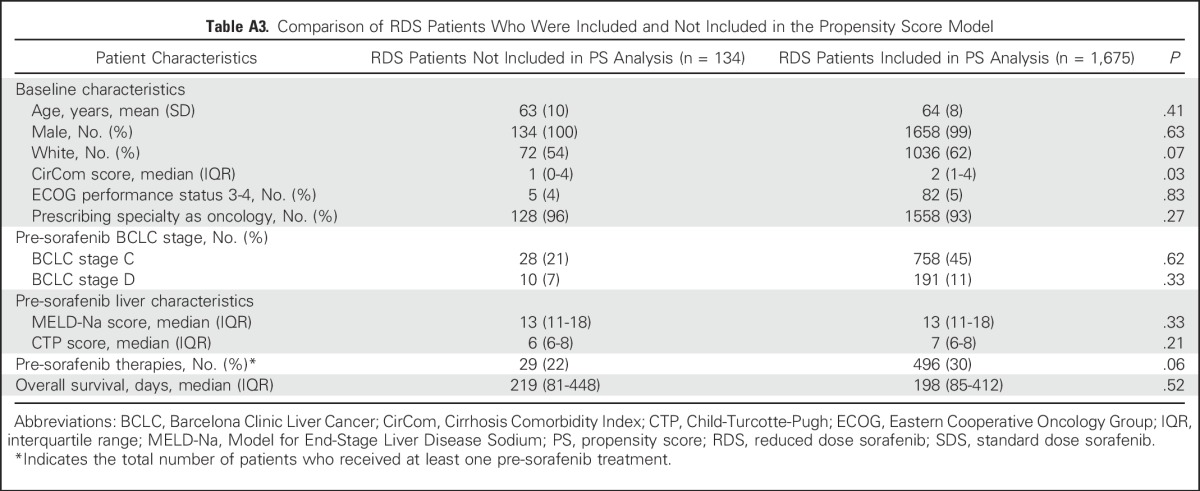
Because RDS patients were sicker at baseline, we conducted a matched analysis using propensity scores. The scores were generated on the basis of a generalized linear model of relevant clinical covariates influencing treatment assignment and outcomes, and then they were used to match SDS and RDS patients for assessment of outcomes, simulating a randomized controlled trial. Of the 1,809 RDS patients, 134 patients (7%) had at least one missing variable and therefore could not have a propensity score calculated. However, these patients were not substantially different from the 1,675 patients who were ultimately included in the final propensity score analysis (Appendix Table A2, online only). Ultimately, 1,675 RDS patients were matched to 1,675 SDS patients using this approach, with an excellent balance of relevant clinical covariates (Appendix Tables A1 and A3, online only).
After propensity matching, RDS patients seemed to be more similar to SDS patients, and the HR differed significantly from the noninferiority bound HR of 1.1 (HR, 0.96; 95% CI, 0.87 to 1.06; P value for non-inferiority [Pni] = .003). After additional adjustment for potential confounders in a multivariate model, the HR was still significantly different from the noninferiority bound (HRadj, 0.92; 95% CI, 0.83 to 1.01; Pni < .001; Fig 3).
After matching, there was a trend toward fewer patients discontinuing sorafenib because of an AE among RDS patients (19.6%) compared with SDS patients (22.4%; P = .056). RDS patients were significantly less likely to discontinue sorafenib because of GI AEs (8.7% v 10.8%; P = .047). However, there were no statistically significant differences between RDS and SDS patients in terms of discontinuing drug for other reasons (Table 3).
Table 3.
Reasons for Sorafenib Cessation After Propensity Score Matching
Subgroup Analysis
We found no significant OS difference among our preplanned subgroups (Fig 3). After propensity score matching and adjusting for confounders, there was no OS disadvantage to the RDS strategy among patients with good ECOG performance status 0 to 2 (HRadj, 0.91; 95% CI, 0.81 to 1.01; Pni < .001), but we could not reject inferiority for those with poor ECOG performance status 3 to 4 (HRadj, 1.07; 95% CI, 0.33 to 3.53; Pni = .48). When studying the effect of RDS across different severities of liver dysfunction, there were also no differences in OS among patients with CTP class A (HRadj, 0.95; 95% CI, 0.82 to 1.10; Pni = .022) or CTP class B (HRadj, 0.93; 95% CI, 0.79 to 1.09; Pni = .026). We could not reject inferiority for CTP class C (HRadj, 1.02; 95% CI, 0.55 to 1.88; Pni = .41). Similarly, although there seemed to be no differences in OS, we could not reject inferiority among patients with BCLC stage C (HRadj, 0.96; 95% CI, 0.79 to 1.17; Pni = .12) or stage D (HRadj, 0.88; 95% CI, 0.53 to 1.47; Pni = .20).
DISCUSSION
Prior small retrospective studies have suggested that using a sorafenib dosage escalation strategy might be beneficial, or at least not harmful, to patients with HCC.10-12 Using a large-scale national VHA database, we performed univariate and propensity score analyses on 4,903 patients with HCC who had been prescribed sorafenib therapy either in a traditional dosing pattern or at a reduced starting dose.
RDS patients were sicker at baseline and had decreased OS compared with SDS patients (HR, 1.10; 95% CI, 1.04 to 1.18). After propensity score matching to adjust for potential confounders, RDS and SDS patients were more similar in terms of OS (HRadj, 0.92; 95% CI, 0.83 to 1.01), and RDS was significantly noninferior to SDS (Pni < .001). Ultimately, we did not find evidence that starting patients with HCC on RDS led to a significant difference in OS, and the 95% CI included an HR of 1.0 across all examined subgroups.
After propensity score matching, RDS patients were less likely to discontinue sorafenib because of gastrointestinal toxicity, and there were trends toward a decreased risk of discontinuing the drug for any AE. This result is consistent with the findings of prior data.11 RDS patients also experienced significantly reduced total cost of treatment because of the fewer number of pills consumed per patient per day.
Our study has several strengths, including the large size of our nationally based cohort, which allowed us to power our study for survival and to adequately evaluate several secondary outcomes. Second, these data from 128 VHA centers afford us high external validity. Third, because these patients were not treated in a trial setting, they more accurately reflect the population of patients with HCC that exists in the United States. Finally, we were able to obtain highly accurate and complete sorafenib prescription and cost information because most VA patients either receive their prescription directly from a VA pharmacy or have the drug paid for by the VA system.
As with any observational study, there is the risk of unmeasured confounding variables. Indeed, the validity of propensity score models relies on the assumption that all potential confounders have been measured.21 Second, VHA patients may not be entirely representative of the population affected by HCC. However, baseline characteristics other than sex are relatively similar in our cohort compared with previous studies, including the phase IV GIDEON study and the SHARP trial.6,8
This retrospective analysis of nearly 5,000 patients with HCC who were prescribed sorafenib suggests that starting patients on a reduced starting dose does not reduce OS after propensity score matching for multiple clinical variables. RDS patients experienced decreased treatment cost and a trend toward a decreased incidence of discontinuing sorafenib because of AEs. The observed practice patterns suggest that this strategy is becoming more common, although most physicians still start at full dosage therapy. Our data suggest that the initiation of sorafenib at a reduced dosage may be a safe and reasonable strategy for some patients with HCC.
Appendix
Fig A1.
Percentages indicate number of patients receiving reduced starting dose sorafenib (RDS) and standard starting dose sorafenib (SDS) for each year.
Fig A2.
Changes in average daily sorafenib dose over time.
Table A1.
Covariates Included in the Propensity Score, Tested for Balance Between SDS and RDS Groups, Among Propensity Score Quintiles
Table A2.
Propensity Score Distributions in Our Cohort, Before and After Propensity Score Matching
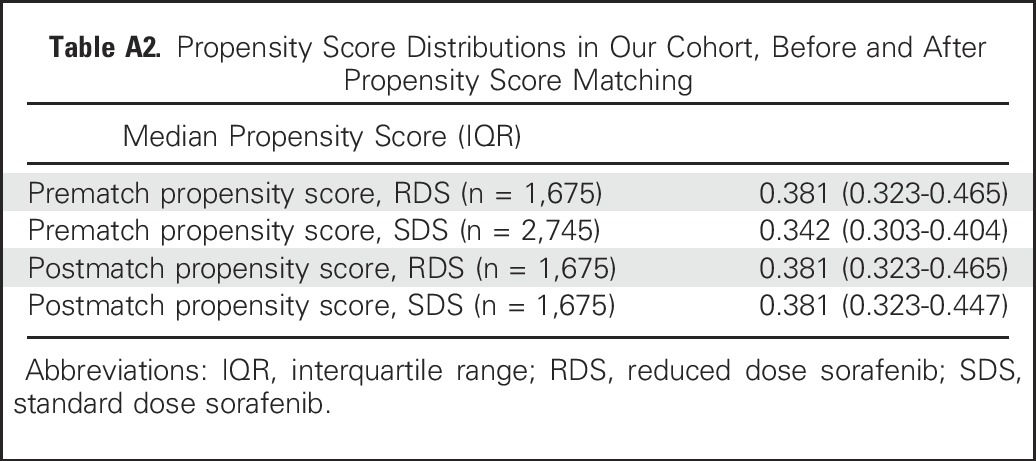
Table A3.
Comparison of RDS Patients Who Were Included and Not Included in the Propensity Score Model
Footnotes
Supported by unrestricted research funds from Bayer HealthCare Pharmaceuticals and the VA HIV, Hepatitis and Related Conditions Programs in the Office of Specialty Care Services. Dr. Ronac Mamtani is supported by the National Institutes of Health (NIH)/National Cancer Institute (NCI) grant K23CA187185.
Presented in poster format at the Gastrointestinal American Society of Clinical Oncology Symposium, January 2017.
AUTHOR CONTRIBUTIONS
Conception and design: Kim A. Reiss, Shun Yu, Tamar H. Taddei, David E. Kaplan
Financial support: David E. Kaplan
Administrative support: Rajni Mehta, Kathryn D'Addeo
Provision of study materials or patients: David E. Kaplan
Collection and assembly of data: Shun Yu, Rajni Mehta, Kathryn D'Addeo, Tamar H. Taddei, David E. Kaplan
Data analysis and interpretation: Kim A. Reiss, Shun Yu, Ronac Mamtani, E. Paul Wileyto, Tamar H. Taddei, David E. Kaplan
Manuscript writing: All authors
Final approval of manuscript: All authors
Accountable for all aspects of the work: All authors
AUTHORS' DISCLOSURES OF POTENTIAL CONFLICTS OF INTEREST
Starting Dose of Sorafenib for the Treatment of Hepatocellular Carcinoma: A Retrospective, Multi-Institutional Study
The following represents disclosure information provided by authors of this manuscript. All relationships are considered compensated. Relationships are self-held unless noted. I = Immediate Family Member, Inst = My Institution. Relationships may not relate to the subject matter of this manuscript. For more information about ASCO's conflict of interest policy, please refer to www.asco.org/rwc or ascopubs.org/jco/site/ifc.
Kim A. Reiss
No relationship to disclose
Shun Yu
No relationship to disclose
Ronac Mamtani
No relationship to disclose
Rajni Mehta
Research Funding: Bayer AG (Inst)
Kathryn D'Addeo
Research Funding: Bayer AG (Inst)
E. Paul Wileyto
No relationship to disclose
Tamar H. Taddei
Consulting or Advisory Role: Bayer HealthCare Pharmaceuticals
Research Funding: Bayer HealthCare Pharmaceuticals (Inst)
David E. Kaplan
Consulting or Advisory Role: Bayer HealthCare Pharmaceuticals
Research Funding: Bayer HealthCare Pharmaceuticals (Inst), Inovio Biomedical (Inst)
REFERENCES
- 1.El-Serag HB, Mason AC: Rising incidence of hepatocellular carcinoma in the United States. N Engl J Med 340:745-750, 1999 [DOI] [PubMed] [Google Scholar]
- 2.Kaczynski J, Odén A: The rising incidence of hepatocellular carcinoma. N Engl J Med 341:451, author reply 452, 1999 [DOI] [PubMed] [Google Scholar]
- 3.Torre LA, Bray F, Siegel RL, et al. : Global cancer statistics, 2012. CA Cancer J Clin 65:87-108, 2015 [DOI] [PubMed] [Google Scholar]
- 4.Forner A, Llovet JM, Bruix J: Hepatocellular carcinoma. Lancet 379:1245-1255, 2012 [DOI] [PubMed] [Google Scholar]
- 5.Bruix J, Sherman M, American Association for the Study of Liver Diseases : Management of hepatocellular carcinoma: an update. Hepatology 53:1020-1022, 2011 [DOI] [PMC free article] [PubMed] [Google Scholar]
- 6.Llovet JM, Ricci S, Mazzaferro V, et al. : Sorafenib in advanced hepatocellular carcinoma. N Engl J Med 359:378-390, 2008 [DOI] [PubMed] [Google Scholar]
- 7.Cheng AL, Kang YK, Chen Z, et al. : Efficacy and safety of sorafenib in patients in the Asia-Pacific region with advanced hepatocellular carcinoma: A phase III randomised, double-blind, placebo-controlled trial. Lancet Oncol 10:25-34, 2009 [DOI] [PubMed] [Google Scholar]
- 8.Lencioni R, Kudo M, Ye SL, et al. : GIDEON (Global Investigation of therapeutic DEcisions in hepatocellular carcinoma and Of its treatment with sorafeNib): Second interim analysis. Int J Clin Pract 68:609-617, 2014 [DOI] [PMC free article] [PubMed] [Google Scholar]
- 9.Strumberg D, Richly H, Hilger RA, et al. : Phase I clinical and pharmacokinetic study of the Novel Raf kinase and vascular endothelial growth factor receptor inhibitor BAY 43-9006 in patients with advanced refractory solid tumors. J Clin Oncol 23:965-972, 2005 [DOI] [PubMed] [Google Scholar]
- 10. Reference deleted.
- 11.Kim JE, Ryoo BY, Ryu MH, et al. : Sorafenib dose escalation in the treatment of advanced hepatocellular carcinoma. Oncology 82:119-125, 2012 [DOI] [PubMed] [Google Scholar]
- 12.https://clinicaltrials/gov/ct2/show/NCT01203787 Cabrera R: Sorafenib Dose Ramp-Up in Hepatocellular Carcinoma (HCC)
- 13.Goldberg DS, Lewis JD, Halpern SD, et al. : Validation of a coding algorithm to identify patients with hepatocellular carcinoma in an administrative database. Pharmacoepidemiol Drug Saf 22:103-107, 2013 [DOI] [PMC free article] [PubMed] [Google Scholar]
- 14.Bush K, Kivlahan DR, McDonell MB, et al. : The AUDIT alcohol consumption questions (AUDIT-C): An effective brief screening test for problem drinking. Ambulatory Care Quality Improvement Project (ACQUIP). Alcohol Use Disorders Identification Test. Arch Intern Med 158:1789-1795, 1998 [DOI] [PubMed] [Google Scholar]
- 15. Jepsen P, Vilstrup H, Lash TL: Development and validation of a comorbidity scoring system for patients with cirrhosis. Gastroenterology 146:147-56, 2014. [DOI] [PubMed]
- 16.Kim WR, Biggins SW, Kremers WK, et al. : Hyponatremia and mortality among patients on the liver-transplant waiting list. N Engl J Med 359:1018-1026, 2008 [DOI] [PMC free article] [PubMed] [Google Scholar]
- 17. Kaplan DE, Dai F, Aytaman A, et al: Development and performance of an algorithm to estimate the Child-Turcotte-Pugh score from a national electronic healthcare database. Clin Gastroenterol Hepatol 13:2333-2341.e1-6, 2015. [DOI] [PMC free article] [PubMed]
- 18.Llovet JM, Brú C, Bruix J: Prognosis of hepatocellular carcinoma: The BCLC staging classification. Semin Liver Dis 19:329-338, 1999 [DOI] [PubMed] [Google Scholar]
- 19.Sohn MW, Arnold N, Maynard C, et al. : Accuracy and completeness of mortality data in the Department of Veterans Affairs. Popul Health Metr 4:2, 2006 [DOI] [PMC free article] [PubMed] [Google Scholar]
- 20.Rosenbaum P. Observational Studies. New York, Springer-Verlag 2002. doi:10.1007/978-1-4757-3692-2 [Google Scholar]
- 21.Brookhart MA, Wyss R, Layton JB, et al. : Propensity score methods for confounding control in nonexperimental research. Circ Cardiovasc Qual Outcomes 6:604-611, 2013 [DOI] [PMC free article] [PubMed] [Google Scholar]


