Abstract
There is a growing realization, especially within the diagnostic and therapeutic community, that the amount of information enclosed in a single molecule can not only enable a better understanding of biophysical pathways, but also offer exceptional value for early stage biomarker detection of disease onset. To this end, numerous single molecule strategies have been proposed, and in terms of label-free routes, nanopore sensing has emerged as one of the most promising methods. However, being able to finely control molecular transport in terms of transport rate, resolution, and signal-to-noise ratio (SNR) is essential to take full advantage of the technology benefits. Here we propose a novel solution to these challenges based on a method that allows biomolecules to be individually confined into a zeptoliter nanoscale droplet bridging two adjacent nanopores (nanobridge) with a 20 nm separation. Molecules that undergo confinement in the nanobridge are slowed down by up to 3 orders of magnitude compared to conventional nanopores. This leads to a dramatic improvement in the SNR, resolution, sensitivity, and limit of detection. The strategy implemented is universal and as highlighted in this manuscript can be used for the detection of dsDNA, RNA, ssDNA, and proteins.
Keywords: Single molecule zeptoliter confinement, DNA recoiling dynamics, dual nanopore, nanoscale droplet, SNR enhancement, DNA profiling
Rapid advances in label-free single molecule sensing strategies are transforming the way biological systems are studied, especially with a view on developing novel diagnostic and therapeutic strategies. The remarkable spatial and temporal resolution offered by these techniques, along with their increasing availability, have dramatically improved the ability of researchers to detect and manipulate single molecules such as nucleic acids and proteins, enabling the investigation of their physicochemical, mechanical, and biological characteristics in a wider range of time/length scales and complexity than previously thought possible.1 Over the past decade, nanopore sensors have been gaining prominence for detection1−3 and even delivery of analytes,4 in part due to their inherently simple operating principle which is based on recording the changes in the ionic current through a nanoscale pore that is separated by two electrolyte-filled reservoirs. Nanopores have been successfully used for a wide range of sensing applications (e.g., for nucleic acid sequencing5), the current state-of-the-art of both biological and solid-state nanopore technology faces significant challenges due to the limited control over molecular transport6 and inability to confine and study individual molecules over longer time scales.
For example, small nucleic acid fragments (e.g., cell-free DNA and microRNA) are often challenging to detect due to their fast translocation times with rates being as high as 50 000 nucleotides per ms,7 resulting in a poor signal-to-noise ratio (SNR), and limited resolution. Proteins are even more challenging to detect, due to their heterogeneous charge and fast diffusion rates resulting in only a small fraction of the total population being detected. For example, it has been estimated that, for a sub-100 kDa protein, only the slowest 0.1% fraction of the proteins transported through the nanopore are usually observed.8,9 Therefore, nanopore experiments are normally carried out at analyte concentration several orders of magnitude higher than the clinically relevant range.10
Much effort has been placed towards finding solutions to circumvent these limitations including using high bandwidth amplifiers,11−13 or alternatively and perhaps more challenging, controlling and tuning transport of analytes across the pore. Apart from the straightforward method of lowering the voltage applied which slows molecules down but at the not negligible cost of lowered SNR and capture rate, traditional approaches have included but are not limited to (i) increasing solution viscosity14,15 and making use of different electrolyte solutions,16 (ii) modifying nanopore shape, geometry, and composition,17−21 (iii) applying pressure gradients to counterbalance electrophoretic forces,22 and (iv) making use of mechanical forces.23−26 A method capable of slowing and controlling the transport without affecting the SNR, capture rate, detection efficiency, and detection limit that can be used equally well for nucleic acids and proteins is as of yet unresolved.
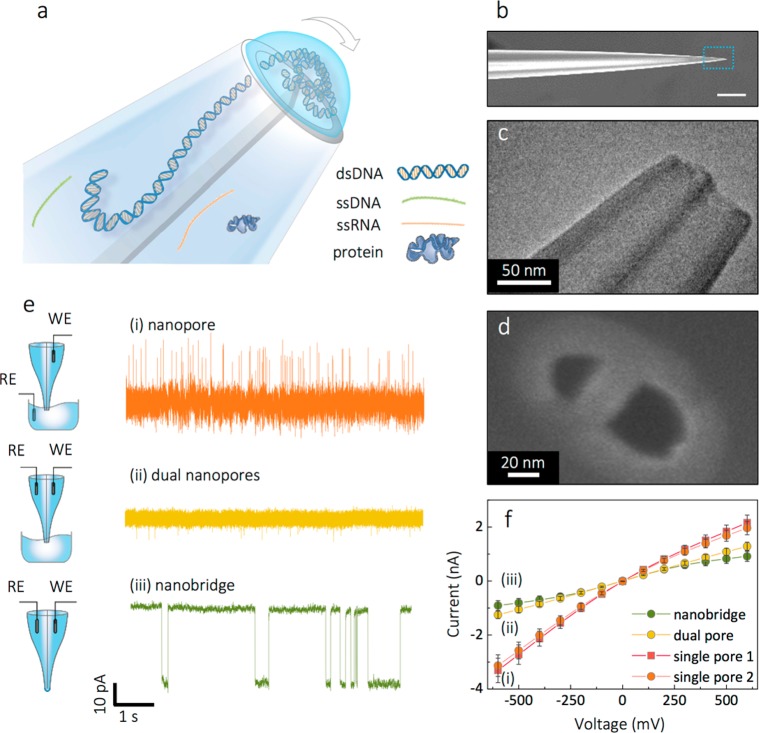
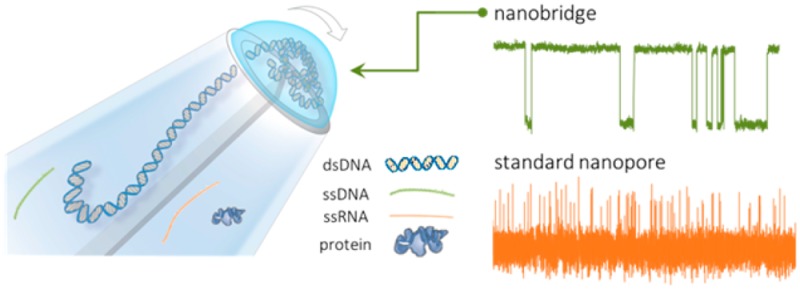
Herein, we demonstrate a simple to fabricate and operate, yet powerful detection platform that addresses many of the above challenges and allows for the controllable confinement of individual molecules in a zeptoliter nanobridge formed across two nanopores separated by a 20 nm gap at the tip of a nanopipette, as in Figure 1. The droplet or bridge formation is very similar to what has been initially documented by Rodolfa et al.27,28 albeit on a much smaller scale, allowing for the confinement of one molecule at a time. Upon application of a bias between the two nanopores, the analyte is transported from one nanopore to the other via the nanobridge. Due to molecular confinement, we show that it is possible to slow down transport by up to 3 orders of magnitude and detect small molecules without using any complex fabrication strategies or modifying the analyte or electrolyte composition. This considerable slowdown enables the detection of species which would otherwise go undetected in a conventional nanopore platform. It is possible to perform fragment sizing based on current amplitudes alone, which we show enhances the detection resolution and does not require further data processing. To demonstrate the generality of our approach, enhanced temporal resolution was achieved for a broad range of analyte such as dsDNA, ssDNA, RNA, and small proteins such as monomeric α-synuclein.
Figure 1.
Experimental setup and characterization of nanobridge configuration. (a) Schematic representation of the nanobridge formed at the tip of a nanopipette. (b) SEM of the dual barrel nanopipette visualized laterally, scale bar 10 μm. (c) TEM and (d) SEM micrographs of the tip of the nanopipette displayed an ellipsoidal profile with representative dimensions of the major and minor axes being approximately x = 21 ± 2 nm and y = 48 ± 2 nm in radius. (e) Ionic current recordings of 5 kbp DNA translocations in 100 mM KCl buffered in TE at 350 mV voltage applied, performed in different double barrel nanopipette configuration as illustrated in the schematic: (i) conventional nanopore configuration, (ii) dual nanopore configuration without a nanobridge, (iii) nanobridge configuration. Traces have been refiltered and resampled for visualization purposes. (f) Current–voltage plots of dual barrel nanopipttes measured in the three different configurations at 100 mM KCl.
The fabrication of the dual nanopore platform was implemented via pipet pulling of dual-barrel quartz capillaries (see methods for fabrication parameters), resulting in the reproducible formation of two adjacent pores, each 20–30 nm in diameter, as measured by TEM and SEM, Figure 1a–c, Supporting Information (SI) S1. Each pipet barrel was filled with an electrolytic solution which resulted in the formation of a nanoscale bridge between the two nanopores held in place by surface tension. Ag/AgCl electrodes (patch and ground) were inserted into each barrel with the bridge between the nanopores being the only connection point.
To characterize the formed nanobridge, current–voltage measurements were performed on the same device in three distinct configurations at 100 mM KCl and pH 8.0: (i) in a conventional nanopore configuration, where the ground electrode is placed in the bath and the patch electrode is in one of the barrels, (ii) in dual nanopore configuration without a nanobridge, where the ground and the patch electrodes are placed in different barrels and the nanopipette tip is immersed in a bath with the same electrolyte, and (iii) in a nanobridge configuration, where the ground and the patch electrodes are placed in different barrels and the nanopipette tip is in air. A comparison of exemplar current–time traces is shown for 5 kbp DNA for the three configurations and highlights the slowing of DNA transport, as in Figure 1e. The conductance, Figure 1f, as calculated from the linear region (±100 mV) of the IV curves measured for each nanopore in configuration (i) was G1 = 4.75 ± 0.52 nS (barrel 1) and G2 = 4.45 ± 0.43 nS (barrel 2). This mode of operation showed negative rectification (|I–600mv/I+600mv| = 1.56 ± 0.08) which is consistent with negatively charged glass nanopores previously reported,29,30 as the negatively charged surface of the quartz nanopore leads to increased Cl– ion selectivity.31 In configuration (ii) the IV curves were predominantly linear up to ±600 mV and conductance approximately halved to 2.20 ± 0.22 nS. This is expected due to the increase in total resistance because of the introduction of second nanopore in the electrical circuit and closely matches the total conductance of the two nanopores in series (1/GTOT = 1/G1 + 1/G2), GTOT = 2.30 nS. In this configuration, the loss of rectification at negative voltages was attributed to enhanced Cl– selectivity originating from both nanopores, effectively canceling out the rectification.
Interestingly, the nanobridge configuration exhibited a quasi-sigmoidal behavior with a conductance of 2.04 ± 0.13 nS. The sigmoidal behavior at higher voltages is likely due to the electric field inducing localized changes in surface tension. These results indicated that the nanobridge resistance accounted for up to 11% of the total conductance, while the remaining is almost equally split between the nanopores in each barrel. A simple model with the nanobridge connected as a third resistor in series to the two nanopores indicates that the resistance associated with the nanobrigde is ∼55 MΩ compared to the total nanobridge/nanopore resistance of ∼490 MΩ. This indicates that ∼11% of the total voltage bias drops in the nanobridge. At the same time, the conductance dependence on electrolyte concentration (5–400 mM KCl at pH 8.0) followed a linear trend similar to what is typically observed in a conventional configuration (i) suggesting that salt concentration has a negligible effect on droplet formation and shape (SI S2).
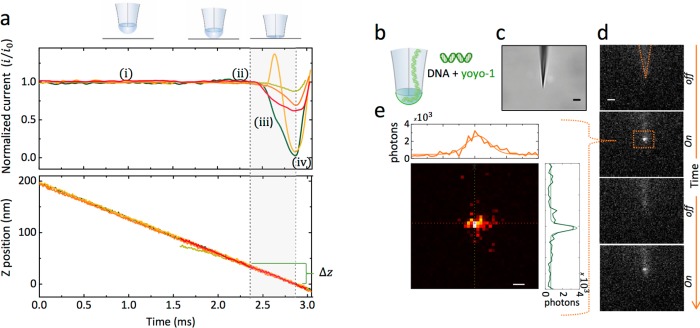
An estimation of the nanobridge dimensions is critical in understanding the molecular confinement. From TEM and SEM (Figure 1) the dimensions of the nanopores and their separation can be determined; however, to estimate the height of the nanobridge, alternative strategies are needed. A series of approach experiments were performed using scanning electrochemical cell microscopy (SECCM) with full feedback control, which allowed us to measure the height of the fluidic nanobridge.32 The ionic current across the bridge was used as a feedback signal to detect contact between the formed droplet meniscus and a silanized glass substrate during the approach (Figure 2a). A stable ionic current (I0) was observed until the droplet meniscus first made contact with the surface. As the nanopipette moved closer to the surface, the ionic current decreased rapidly until the tip of the nanopipette came into near physical contact with the substrate. The measured decrease in ionic current is generally attributed to the hindered flow of ionic species across the nanobridge, which in our case was directly dependent on distance and proximity to the surface.33,34 As the ionic current cannot be completely blocked, to precisely define the surface contact point, the pipet approach was continued even after the lowest ion current (full surface contact) was observed, until it crashes into the glass substrate, breaking the tip and increasing its diameter and hence the ionic current at which point the approach was halted. Averaging over multiple approaches, the droplet height (Δz), defined as the difference between initial and full surface contact, was measured to be 30 ± 5 nm. Assuming a semiellipsoidal nanobridge, the radius of the major and minor axes can be approximated as x = 21 ± 2 nm and y = 48 ± 2 nm, as measured by SEM and TEM. This corresponds to an average nanobridge volume of 63 ± 19 zL, which is a highly confined space, orders of magnitude smaller than what is typically used for single molecule fluorescence microscopy. To confirm molecular confinement and transport from one barrel to the other through the nanobridge, translocations were imaged optically using 10 kbp DNA fluorescently labeled with YOYO-1 (Figure 2b–e, SI S3). Under an applied bias, translocations could be visualized optically as a blinking highly confined ellipsoidal spot at the tip of a nanopipette using an emCCD camera. Importantly no accumulation of DNA at the tip was observed, confirming that DNA translocates from one barrel to the other via the nanobridge. It should be noted that the measurement was diffraction limited; therefore, the signal (e.g., along one axis corresponds to 2 pixels = 534 nm) arises from a significantly smaller droplet volume.
Figure 2.
Electrolyte nanobridge characterization. (a) The height of the nanobridge at the tip of the nanopipette was measured by using a scanning electrochemical cell microscopy (SECCM) with ionic current feedback. Both nanopipette barrels were filled with 100 mM KCl buffered with 10 mM Tris, 1 mM EDTA, at pH 8.0. The nanopipette was mounted on a piezo stage perpendicular to a silanized glass surface. The ionic current (top panel) was recorded along with the Z-position (bottom panel) of the piezo stage. During approach the current remains unchanged (i) and decreases when contact is made between the nanobridge and glass substrate (ii). The tip is lowered further (iii) until it crashes into the glass substrate, breaking the tip and increasing its diameter and hence the ionic current (iv). The current in all cases cannot be completely shut off due to surface conductivity and surface contact. The nanobridge height (Δz), defined as the difference between the initial nanobridge to surface contact (i) and tip to surface contact (iv), was measured to be 30 ± 5 nm. (b) Schematic of optical fluorescence detection used to confirm molecular confinement and DNA transport via the electrolyte nanobridge. 10 kbp DNA stained with YOYO-1 was used in 100 mM KCl solution buffered with 10 mM Tris, 1 mM EDTA, at pH 8.0. (c) Bright field of the nanopipette (scale bar shows 5 μm). (d) Fluorescence images recorded with an emCCD camera (100 ms exposure time) showing that upon the application of a bias (300 mV), a fluorescent spot, owing to DNA translocation, was detected at the tip of the nanopipette (scale bar shows 5 μm). (e) A close-up of a representative DNA optical translocation showing the fluorescent profile along x–y axis. Measurements were diffraction limited; therefore, despite the DNA being confined, the fluorescence appeared to be larger than the dimensions of the nanobridge (scale bar shows 1 μm).
In spite of its size, the nanobridge exhibited very high stability with the baseline current remaining stable for over an hour (1.12 pA rms at 200 mV voltage applied at 100 mM KCl) indicating no observable change in droplet dimensions due to evaporation, SI S4. Importantly, the nanobridge devices demonstrated nearly identical IV characteristics in air and when immersed in fluorinated oil (FC-70), again indicating that evaporation played no role in the device functionality, SI S5. To evaluate the role molecular confinement played in the detection process, experiments were performed in nanobridge and conventional nanopore configurations using dsDNA of different lengths. Recently, Pud et al.35 have presented a planar dual nanopore configuration where the ends of the same DNA molecule were threaded in two different pores resulting in a mechanical trapping; however, their architecture did not allow for an efficient molecular confinement, leading to a trapping efficiency of less than 1%. Although dual nanopore systems with internal cavities have been previously used as nanoreactors to measure chemical reactions,36 the electrophoretic time-of-flight of DNA molecules,37 and escape times from an entropic barrier,38 the operation of these platforms overlaps with the dual nanopore configuration without a nanobridge (ii) shown in Figure 1. In contrast, the nanobridge operates in a different regime: where the radius of the confining volume, Rconfine, is significantly smaller than Rg, the radius of gyration of the particle to be confined.
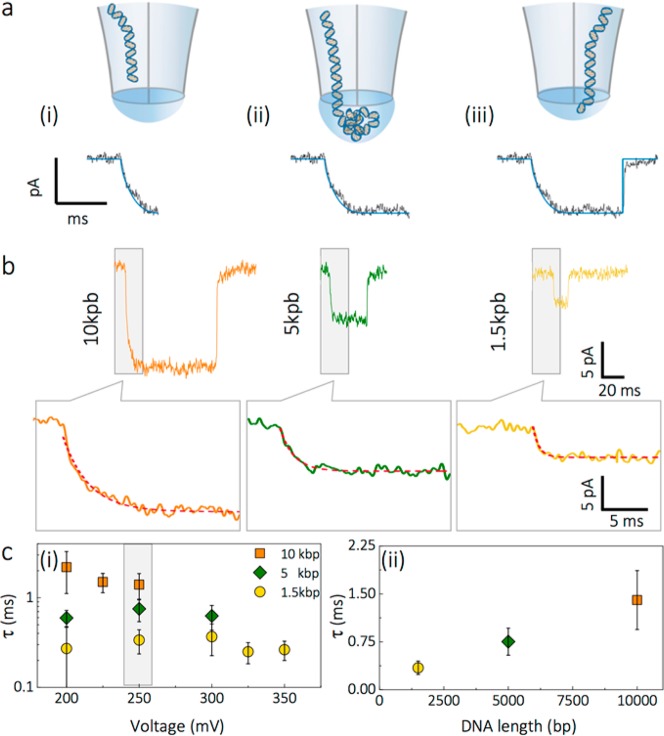
In our platform, DNA was threaded inside the nanobridge Figure 3a (i), resulting in volumetric expansion until the surface energy of the bridge matches the energy of DNA confinement. Much like the open nanopore current, DNA translocations were equally stable over similar time scales, SI S6. A closer look at the onset of individual translocation events revealed a monoexponential decay with time constant, τ, upon delivery of DNA from the initial nanopore into the nanobridge (Figure 3b), which is attributed to the increased entropic barrier. The decay was linearly dependent on DNA fragment size, e.g. 0.34 ± 0.10 ms for 1.5 kbp increasing to 1.69 ± 0.39 ms for 10 kbp DNA. τ was significantly larger than the amplifier rise/fall time (35 μs at 10 kHz cutoff frequency), not dependent on the event duration, and only minimally dependent on the applied voltage (Figure 3c). In comparison, threading in a conventional nanopore configuration results in sharp current transitions, which are commonly attributed to DNA molecule entering the nanopore, SI S7. The increasing τ corresponds well with DNA size and the increase in total volume of the nanobridge due to expansion generated by insertion of DNA. For example, the radius of gyration using a worm-like chain model with modified Kuhn length (96 nm) taking into account 100 mM KCl is 90 nm for 1.5 kbp and 233 nm for 10 kbp.39 At the same time decay constants are only marginally slower than the Zimm relaxation times37 and much slower than the total translocation times observed in nanobridge configuration implying that the DNA fully recoils into the nanobridge prior to translocating into the receiving nanopore, Figure 3a (ii). This is consistent with the optical data whereby a transient fluorescent spot is localized at the tip.
Figure 3.
DNA threading model in nanobridge configuration. (a) Schematic of the threading process: (i) The dsDNA molecule is threaded inside the nanobridge leading to its expansion. The threading process results in the ionic current exhibiting a monoexponential decay with time constant τ. (ii) The DNA recoils inside the bridge until the surface energy of the bridge matches the energy of the DNA confinement. As the DNA in the droplet is predominately governed by Brownian motion, the duration of the blockade is governed by the time it takes the DNA to rearrange and become inserted and finally (iii) threads into the second barrel. (b) Examples of 10, 5, and 1.5 kbp DNA translocation events recorded in nanobridge configuration in 100 mM KCl. The onset of each translocation event was fit with a monoexponential decay function. (c) Dependence of threading time τ on voltage applied (left panel) for 10, 5, and 1.5 kbp DNA. Threading time dependence on DNA length for events recorded at 250 mV (right panel).
Under this model, the recoiled DNA acts to restrict ion flow between both barrels resulting in a current blockade. This is different to the conventional configuration in nanopores, where DNA molecules crossing the diffuse electrical double layer results in current enhancement as previously reported in the literature;4 see Figure 1e. As will be seen later, the current blockade in the nanobridge configuration correlates with DNA size. Under the same translocation model, due to the separation between both nanopores, a molecule confined in the nanobridge would experience a weaker electric field. As only a small fraction of the total voltage bias drops in the nanobridge, the effect of the electric field on the DNA is negligible, and once inside the nanobridge, diffusion will be dominant. Considering the DNA requires sufficient time to sample all available configurations40 within this restricted space to enter the second barrel, it is expected that this would also lead to a longer and broader dwell time due to the stochastic nature of the process and the random orientation of the molecule in the nanobridge, as in Figure 3a (iii). The diffusion time to find a configuration that will allow for the molecule to leave the pore (for instance, an end of the DNA entering the second nanopore) seems to be much slower than what is expected for normal nanopore diffusion. A possible explanation for this would be the difference in electric field strength between the nanopores and the bridge, as well as the fact that the molecule now has to diffuse laterally across the bridge, where the available space for diffusion is limited by the elastic energy required to expand out the bubble forming the nanoscale bridge. The DNA molecule may be forced into a tight coil by the electric field in the nanopore and resisting elastic forces in the nanobridge. There may also be tangling of the molecule through diffusion, due to recoils with the bubble and nanopore walls, before the DNA completely enters the bridge. Such molecular crowding, as well as tangling, through compactification may significantly slow down the diffusion process to find a suitable configuration with which to leave the nanopore. Indeed, diffusing molecular segments may be hindered by an increased density of other segments in the way, within such a compact state, enhancing the self-avoiding aspect of the diffusion.
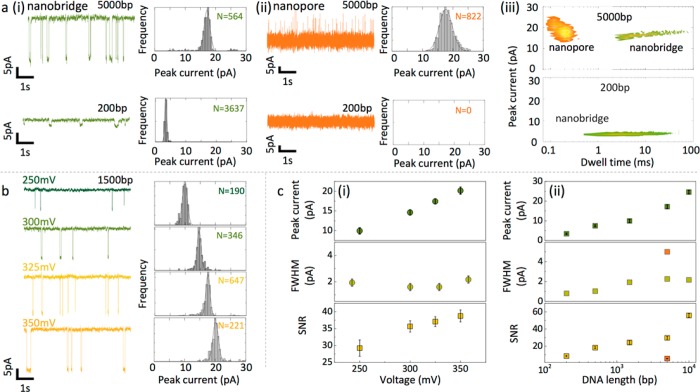
A direct comparison of experimental nanopore data obtained in nanobridge and conventional configurations, for the same device revealed several key nanobridge advantages. First, an improved temporal resolution due to confinement, leading to slowdown up to 3 orders of magnitude, was observed; see Figure 4a. For instance, the detection of 5 kbp DNA using a conventional nanopore configuration and dual nanopore in bath gave mean dwell times of 0.13 ± 0.03 ms and 0.19 ± 0.08 ms, respectively (SI S8, S9), which is comparable with what has been reported in literature.4 Using the same nanopipette in a nanobridge configuration resulted in an increase in event duration, up to 100 ms as shown in Figure 4a (i). This remarkable slowdown of molecular transport applied also to the detection of shorter fragments such as 200 bp DNA, where dwell times as long as 20 ms could be detected. In comparison, in a conventional nanopore configuration under the same electrolyte conditions (100 mM KCl) and instrumental bandwidth, 200 bp fragments went undetected due to their fast translocation times and poor SNR; see Figure 4a (ii).
Figure 4.
dsDNA detection comparison between conventional and nanobridge configurations. (a) (i) Nanobridge configuration. Ionic current recordings for 5 kb DNA (top) and 200 bp DNA (bottom) recorded in 100 mM KCl at 250 mV voltage applied. Measurements and analysis were performed using a 10 kHz low-pass filter. For visualization purposes only, the trace was filtered at 200 Hz. The measured peak current was 17.17 ± 0.96 pA and 3.42 ± 0.34 pA respectively. (ii) Corresponding measurements in a conventional nanopore configuration. For 5 kbp the peak current was 17.65 ± 2.11 pA. No events were detected for 200 bp. (iii) Scatter plots showing the dwell time and peak current distribution for 5 kbp DNA (top) and 200 bp DNA (bottom) detected in the nanobridge and conventional configurations. (b) Voltage dependence on current blockade for 1.5 kbp DNA. The peak current as determined by Gaussian fitting was 9.94 ± 0.82 pA at 250 mV, 14.62 ± 0.68 pA at 300 mV, 17.43 ± 0.68 pA at 325 mV, and 20.16 ± 0.92 pA at 350 mV, respectively. (c) (i) Peak current, fwhm, and SNR dependence on voltage applied using the nanobridge configuration. The fwhm remained largely unchanged at 1.83 ± 0.28, while SNR increases from 29.2 ± 2.4 at 250 mV to 38.8 ± 1.8 at 350 mV due to decrease in DNA translocation time at higher voltages. (ii) Peak current, fwhm, and SNR dependence on DNA length at a fixed voltage (250 mV). In the nanobridge configuration the mean peak current scales with the radius of gyration squared of the DNA molecule: from 3.42 ± 0.34 pA for 200 bp to 24.59 ± 0.92 pA for 10 kbp. A similar trend was observed for the SNR, whereas the fwhm values remained similar. As point of reference SNR and fwhm for 5 kbp detected using a conventional configuration are plotted in the graph (orange square).
The voltage dependence on current blockade for 1.5 kbp DNA is shown in Figure 4b. Similar trends are observed whereby to the standard configuration where the peak current increases proportionally with voltage. However, an interesting property was revealed: when the applied voltage was increased, DNA fragments, irrespective of size, were subjected to an even more pronounced slowing down, resulting in an increased SNR and effectively acting as a single molecule trap (Figure 4b). More typically it would be expected that the dwell time decreases due to the larger electrophoretic force experienced by the translocating analyte.41 This distinctively different behavior in the nanobridge configuration fits well with our explanation for the slow translocation times. An increased bias voltage will likely cause the molecule to compress more on entering the droplet, which could increase the degree of molecular crowding and tangling slowing down the internal diffusion of the DNA.
The ease of detection of a short fragment in a nanobridge configuration with a conventional amplifier in relatively low salt concentrations (100 mM KCl) is particularly useful as it simplifies the need of using a custom high-speed amplifier in conjunction with high salt concentrations or the use of electrolytes such as LiCl that binds strongly to DNA and has limited applicability for protein samples. Second, noise performance was significantly improved in the nanobridge configuration both in the low- and high-frequency regime, when compared to a conventional configuration, SI S10. Third, we also observed a significant enhancement of the SNR in nanobridge configuration. For example, in the case of 5 kbp, the measured SNR in the nanobridge configuration was ca. 540% higher than that of a conventional nanopore using the same device (Figure 4c). Finally, and uniquely, was the ability to accurately discriminate fragment sizes by peak currents alone with the full width half-maximum (fwhm) being below 2.5 pA for dsDNA fragments ranging from 200 bp to 10 kpb, as in Figure 4c. As an example, the mean peak current for 5 kbp DNA was 17.17 ± 0.96 pA in the nanobridge configuration compared to 17.96 ± 2.12 pA measured in a standard configuration at an applied bias of 250 mV. As is described below, the mean peak current for each fragment size closely follows the radius of gyration squared using a worm-like chain model with and without self-avoidance39,42 correction indicating that the peak current is proportional to the cross-sectional area of the DNA blocking the nanobridge. Furthermore, the lower spread in the current blockade distribution are indicative of the ability to discriminate DNA strands of different lengths based solely on peak current distributions as opposed to more conventionally the event charge deficit (ECD).43
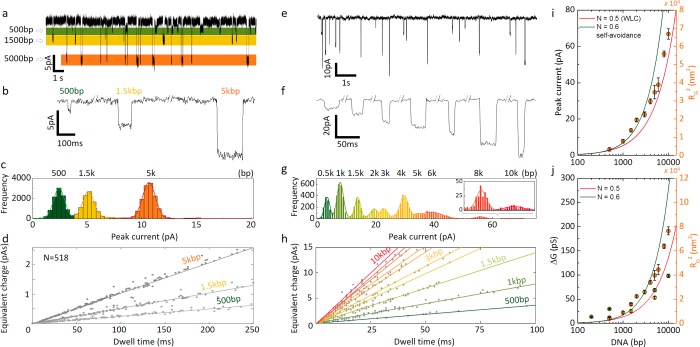
Utilizing the added advantage of using the nanobridge, we showed that it is possible to perform fragment sizing using peak amplitudes alone. For this, a solution consisting of a mixture of 500 bp, 1500 bp, and 5 kbp (Figure 5a–d) at a concentration of 100 pM was used as was a 1 kbp DNA ladder (fragment sizes: 500 bp, 1 kbp, 1.5 kbp, 2 kbp, 3 kbp, 4 kpb, 5 kbp, 6 kbp, 8 kbp, 10 kbp, Figure 5e–h). As shown in the current–time trace, Figure 5a, it was possible to identify the different species in solution with mean peak currents being 2.4 ± 0.5 pA, 5.1 ± 0.5 pA, and 10.7 ± 0.6 pA for 500 bp, 1.5 kbp, and 5 kbp, respectively (Figure 5c). The total number of detected events accurately reflected the equal concentration for the three species within the solution.
Figure 5.
Detection of mixed dsDNA sample in the nanobridge configuration. (a) Translocation signals of a sample containing 500 bp, 1.5 kbp, and 5 kbp at a concentration of 100 pM each in 100 mM KCl buffered in TE (pH 8.0) at 200 mV. (b) Representative current blockade traces of 500 bp, 1.5 kbp, and 5 kbp DNA. (c) Peak current histogram for a mixture containing 500 bp, 1.5 kbp, and 5 kbp. The mean peak current was obtained via Gaussian fitting (2.4 ± 0.5 pA for 500 bp, 5.1 ± 0.5 pA for 1.5 kbp, and 10.7 ± 0.6 pA for 5 kbp). (d) Equivalent charge plot was used to identify the different DNA population and was shown to be linear dependent on dwell time. The calculated slopes were 2.5 pA for 500 bp, 5.2 pA for 1.5 kbp, and 10.3 pA for 5 kbp. (e) Translocation signal of a 1 kbp DNA ladder, containing 10 DNA fragments (500 bp, 1.5 kbp, 2 kbp, 3 kbp, 5 kbp, 6 kbp, 8 kbp, and 10 kbp) at a total concentration of 100 pM in 100 mM KCl buffered in TE (pH 8.0) at 350 mV. (f) Representative current blockades and (g) peak current histogram. (h) Equivalent charge plot for the same sample as shown in g. (i) Peak current and (j) conductance for the 10 DNA fragments in the 1 kbp ladder (orange), sample from panel a (yellow), and data from Figure 4c (green). The scaling is in excellent agreement with the DNA radius of gyration squared (right axes) using a worm-like chain (WLC) model with and without self-avoidance.
Because of the narrow peak current distribution in the nanobridge configuration, DNA can be identified based not only on the current blockade but also by looking at the integrated area of the region bounded by each recorded event (equivalent charge). This should not be confused with the event charge deficit whose values, in conventional nanopore experiments, are related to the amount of charges carried by a specific analyte. In a nanobridge configuration, broadly dispersed dwell time distributions do not allow for a similar interpretation. Notably, in a nanobridge configuration, the integrated event profile was distributed along a straight line allowing accurate identification of DNA strands by linear fitting of the equivalent charge. The linear relationship between equivalent charge and dwell time is consistent with the proposed model; that is, the current blockade is constant for the duration of time the DNA spends in the nanobridge. For instance, for mixed fragment samples, three distinct slopes were calculated: 2.48 pA for 500 bp, 5.19 pA for 1.5 kbp, and 10.31 pA for 5 kbp (Figure 5d). These fits result in slightly lower values than in Figure 5c due to the boundaries used in the integration of individual events. This again marked a difference with a conventional nanopore approach where the event charge deficit is generally clustered rather than dispersed (SI S8). This method can be used for more complex samples, as shown by using a 1 kbp DNA ladder whereby 10 peaks can be clearly seen based on the peak current distributions alone (Figure 5g). Importantly, much like previously discussed, the peak current distributions and conductance are proportional to the DNA radius of gyration squared and hence surface area, see Figure 5i–j.
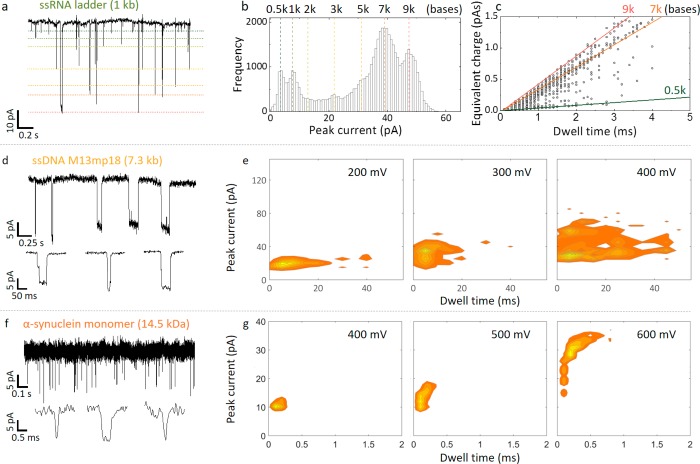
To confirm the generality of our approach, experiments were also performed with other analytes including a 1 kb RNA ladder (Figure 6a), ssDNA (M13mp18, 7.2 kb long, Figure 6b), and small protein monomers such as α-synuclein (14.5 kDa, hydrodynamic diameter 1.7–2.2 nm, 700 pM, Figure 6c). Much like the DNA ladder, it was possible to discriminate between different RNA fragment sizes albeit with lower precision due to the smaller radius of gyration and less well-defined structure. ssDNA often translocates very quickly <0.2 ms for M13; however, the detection in the nanobridge showed a ×200 slowdown, SI S11, S12. This effect is substantial considering alternative slow down strategies (sub-microseconds) often rely on buffer exchange such as use of high ionic strength LiCl22 which is not commonly compatible with biological analytes. α-synuclein has a central role in neurodegenerative disorders and particularly Parkinson’s disease; however, it is exceptionally challenging to detect with conventional nanopore technology. The detection of proteins within this size regime at low concentration is not typical due to their fast translocation times and event rates significantly lower than those predicted from Smoluchowski rate equation, often requiring protein concentrations well in excess of 10−100nM.9 As shown in Figure 6c, α-synuclein was significantly slowed down with the vast majority of the events ranging between 0.1–0.75 ms at 600 mV, while the current blockade was well-defined with a mean of 30 ± 3 pA and high SNR = 11.5 440 ± 1.1.
Figure 6.
Detection of ssRNA, ssDNA, and α-synuclein in the nanobridge configuration. (a) Current–time trace for a 1 kb ssRNA ladder (2 μg/mL) in 100 mM KCl at an applied bias of 400 mV. For visualization purposes, approximate levels are designated for each fragment size (0.5, 1, 2, 3, 5, 7, 9 kb). (b) Peak current histogram and (c) corresponding equivalent charge plot. (d) Current time trace for a 100 pM sample of M13mp18 ssDNA in 100 mM KCl at an applied bias of 200 mV. (e) Current–dwell time contour plots are shown for voltages of 200 mV, 300 mV, and 400 mV, respectively. Similar to dsDNA, the dwell times increase with voltage due to compacting of the DNA in the nanobridge. Events as slow as 40 ms could be detected which is substantially slower than in a conventional nanopore configuration. (f) Current–time trace for monomeric α-synuclein for a concentration of 700 pM in 100 mM KCl and recorded at an applied bias of 400 mV. (g) Current–dwell time contour plots are shown for voltages of 400 mV, 500 mV, and 600 mV, respectively.
In summary, we have presented a new detection method for solid state nanopores based on dual barrel nanopipettes for the confinement and high-resolution detection of single molecules within a zeptoliter volume. The presented method does not require clean room facilities, is low-cost, and is time-efficient to fabricate and operate. We demonstrate that nanobridges can slow down molecules by several orders of magnitude compared to conventional nanopores with the same dimension. This is a substantial improvement over existing nanopore methods that reduce translocation speeds by modulating viscosity, electrophoretic force, and pressure, which often result in broadening of current/dwell time distributions and lower SNR, and in turn hinders the discrimination of multiple analytes in complex samples. Sampling rates can be as low as 1 kHz, which results in significantly lower noise facilitating the rejection of local interference and at the same time enabling the use of simpler/cheaper amplifiers. We demonstrated that, compared to conventional nanopores, nanobridge translocation peak currents exhibit tighter distributions with lower fwhm values and superior SNR performance. As direct consequence, an accurate molecular size readout can be performed solely on the current amplitude or alternatively, as in the case of multiple DNA populations, from the equivalent charge/dwell time distributions.
Built upon nanopore foundations, the reported method offers substantial technological advantages including single molecule confinement and slowdown of molecular transport, enabling longer detection times at higher signal-to-noise ratios. As such, the presented method opens the door for future possibilities to measure a wide range of biological analytes and extract, label-free, single molecular and conformational information usually inaccessible with conventional nanopore technology.
Acknowledgments
We are grateful to Prof. Y. Rabin and Prof. A.Y. Grosberg for useful and stimulating discussions.
Supporting Information Available
The Supporting Information is available free of charge on the ACS Publications website at DOI: 10.1021/acs.nanolett.7b03196.
SEM images of the nanopores, salt dependence, characterization of stability, translocation statistics, and power spectral density (PDF)
J.B.E. has been funded in part by an ERC starting (NanoP), proof of concept (NanoPP), and consolidator (NanoPD) grants. A.I., Y.Z., Y.K., and J.B.E. acknowledge support from EPSRC grant EP/P011985/1. A.I. acknowledges the support of the IC Research Fellowship.
The authors declare no competing financial interest.
Supplementary Material
References
- Howorka S.; Siwy Z. Chem. Soc. Rev. 2009, 38, 2360–2384. 10.1039/b813796j. [DOI] [PubMed] [Google Scholar]
- Miles B. N.; Ivanov A. P.; Wilson K. A.; Doğan F.; Japrung D.; Edel J. B. Chem. Soc. Rev. 2013, 42, 15–28. 10.1039/C2CS35286A. [DOI] [PubMed] [Google Scholar]
- Wanunu M. Phys. Life Rev. 2012, 9, 125–158. 10.1016/j.plrev.2012.05.010. [DOI] [PMC free article] [PubMed] [Google Scholar]
- Ivanov A. P.; Actis P.; Jönsson P. P.; Klenerman D.; Korchev Y.; Edel J. B. ACS Nano 2015, 9, 3587–3594. 10.1021/acsnano.5b00911. [DOI] [PubMed] [Google Scholar]
- Clarke J.; Wu H. C.; Jayasinghe L.; Patel A.; Reid S.; Bayley H. Nat. Nanotechnol. 2009, 4, 265–270. 10.1038/nnano.2009.12. [DOI] [PubMed] [Google Scholar]
- Carson S.; Wanunu M. Nanotechnology 2015, 26, 1–14. 10.1088/0957-4484/26/7/074004. [DOI] [PMC free article] [PubMed] [Google Scholar]
- Venkatesan B. M.; Bashir R. Nat. Nanotechnol. 2011, 6, 615–624. 10.1038/nnano.2011.129. [DOI] [PubMed] [Google Scholar]
- Pedone D.; Firnkes M.; Rant U. Anal. Chem. 2009, 81, 9689–9694. 10.1021/ac901877z. [DOI] [PubMed] [Google Scholar]
- Storm A. J.; Storm C.; Chen J.; Zandbergen H.; Joanny J. F.; Dekker C. Nano Lett. 2013, 13, 658–663.23343345 [Google Scholar]
- Rissin D. M.; Kan C. W.; Campbell T. D.; Howes S. C.; Fournier D. R.; Song L.; Piech T.; Patel P. P.; Chang L.; Rivnak A. J.; Ferrell E. P.; Randall J. D.; Provuncher J. K.; Walt D. R.; Duffy D. C. Nat. Biotechnol. 2010, 28, 595–599. 10.1038/nbt.1641. [DOI] [PMC free article] [PubMed] [Google Scholar]
- Fraccari R. L.; Ciccarella P.; Bahrami A.; Carminati M.; Ferrari G.; Albrecht T. Nanoscale 2016, 8, 7604–7611. 10.1039/C5NR08634E. [DOI] [PubMed] [Google Scholar]
- Rosenstein J. K.; Wanunu M.; Merchant C. A.; Drndić M.; Shepard K. L. Nat. Methods 2012, 9, 487–492. 10.1038/nmeth.1932. [DOI] [PMC free article] [PubMed] [Google Scholar]
- Shekar S.; Niedzwiecki D. J.; Chien C. C.; Ong P.; Fleischer D. A.; Lin J.; Rosenstein J. K.; Drndić M.; Shepard K. L. Nano Lett. 2016, 16, 4483–4489. 10.1021/acs.nanolett.6b01661. [DOI] [PMC free article] [PubMed] [Google Scholar]
- Feng J.; Liu K.; Bulushev R. D.; Khlybov S.; Dumcenco D.; Kis A.; Radenovic A. Nat. Nanotechnol. 2015, 10, 1070–1076. 10.1038/nnano.2015.219. [DOI] [PubMed] [Google Scholar]
- Fologea D.; Gershow M.; Ledden B.; McNabb D. S.; Golovchenko J. A.; Li J. Nano Lett. 2005, 5, 1905–1909. 10.1021/nl051199m. [DOI] [PMC free article] [PubMed] [Google Scholar]
- Kowalczyk S. W.; Wells D. B.; Aksimentiev A.; Dekker C. Nano Lett. 2012, 12, 1038–1044. 10.1021/nl204273h. [DOI] [PMC free article] [PubMed] [Google Scholar]
- Garaj S.; Hubbard W.; Reina A.; Kong J.; Branton D.; Golovchenko J. A. Nature 2010, 467, 190–193. 10.1038/nature09379. [DOI] [PMC free article] [PubMed] [Google Scholar]
- Larkin J.; Henley R.; Bell D. C. ACS Nano 2013, 7, 10121–10128. 10.1021/nn404326f. [DOI] [PMC free article] [PubMed] [Google Scholar]
- Liu S.; Lu B.; Zhao Q.; Li J.; Gao T.; Chen Y.; Zhang Y.; Liu Z.; Fan Z.; Yang F.; You L.; Yu D. Adv. Mater. 2013, 25, 4549–4554. 10.1002/adma.201301336. [DOI] [PubMed] [Google Scholar]
- Squires A. H.; Hersey J. S.; Grinstaff M. W.; Meller A. J. Am. Chem. Soc. 2013, 135, 16304–16307. 10.1021/ja408685x. [DOI] [PMC free article] [PubMed] [Google Scholar]
- Freedman K. J.; Crick C. R.; Albella P.; Barik A.; Ivanov A. P.; Maier S. A.; Oh S. H.; Edel J. B. ACS Photonics 2016, 3, 1036–1044. 10.1021/acsphotonics.6b00119. [DOI] [Google Scholar]
- Lu B.; Hoogerheide D. P.; Zhao Q.; Zhang H.; Tang Z.; Yu D.; Golovchenko J. A. Nano Lett. 2013, 13, 3048–3052. 10.1021/nl402052v. [DOI] [PMC free article] [PubMed] [Google Scholar]
- Peng H.; Ling X. S. Nanotechnology 2009, 20, 185101–185101. 10.1088/0957-4484/20/18/185101. [DOI] [PMC free article] [PubMed] [Google Scholar]
- Verschueren D. V.; Jonsson M. P.; Dekker C. Nanotechnology 2015, 26, 234004–234004. 10.1088/0957-4484/26/23/234004. [DOI] [PMC free article] [PubMed] [Google Scholar]
- Crick C. R.; Albella P.; Ng B.; Ivanov A. P.; Roschuk T.; Cecchini M. P.; Bresme F.; Maier S. A.; Edel J. B. Nano Lett. 2015, 15, 553–559. 10.1021/nl504536j. [DOI] [PubMed] [Google Scholar]
- Anderson B. N.; Muthukumar M.; Meller A. ACS Nano 2013, 7, 1408–1414. 10.1021/nn3051677. [DOI] [PMC free article] [PubMed] [Google Scholar]
- Rodolfa K. T.; Bruckbauer A.; Zhou D.; Korchev Y. E.; Klenerman D. Angew. Chem., Int. Ed. 2005, 44, 6854–6859. 10.1002/anie.200502338. [DOI] [PubMed] [Google Scholar]
- Rodolfa K. T.; Bruckbauer A.; Zhou D.; Schevchuk A. I.; Korchev Y. E.; Klenerman D. Nano Lett. 2006, 6, 252–257. 10.1021/nl052215i. [DOI] [PubMed] [Google Scholar]
- Crick C. R.; Sze J. Y. Y.; Rosillo-Lopez M.; Salzmann C. G.; Edel J. B. ACS Appl. Mater. Interfaces 2015, 7, 18188–18194. 10.1021/acsami.5b06212. [DOI] [PMC free article] [PubMed] [Google Scholar]
- Freedman K. J.; Otto L. M.; Ivanov A. P.; Barik A.; Oh S. H.; Edel J. B. Nat. Commun. 2016, 7, 10217–10217. 10.1038/ncomms10217. [DOI] [PMC free article] [PubMed] [Google Scholar]
- Wei C.; Bard A. J.; Feldberg S. W. Anal. Chem. 1997, 69, 4627–4633. 10.1021/ac970551g. [DOI] [Google Scholar]
- Ebejer N.; Schnippering M.; Colburn A. W.; Edwards M. A.; Unwin P. R. Anal. Chem. 2010, 82, 9141–9145. 10.1021/ac102191u. [DOI] [PubMed] [Google Scholar]
- Hansma P. K.; Drake B.; Marti O.; Gould S. A. C.; Prater C. B. Science 1989, 243, 641–643. 10.1126/science.2464851. [DOI] [PubMed] [Google Scholar]
- Korchev Y. E.; Bashford C. L.; Milovanovic M.; Vodyanoy I.; Lab M. J. Biophys. J. 1997, 73, 653–658. 10.1016/S0006-3495(97)78100-1. [DOI] [PMC free article] [PubMed] [Google Scholar]
- Pud S.; Chao S.-H.; Belkin M.; Verschueren D.; Huijben T.; van Engelenburg C.; Dekker C.; Aksimentiev A. Nano Lett. 2016, 16, 8021–8028. 10.1021/acs.nanolett.6b04642. [DOI] [PMC free article] [PubMed] [Google Scholar]
- Liu X.; Skanata M. M.; Stein D. Nat. Commun. 2015, 6, 6222–6222. 10.1038/ncomms7222. [DOI] [PubMed] [Google Scholar]
- Langecker M.; Pedone D.; Simmel F. C.; Rant U. Nano Lett. 2011, 11, 5002–5007. 10.1021/nl2030079. [DOI] [PubMed] [Google Scholar]
- Pedone D.; Langecker M.; Abstreiter G.; Rant U. Nano Lett. 2011, 11, 1561–1567. 10.1021/nl104359c. [DOI] [PubMed] [Google Scholar]
- Wenner J. R.; Williams M. C.; Rouzina I.; Bloomfield V. A. Biophys. J. 2002, 82, 3160–3169. 10.1016/S0006-3495(02)75658-0. [DOI] [PMC free article] [PubMed] [Google Scholar]
- Mihovilovic M.; Hagerty N.; Stein D. Phys. Rev. Lett. 2013, 110, 1–5. 10.1103/PhysRevLett.110.028102. [DOI] [PubMed] [Google Scholar]
- Steinbock L. J.; Lucas A.; Otto O.; Keyser U. F. Electrophoresis 2012, 33, 3480–3487. 10.1002/elps.201100663. [DOI] [PubMed] [Google Scholar]
- Flory P. J.Principles of Polymer Chemistry; Cornell University Press, 1953. [Google Scholar]
- Bell N. A. W.; Muthukumar M.; Keyser U. F. Phys. Rev. E: Stat. Phys., Plasmas, Fluids, Relat. Interdiscip. Top. 2016, 93, 022401. 10.1103/PhysRevE.93.022401. [DOI] [PMC free article] [PubMed] [Google Scholar]
Associated Data
This section collects any data citations, data availability statements, or supplementary materials included in this article.


