

Abstract
The ability to identify and quantify small molecule metabolites derived from gut microbial-mammalian co-metabolism is essential for the understanding of the distinct metabolic functions of the microbiome. To date, analytical protocols that quantitatively measure a complete panel of microbial metabolites in biological samples have not been established, but urgently needed by the microbiome research community. Here, we report an automated high-throughput quantitative method using a gas chromatography/time-of-flight mass spectrometry (GC/TOFMS) platform to simultaneously measure over one hundred microbial metabolites in human serum, urine, feces and Escherichia coli cell samples within 15 minutes per sample. A reference library was developed consisting of 145 methyl and ethyl chloroformate (MCF and ECF) derivatized compounds with their mass spectral and retention index information for metabolite identification. These compounds encompass different chemical classes including fatty acids, amino acids, carboxylic acids, hydroxylic acids and phenolic acids, as well as, benzoyl and phenyl derivatives, indoles, etc., that are involved in a number of important metabolic pathways. Within an optimized range of concentrations and sample volumes, most derivatives of both reference standards and endogenous metabolites in biological samples exhibited satisfactory linearity (R2 > 0.99), good intra-batch reproducibility and acceptable stability within 6 days (RSD<20%). This method was further validated by examination of the analytical variability of 76 paired human serum, urine, and fecal samples as well as quality control samples. Our method involved using high-throughput sample preparation, measurement with automated derivatization and rapid GC/TOFMS analysis. Both techniques are well suited for microbiome metabolomics studies.
TOC
INTRODUCTION
Gut dysbiosis has been associated with various diseases, including obesity1, diabetes2, non-alcoholic fatty liver disease3, inflammatory bowel diseases4, and cancer5. A better understanding of the contribution that variations in gut microbiota metabolites make to host disease risk and health sustainability will assist in the development of new strategies for disease prevention and therapeutic intervention6,7. The host and symbiotic gut microbiota coproduce a large array of small molecule metabolites during the metabolism of food and xenobiotics, many of which play critical roles in shuttling information between host cells and the microbial symbionts8. Recent studies have indicated that the metabolic variations in host’s body fluids and tissues were directly related to the activities of various microorganisms that coexist in the gut9. Any intercellular metabolic transformation (metabolic fingerprint) due to the differences in microbial communities could cause significant alterations of the extracellular metabolome in the host (metabolic footprints). While it is useful to understand changes in gut microbial phyla/species that affect host health, it is much more useful to characterize changes in microbial metabolites that can be analyzed in easily obtainable body fluids such as plasma or urine and correlate changes in microbial metabolites with a patient’s condition. Such an approach adds functionality to the metagenomics analysis, thus linking meta-genotypes to their metabolic phenotypes of the host.
Important small molecule metabolites that regulate host-microbiota interactions include short-chain fatty acids10, amino acids11, phenolic, benzoyl and phenyl derivatives12, indole derivatives13, lipids14, bile acids15, choline16, vitamin17, polyamines18, etc. Our previous study was a metabolic profile of the metabolic footprints of gut microbial-mammalian co-metabolism in rats exposed to antibiotic. A combined gas chromatography/ mass spectrometry (GC/MS) and liquid chromatography/ mass spectrometry (LC/MS) approach was used and the result was a panel containing 202 urinary and 223 fecal metabolites that were considered as potential readouts of the co-metabolism effect12. More recently, a strategy for the targeted metabolomics analysis of 11 gut microbiota-host co-metabolites in rat serum, urine and feces was developed and employed ultrahigh performance liquid chromatography–tandem mass spectrometry (UPLC/MS/MS)19. To our knowledge there has been no publication that proposes a metabolomics method for the identification and quantification of a large set of microbial metabolites.
The simultaneous determination of numerous gut microbiota-host co-metabolites with as few platforms as possible in complex biological samples is challenging, due to the fact that they have diverse structures with varied chemical and physical properties. The derivatization technique employed in this GC/MS study was the alkyl chloroformate derivatization proposed by Husek20, which allows simultaneous esterification of carboxylic group, amino group and hydroxyl group linked to benzene ring or joined to the side chain, creating alkyl esters or N(O)-alkoxycarbonyl ethers, respectively. In contrast to the popular derivatization approach of silylation, alkyl chloroformate derivatization has advantages in being faster (about 1 min), it involves milder reaction conditions (ie., aqueous medium and room temperature), has better reproducibility and greater stability21. The combination of these factors therefore makes the derivatization protocol achievable using an automated robotic workstation. Methods based on alkyl chloroformate derivatization for metabolomics application have been published by our lab22–25 and others26–29. Most of them use methyl chloroformate (MCF)26–28 or ethyl chloroformate (ECF)22–24,29, but other chloroformate compounds have been used as well25. The performance for quantification of one or two chemical classes of compounds such as amino acids26,28,29, non-amino organic acids26,28,29, fatty acids25, as well as phenolic acids30 based on chloroformate derivatization has been reported previously in biological cells and fluids. However, no such method has been optimized for the simultaneous measurement of all the aforementioned compounds and the many more that exist related to gut microbiota.
In this work, we developed a practical and feasible method of targeted identification and quantification of as many metabolites as possible associated with gut microbiota-host co-metabolism. These results will enable us to acquire wider insights on the functioning of the symbiotic supraorganism system. To the best of our knowledge, the current study represents the first comprehensive alkyl chloroformate (methyl- and ethyl-) derivative library containing mass spectral/retention index (MS/RI) information for 145 structurally diverse compounds all of which were acquired using automated derivatization via a commercially available robotic workstation and GC/time-of-flight MS (GC/TOFMS) analysis. The sample preparation and GC separation parameters were optimized to produce a rapid, simple and sensitive method for simultaneous measurement of 92, 103, 118 and 52 compounds in human serum, urine, feces, and Escherichia coli (E. coli) cell, respectively within 15 minutes. This automated and high-throughput method, which has been validated using a large range of reference standards and biological samples, is well suited for future microbiome metabolomics research.
EXPERIMENTAL SECTION
Chemicals
The derivatization regents, MCF and ECF, as well as HPLC grade solvents including methanol, ethanol, chloroform and pyridine were purchased from Sigma-Aldrich (St. Louis, MO, USA). Sodium hydroxide, sodium bicarbonate and anhydrous sodium sulfate were of analytical grade and obtained from JT Baker Co. (Phillipsburg, NJ). All standard compounds were commercially purchased from Sigma-Aldrich and Nu-Chek Prep (Elysian, MN, USA). Ultrapure water was prepared by the Milli-Q system (Millipore, Billerica, MA).
The stock solutions of all reference standards were prepared in HPLC grade methanol or ultrapure water with a concentration of either 5 mg mL−1 or 1 mg mL−1. The mixed working standard solutions containing methanol-soluble or water-soluble standards were prepared by dilution with solvents of the same chemical class. 145 representative compounds from different chemical classes (amino acids, fatty acids, carboxylic acids, hydroxyl acids, phenolic acids, indoles, etc.) were used. Further serial dilutions of the working standard solutions were made to generate the calibration curves. A mixture of internal RI markers was prepared by combining equal volumes of 5 mg mL−1 chloroform stock solutions of thirteen normal alkanes with carbon chain lengths, C8, C9, C10, C12, C14, C16, C18, C20, C22, C24, C26, C28, and C30.
Sample preparation and GC/TOFMS analysis
We selected de-identified human biological samples from our sample bank for the method development, evaluation, and validation. There were 76-paired human serum, urine and feces samples. The pooled quality control (QC) samples employed in this study were purchased from Sigma-Aldrich (St. Louis, MO, USA) or collected from volunteers. All samples were stored at −80 °C until analysis.
Extraction of metabolites from human serum, urine, and feces
Serum and urine samples were thawed on ice and prepared using the following procedure. Each aliquot of 100 µL urine sample was transferred to an auto-sampler glass vial and lyophilized using a Labconco freeze-dryer (Kansas City, MO). Serum samples required protein precipitation before lypholization. Briefly, 100 µL of serum samples were extracted with 300 µL of cold methanol in an Eppendorf microcentrifuge tube, and placed in a −20 °C freezer for 30 min. The extracts were centrifuged at 16,000 rcf and 4 °C for 10 min and the supernatant was immediately transferred to an auto-sampler glass vial and lyophilized. For fecal samples, 10 mg of lyophilized feces was homogenized with 300 µL of NaOH (1M) solution and centrifuged at 16,000 rcf at 4 °C for 20 min. Each 200 µL of supernatant was transferred into an auto-sampler vial, and the residue was further exacted with 200 µL of cold methanol. After the second step of homogenization and centrifugation, 167 µL of supernatant was combined with the first supernatant in the sample vial. The solids from serum and urine samples after the lyophilization process and aqueous fecal extracts were sealed and stored at −80 °C for a subsequent automated derivatization assay.
Extraction of intracellular metabolites from E. coli
An E. coli BL 21 cell line was purchased from Sigma-Aldrich (St. Louis, MO). Cell culture and quenching of the cells were carried out according to a previous report31. Briefly, cells were harvested in a 50 mL conical tube. After centrifugation at 200 g and 4 °C for 10 min (Allegra X15R, Beckman Coulter, Brea, CA), the culture media was carefully removed and the cells were washed twice with 50 mL freshly-prepared phosphate buffered saline (PBS). The cells were re-suspended with 1 mL of PBS and the number of cells was counted with a TC20 Automated Cell Counter (Bio-Rad Laboratories Inc., Hercules, CA). The average cell number ideal for the quantitation of microbial metabolites was 1 × 10⁷. The cell lysates were homogenized with 50 µL of Millipore ultrapure water and extracted with 200 µL of cold methanol. After centrifugation at 16,000 rcf and 4 °C for 10 min, the supernatant was carefully transferred to an autosampler vial, lyophilized and stored at −80 °C prior to use.
Automated chloroformate derivatization
The sample derivatization protocols with MCF and ECF were based on the method described by Villas-Boas et al26 and our previously published procedures22, with some minor modifications. For routine large-scale sample analysis, sample derivatization and all liquid handling were performed by a commercially available robotic workstation (GERSTEL MPS Autosampler). MCF and ECF derivatization procedures were processed under exactly the same parameters. The only difference was the use of methanol for MCF derivatization and ethanol for ECF derivatization respectively, in order to avoid the production of the mixture of methyl and ethyl chloroformate derivatives. Briefly, for serum and urine samples, the sealed glass vials containing solids after lyophilization were placed in a cooled tray at 4 °C for automated derivatization. The solids were first redissolved in 200 µL of sodium hydroxide solution (1M) and then mixed with 167 µL of methanol (or ethanol) and 34 µL of pyridine. 20 µL of MCF (or ECF) were added to the mixture and the samples were shaken vigorously for exactly 30 s. Another 20 µL of MCF (or ECF) were added again and samples shaken for another 30 s. Subsequently, 400 µL of chloroform/RIs mixture (385 µg mL−1 for each) (50:1 by vol.) were added and samples were shaken for 10 s followed by an addition of 400 µL of sodium bicarbonate solution (50 mM) and additional shaking for 10 s. Samples were then centrifuged at 2000 × g for 10 min at 4 °C in order to clearly visualize the double meniscus. The bottom chloroform phase was transferred to GC vials containing ~100 mg of anhydrous sodium sulfate.
Aqueous fecal extracts, after the above two-step extraction with sodium hydroxide solution followed by methanol (or ethanol) were then derivatized following the aforementioned procedure, omitting the initial addition of 200 µL of sodium hydroxide solution (1 M) and 167 µL of methanol or ethanol.
GC/TOFMS analysis
Samples were randomly analyzed by GC/TOFMS (Agilent 6890N gas chromatography coupled with a LECO Pegasus HT time-of-flight mass spectrometer) using our newly developed, optimized conditions. One µL of each derivatized sample was injected using a splitless injection technique into a DB-5 MS capillary column (30 m × 0.25 mm i.d., 0.25 µm film thickness; (5%-phenyl)-methylpolysiloxane bonded and cross-linked; Agilent J&W Scientific, Folsom, CA), with helium as the carrier gas at a constant flow rate of 1.0 mL min−1. The solvent delay time was set to 2.5 min. The optimized temperature gradient was the following: 45 °C held for 1 min, then increased at a rate of 20 °C min−1 up to 260 °C and 40 °C min−1 to 320 °C, then held there for 2 min. The total time of analysis was 15.25 min. The temperature of the injection, transfer interface and ion source were set to 270, 270, and 220 °C, respectively. Electron impact ionization (70 eV) at examined m/z range of 38−650 was used. The acquisition rate was 20 spectra second−1.
Data processing
Raw data from GC/TOFMS analysis were exported in NetCDF format to ChromaTOF software (v4.50, Leco Co., CA, USA) and subjected to the following preprocessing, baseline correction, smoothing, noise reduction, deconvolution, library searching, and area calculation. Individual compound identification was performed by comparing both MS similarity and Kovats RI distance with reference standards in the author-constructed alkyl chloroformate derivative library, utilizing a similarity score cutoff of more than 70%. Afterwards, data sets were exported to a CSV file where each datum was labeled with a sample name, compound name, Kovats RI, quantification mass, peak area and concentration. Multivariate analysis was performed using SIMCA 14 software (Umetrics AB, Umeå, Sweden).
RESULTS AND DISCUSSION
A MS/RI library of MCF and ECF derivatives
The application of mass spectra and retention index analysis has been proven to be an efficient technique for accurate compound identification in GC/MS-based metabolomics32. In this study, we compiled a MS/RI library consisting of MCF and ECF derivatives from 145 reference standards (Table 1). As shown in Figure 1A, these compounds span a large number of chemical classes, including fatty acids (29 %), amino acids and derivatives (26 %), carboxylic acids and derivatives (11 %), hydroxy acids and derivatives (6 %), phenols, phenylacetic acid, benzyl alcohols, benzoic acid and their derivatives (12 %), indoles (6 %), cinnamic acids, keto-acids, sugar acids and their derivatives (4 %), and other nitrogen-containing compounds generally found in human urine or feces (6 %). A detailed, tabulated analysis of the determined metabolites and their corresponding metabolic pathways are listed in Supporting Information Table S1. Our library enriched the number of MCF derivatives of amino acids and non-amino organic acids reported by Smart et al27, especially previously unreported aromatic homocyclic or heterocyclic compounds. The inclusion of the classic Kovats RI parameter ensures that this newly compiled library is more reliable for unambiguous metabolite identification than previous libraries with only reference mass spectral or with both mass spectral and retention time. The classic Kovats RI parameter also makes possible a wider application by different laboratories in different GC separation conditions.
Table 1.
Main fragments and Kovats RIs of 145 compounds in our library that were produced using MCF and ECF derivatization for GC/TOF-MS analysis.
| No. | Compounds | MCF Derivatives | ECF Derivatives | Notes | No. | Compounds | MCF Derivatives | ECF Derivatives | Notes | ||||
|---|---|---|---|---|---|---|---|---|---|---|---|---|---|
|
|
|
||||||||||||
| main fragments (m/z)# |
RI | main fragments (m/z)# |
RI | main fragments (m/z)# |
RI | main fragments (m/z)# |
RI | ||||||
| 1 | (±)-2-Methylpentanoic acid | 88, 43, 57, 71, 101 | 885 | 74, 43, 102, 55, 87 | 947 | c | 75_1 | L-2-Hydroxyglutaric acid (m) | 85, 47, 144 | 1241 | 85, 131,159, 57, 203 | 1684 | bcd |
| 2_1 | 2-Hydroxybutyric acid (m) | 59, 45, 73, 117, 100 | 1108 | 59, 131, 87, 159, 176 | 1250 | abc | 75_2 | L-2-Hydroxyglutaric acid (s) | 71, 59, 99, 131, 175 | 1502 | 85, 57, 159 | 1314 | |
| 2_2 | 2-Hydroxybutyric acid (s) | 59, 41, 89, 69 | 851 | 59, 41, 75, 89, 103 | 919 | 76 | L-Alanine | 70, 102, 129, 59, 42 | 1132 | 116, 44, 70, 88, 144 | 1279 | abcd | |
| 3 | 2-Methylhexanoic acid | 88, 43, 57, 69, 101 | 966 | 74, 43, 102, 56, 85 | 1029 | 77 | L-Alpha-aminobutyric acid | 84, 56, 116, 72, 103 | 1217 | 130, 58, 102, 86, 74 | 1362 | abcd | |
| 4_1 | 2-Phenylglycine (m) | 77, 132, 51, 164, 104 | 1657 | 132, 178, 77, 105, 205 | 1785 | 78 | L-Asparagine | 127, 59, 83, 95, 146 | 1407 | 141, 69, 95, 56, 113 | 1537 | abcd | |
| 4_2 | 2-Phenylglycine (s) | 77, 132, 51, 105, 191 | 1439 | 132, 77, 91, 105, 177 | 2029 | 79 | L-Aspartic acid | 86, 59, 128, 160, 96 | 1481 | 188, 70, 142, 100, 88 | 1661 | abcd | |
| 5 | 2-Phenylpropionate | 105, 77, 164, 51, 63 | 1219 | 77, 105, 178, 63, 91 | 1295 | 80 | L-Cysteine | 160, 59, 116, 132, 146 | 1707 | 220, 74,102, 132, 174 | 1885 | abcd | |
| 6_1 | 3-(3-Hydroxyphenyl)-3-hydroxypropanoic acid (m) | 91, 178, 59,134, 238 | 1751 | 120, 91, 77, 149, 194 | 1886 | abc | 81_1 | L-Cystine (m) | 160, 59, 100, 132, 192 | 2382 | 74, 188, 90, 174, 220 | 2793 | |
| 6_2 | 3-(3-Hydroxyphenyl)-3-hydroxypropanoic acid (s) | 120, 77, 91, 107, 180 | 1595 | 91, 119, 120, 65, 50 | 1082 | 81_2 | L-Cystine (s) | 160, 59, 192, 100, 76 | 2601 | 74, 146, 174, 188, 102 | 2545 | ||
| 7 | 3-Aminoisobutanoic acid | 88, 56, 96, 115, 144 | 1262 | 102, 56, 74, 112, 129 | 1402 | bc | 82 | L-Glutamic acid | 114, 142, 174, 59, 82 | 1599 | 128, 84, 156, 56, 202 | 1772 | abcd |
| 8_1 | 3-Hydroxybutyric acid (m) | 43, 74, 59, 87, 103 | 874 | 60, 43, 71, 87, 117 | 944 | abc | 83_1 | L-Glutamine (m) | 141, 109, 59, 68, 82 | 1546 | 155, 83, 56, 111, 43 | 1667 | |
| 8_2 | 3-Hydroxybutyric acid (s) | 59, 69, 100, 85, 75 | 1124 | 69, 114, 131, 159, 99 | 1274 | 83_2 | L-Glutamine (s) | 128, 84, 56, 143, 70 | 1152 | 84, 56, 128, 173, 156 | 1934 | ||
| 9 | 3-Hydroxyhippuric acid | 179, 92, 135, 107, 208 | 2174 | 121, 149, 92, 193, 223 | 2365 | 84 | L-Histidine | 81, 59, 139, 194, 210 | 2084 | 81, 136, 154, 238, 254 | 2272 | abcd | |
| 10_1 | 3-Hydroxyisovaleric acid (m) | 43, 59, 85, 117, 74 | 891 | 43, 59, 85, 131, 103 | 959 | abc | 85 | L-Homoserine | 56, 100, 115, 83, 70 | 1378 | 100, 56, 70, 129, 115 | 1473 | abcd |
| 10_2 | 3-Hydroxyisovaleric acid (s) | 73, 44, 56, 117, 90 | 1149 | 43, 59, 83, 128, 173 | 1301 | 86 | Linoleic acid | 55, 67, 81, 95, 294 | 2096 | 67, 55, 81, 95, 109 | 2158 | ac | |
| 11 | 3-Hydroxyphenylacetic acid | 121, 59, 91, 78, 180 | 1657 | 107, 77, 180, 135, 90 | 1784 | abc | 87 | L-Isoleucine | 115, 144, 88, 70, 59 | 1370 | 101, 129, 158, 70, 112 | 1499 | abc |
| 12 | 3-Indoleacetonitrile | 121, 59, 78, 224, 165 | 1682 | 107, 77, 135, 180, 252 | 1808 | d | 88_1 | L-Kynurenine (m) | 146, 92, 119, 248, 205 | 2355 | 146, 92, 119, 262, 205 | 2477 | bd |
| 13 | 3-Indolepropionic acid | 130, 203, 77, 115, 143 | 1934 | 130, 217, 143, 115, 77 | 2031 | ac | 88_2 | L-Kynurenine (s) | 117, 90, 63, 145, 173 | 1847 | 146, 120, 92, 65, 175 | 2459 | |
| 14 | 3-Methyl-2-oxovaleric acid | 57, 41, 85, 69, 144 | 972 | 57, 41, 85, 102, 158 | 1047 | abc | 89 | L-Lactic acid | 59, 103, 43, 130, 87 | 1030 | 45, 73, 117, 145, 56 | 1167 | |
| 15 | 3-Methylindole* | 130, 131, 77, 51, 103 | 1416 | 130, 131, 77, 51, 103 | 1430 | c | 90 | L-Leucine | 88, 115, 144, 128, 69 | 1357 | 158, 102, 43, 112, 69 | 1483 | abcd |
| 16 | 3-Methylpentanoic acid | 74, 43, 59, 101, 55 | 899 | 88, 60, 43, 70, 55 | 964 | bc | 91 | L-Lysine | 142, 212, 244, 59, 88 | 2021 | 156, 56, 84, 102, 128 | 2207 | abcd |
| 17_1 | 4-Hydroxybenzoic acid (m) | 135, 59, 77, 92, 107 | 1581 | 121, 138, 65, 93, 166 | 1731 | abc | 92 | L-Methionine | 115, 61, 147, 128, 162 | 1621 | 129, 61, 101, 175, 114 | 1737 | abcd |
| 17_2 | 4-Hydroxybenzoic acid (s) | 121, 65, 93, 152, 74 | 1472 | 121, 152, 65, 93, 193 | 1658 | 93_1 | L-Norleucine (m) | 88, 69, 144, 59, 112 | 1406 | 69, 56, 112, 158, 86 | 1538 | cd | |
| 18_1 | 4-Hydroxycinnamic acid (m) | 161, 59, 89, 133, 236 | 1883 | 147, 120, 91, 192, 164 | 2041 | bc | 93_2 | L-Norleucine (s) | 69, 112, 59, 83, 128 | 1171 | 158, 230, 74, 86, 114 | 1746 | |
| 18_2 | 4-Hydroxycinnamic acid (s) | 147, 91, 119, 178, 65 | 1760 | 147, 120, 91, 192, 164 | 1926 | 94_1 | L-Phenylalanine (m) | 91, 162, 65, 128, 146 | 1730 | 91, 176, 65, 128, 77 | 1850 | abcd | |
| 19 | 4-Hydroxyphenylpyruvic acid | 135, 77, 92, 107, 180 | 1449 | 121, 65, 93, 77, 51 | 1531 | bc | 94_2 | L-Phenylalanine (s) | 91, 162, 65, 128, 77 | 1528 | 91, 128, 176, 65, 148 | 1586 | |
| 20 | 4-Methylhexanoic acid | 74, 43, 55, 87, 115 | 996 | 41, 61, 74, 101, 129 | 1064 | bc | 95 | L-Proline | 128, 59, 82, 187, 68 | 1408 | 142, 70, 98, 114, 215 | 1526 | abcd |
| 21 | 5-Dodecenoic acid | 74, 55, 67, 96, 138 | 1520 | 88, 55, 96, 138, 180 | 1592 | abcd | 96_1 | L-Serine (m) | 86, 42, 58, 145 | 1434 | 114, 60, 74, 102, 204 | 1727 | |
| 22 | 5-Hydroxy-L-tryptophan | 204, 117, 145, 350, 90 | 2894 | 146, 218, 117,174, 346 | 2824 | b | 96_2 | L-Serine (s) | 56, 144, 86, 70, 103 | 1542 | 86, 60, 132, 74, 102 | 1495 | |
| 23 | Adipic acid | 59, 55, 114, 101, 74 | 1248 | 111, 55, 73, 83, 157 | 1398 | abcd | 97_1 | L-Tryptophan (m) | 130, 77, 103, 276, 185 | 2410 | 130, 77, 103, 304, 258 | 2534 | abcd |
| 24 | Alpha-Hydroxyisobutyric acid | 73, 43, 59, 117, 101 | 1040 | 59, 43, 87, 131, 159 | 1169 | bc | 97_2 | L-Tryptophan (s) | 130, 77, 103, 244, 185 | 2163 | 130, 77, 103, 258, 185 | 2218 | |
| 25 | Alpha-Linolenic acid | 55, 67, 79, 93, 107 | 2100 | 79, 67, 55, 93, 108 | 2186 | ac | 98_1 | L-Tyrosine (m) | 121, 236, 59, 165, 77 | 2201 | 107, 192, 264, 74, 91 | 2408 | abcd |
| 26 | Aminoadipic acid | 114, 59, 156, 188, 124 | 1698 | 170, 98, 55, 128, 216 | 1870 | abc | 98_2 | L-Tyrosine (s) | 121, 165, 59, 77, 91 | 1985 | 107, 135, 192, 264, 77 | 2118 | |
| 27 | Arachidic acid | 74, 87, 43, 55, 283 | 2337 | 88, 43, 101, 55, 73 | 2404 | ac | 99 | L-Valine | 115, 98, 130, 55, 87 | 1270 | 144, 55, 101, 72, 129 | 1409 | abcd |
| 28 | Arachidonic acid | 79, 55, 67, 91, 203 | 2276 | 79, 55, 67, 91, 105 | 2335 | abc | 100 | Malic acid | 59, 75, 85,113, 101 | 1393 | 71, 43, 89, 117, 127 | 1587 | abc |
| 29 | Behenic acid | 74, 87, 43, 55, 311 | 2552 | 88, 43, 101, 55, 69 | 2614 | acd | 101 | Malonic acid | 59, 101, 74, 42, 69 | 939 | 115, 43, 88, 60, 133 | 1066 | bc |
| 30 | Beta-Alanine | 101, 56, 70, 74, 88 | 1222 | 115, 70, 98, 56, 88 | 1375 | bc | 102 | m-Cresol | 77, 91, 166, 107, 122 | 1256 | 180, 108, 77, 91, 136 | 1357 | cd |
| 31 | Butyric acid | 74, 43, 71, 59, 87 | 719 | 71, 43, 88, 60, 101 | 837 | abc | 103 | Melatonin* | 160, 173, 117, 145, 232 | 2477 | 173, 160, 145, 117, 232 | 2510 | |
| 32 | Capric acid | 143, 55, 87, 101, 129 | 1332 | 88, 101,73, 55, 157 | 1396 | abcd | 104 | Methylsuccinic acid | 59, 129, 101, 41, 69 | 1062 | 115, 43, 73, 87, 143 | 1204 | bcd |
| 33 | Caproic acid | 74, 43, 59, 55, 87 | 934 | 60, 43, 88, 73, 101 | 998 | abc | 105 | Myristic acid | 74, 87, 43, 55, 101 | 1728 | 88, 41, 55, 73, 101 | 1789 | ac |
| 34 | Caprylic acid | 74, 87, 43, 55, 101 | 1118 | 88, 41, 55, 70, 101 | 1192 | abc | 106 | Myristoleic acid | 55, 74, 87, 110, 137 | 1712 | 55, 69, 88, 101, 124 | 1777 | abcd |
| 35 | Cinnamic acid | 131, 103, 77, 51, 162 | 1409 | 103, 131, 77, 176, 147 | 1502 | abc | 107 | N-acetyltryptophan | 130, 77, 103, 201, 260 | 2412 | 130, 215, 77, 103, 143 | 2463 | abc |
| 36 | cis-Aconitic acid | 59, 153, 184, 125, 98 | 1453 | 112, 84, 139, 167, 213 | 1640 | abc | 108 | Nervonic acid | 55, 69, 83, 97, 111 | 2710 | 55, 69, 83, 97, 111 | 2778 | acd |
| 37_1 | Citraconic acid (m) | 59, 126, 68, 98, 53 | 1108 | 112, 84, 141, 68, 96 | 1267 | bc | 109 | Nicotinic acid | 78, 106, 51, 137 | 1137 | 78, 51, 106, 123, 151 | 1218 | bc |
| 37_2 | Citraconic acid (s) | 127, 59, 99, 69, 53 | 1089 | 113, 85, 141, 157, 171 | 1237 | 110 | N-Methylnicotinamide* | 78, 51, 106, 135, 136 | 1458 | 78, 51, 106, 135, 136 | 1478 | b | |
| 38 | Citramalic acid | 43, 85, 117, 59, 75 | 1111 | 131, 43, 85, 103, 58 | 1252 | abc | 111 | Nonadecanoic acid | 74, 87, 55, 143, 312 | 2224 | 88, 101, 157, 115, 326 | 2333 | acd |
| 39_1 | Citric acid (m) | 143, 101, 59, 43, 175 | 1485 | 112, 84, 139, 167, 212 | 1639 | abcd | 112 | Norvaline | 88, 130, 55, 98, 115 | 1310 | 144, 55, 72, 98, 129 | 1450 | cd |
| 39_2 | Citric acid (s) | 59, 101, 143, 69, 126 | 1384 | 57, 71, 115, 157, 85 | 1511 | 113 | Oleic acid | 55, 74, 83, 97, 296 | 2106 | 55, 69, 88, 96, 111 | 2163 | abcd | |
| 40_1 | D-2-Hydroxyglutaric acid (m) | 85, 57, 69, 144 | 1243 | 85, 57, 159, 101 | 1311 | bc | 114_1 | Ornithine (m) | 128, 59, 88, 115, 198 | 1913 | 142, 70, 56, 96, 212 | 2093 | abc |
| 40_2 | D-2-Hydroxyglutaric acid (s) | 71, 59, 99, 131, 175 | 1504 | 85, 131, 159, 57, 203 | 1683 | 114_2 | Ornithine (s) | 128, 59, 139, 70, 96 | 1651 | 142, 70, 56, 113, 129 | 1761 | ||
| 41 | Docosahexaenoic acid | 79, 91, 67, 55, 105 | 2488 | 79, 91, 41, 67, 55 | 2544 | 115 | Ortho-Hydroxyphenylacetic acid | 91, 121, 78, 133, 148 | 1587 | 106, 134, 78, 180, 208 | 1706 | b | |
| 42 | Docosapentaenoic acid | 55, 67, 79, 91, 105 | 2468 | 79, 91, 67, 55, 105 | 2529 | ac | 116_1 | Oxoglutaric acid (m) | 115, 55, 59, 87, 130 | 1272 | 101, 129, 55, 73, 158 | 1390 | abc |
| 43 | Docosatrienoic acid | 55, 67, 79, 95, 108 | 2523 | 79, 67, 55, 95, 108 | 2585 | ac | 116_2 | Oxoglutaric acid (s) | 115, 55, 59, 87, 143 | 1229 | 101, 129, 55, 73, 157 | 1379 | |
| 44 | Dodecanoic acid | 74, 87, 43, 55, 101 | 1538 | 88, 41, 55, 73, 101 | 1603 | abcd | 117 | Palmitic acid | 74, 87, 43, 55, 101 | 1919 | 88, 43, 101, 55, 73 | 1982 | abcd |
| 45 | Dopamine | 117, 201, 164, 166, 94 | 1074 | 117, 94, 201, 166, 129 | 1093 | abcd | 118 | Palmitoleic acid | 55, 41, 69, 74, 87 | 1905 | 55, 41, 69, 88, 236 | 1963 | abcd |
| 46 | Eicosapentaenoic acid | 55, 67, 79, 91, 105 | 2273 | 79, 67, 91, 55, 105 | 2355 | abc | 119 | p-Cresol | 77, 107, 121, 166, 91 | 1263 | 108, 77, 91, 180, 135 | 1366 | c |
| 47 | Eicosatrienoic acid | 55, 67, 79, 93, 107 | 2302 | 67, 79, 55, 93, 107 | 2367 | abc | 120 | Pelargonic acid | 74, 87, 43, 55, 101 | 1224 | 88, 41, 55, 73, 101 | 1299 | abcd |
| 48 | Eicosenoic acid | 55, 69, 79, 97, 111 | 2323 | 55, 69, 83, 97, 111 | 2386 | abc | 121 | Pentadecanoic acid | 74, 87, 43, 55, 213 | 1824 | 88, 41, 55, 73, 101 | 1884 | ac |
| 49 | Epinephrine | 117, 201, 166, 164, 94 | 1074 | 117, 94, 201, 166, 129 | 1093 | 122 | Phenol | 65, 78, 152, 108, 93 | 1146 | 94, 66, 77, 166, 121 | 1245 | abcd | |
| 50 | Erucic acid | 55, 41, 69, 74, 83 | 2534 | 97, 55, 69, 83, 320 | 2605 | abc | 123 | Phenylacetic acid | 91, 65, 150, 51, 119 | 1181 | 91, 65, 164, 51, 119 | 1251 | abc |
| 51 | Ethylmethylacetic acid | 88, 57, 41, 101, 69 | 800 | 57, 74, 85, 102, 115 | 876 | abcd | 124 | Phenylethylamine | 91, 65, 147, 104, 179 | 1521 | 91, 102, 65, 147, 193 | 1588 | d |
| 52 | Fumaric acid | 59, 85, 54, 114, 144 | 1020 | 99, 127, 55, 71, 82 | 1181 | abc | 125_1 | Phenyllactic acid (m) | 91, 131, 162, 59, 103 | 1636 | 131, 91, 103, 148, 176 | 1768 | abc |
| 53 | Gamma-Aminobutyric acid | 102, 59, 88, 112, 143 | 1362 | 116, 56, 84, 69, 130 | 1504 | abcd | 125_2 | Phenyllactic acid (s) | 91, 65, 162, 103, 77 | 1393 | 131, 91, 162, 103, 121 | 1709 | |
| 54 | Glutaric acid | 59, 100, 129, 42, 55 | 1132 | 87, 42, 115, 143, 55 | 1284 | bc | 126 | Phenylpyruvic acid | 59, 90, 121, 75, 105 | 1735 | 118, 90, 192, 63, 147 | 1878 | |
| 55 | Glutathione | 142, 98, 70, 82, 59 | 1576 | 84, 128, 56, 156, 202 | 1770 | abc | 127_1 | p-Hydroxyphenylacetic acid (m) | 121, 59, 78, 91, 224 | 1673 | 107, 77, 135, 180, 252 | 1809 | abcd |
| 56_1 | Glyceric acid (m) | 43, 59, 87, 69, 102 | 1238 | 61, 91, 133, 105, 116 | 1653 | abc | 127_2 | p-Hydroxyphenylacetic acid (s) | 121, 149, 65, 138, 93 | 1488 | 107, 77, 135, 166, 238 | 1747 | |
| 56_2 | Glyceric acid (s) | 59, 91, 75, 103, 133 | 1463 | 61, 91, 133, 161, 205 | 1343 | 128 | Pimelic acid | 55, 74, 115, 43, 69 | 1357 | 101, 55, 69, 129, 171 | 1500 | bc | |
| 57 | Glycine | 88, 115, 147, 44, 59 | 1128 | 102, 56, 74, 130, 175 | 1287 | abc | 129 | Pipecolic acid | 91, 174, 218, 65, 142 | 2099 | 91, 174, 218, 65, 156 | 2203 | b |
| 58 | Glycolic acid | 45, 59, 74, 117, 89 | 1002 | 103, 45, 59, 76, 131 | 1147 | abc | 130 | Propionic acid | 57, 88, 42 | 649 | 57, 74, 45, 102, 84 | 696 | abc |
| 59 | Heptadecanoic acid | 74, 87, 43, 55, 241 | 2021 | 88, 41, 101, 55, 73 | 2083 | acd | 131_1 | Purine (m) | 120, 133, 178, 80, 93 | 1548 | 120, 93, 148, 192, 66 | 1613 | d |
| 60 | Heptanoic acid | 74, 43, 55, 87, 101 | 1020 | 88, 43, 60, 73, 101 | 1091 | abc | 131_2 | Purine (s) | 178, 59, 65, 80, 107 | 1720 | 120, 192, 93, 66, 133 | 1810 | |
| 61_1 | Hippuric acid (m) | 105, 77, 51, 134, 161 | 1713 | 105, 77, 51, 134, 161 | 1781 | abcd | 132 | Putrescine | 88, 56, 44, 69, 128 | 1442 | 142, 102, 56, 70, 186 | 1856 | ac |
| 61_2 | Hippuric acid (s) | 105, 77, 51, 136, 92 | 1092 | 105, 77, 51, 122, 150 | 1171 | 133 | Pyroglutamic acid | 84, 41, 56, 143 | 1393 | 84, 41, 56, 157 | 1466 | bc | |
| 62_1 | Homocysteine (m) | 59, 82, 115, 174, 142 | 1612 | 128, 56, 175, 234, 102 | 2032 | 134 | Pyruvic acid | 43, 89, 117, 57, 75 | 954 | 84, 56, 128, 173, 156 | 1963 | ||
| 62_2 | Homocysteine (s) | 59, 114, 82, 174, 147 | 1824 | 133, 56, 161, 88, 115 | 1599 | 135_1 | Salicyluric acid (m) | 120, 92, 176, 235, 204 | 1898 | 120, 92, 176, 249, 204 | 1958 | abd | |
| 63 | Homogentisic acid | 117, 94, 166, 201, 82 | 2010 | 117, 94, 201, 82, 166 | 1093 | abc | 135_2 | Salicyluric acid (s) | 44, 120, 56, 92, 77 | 2092 | 120, 92, 149, 193, 295 | 2272 | |
| 64 | Hydrocinnamic acid | 91, 104, 164, 51, 77 | 1288 | 91, 104, 77, 51, 178 | 1365 | abc | 136 | Serotonin | 204, 117, 145, 260, 90 | 2438 | 146, 159, 218, 174, 231 | 2909 | |
| 65 | Hydroxyphenyllactic acid | 59, 121, 161, 77, 236 | 2090 | 192, 107, 120, 147, 264 | 2327 | b | 137 | Stearic acid | 74, 87, 43, 55, 101 | 2123 | 88, 41, 101, 55, 73 | 2188 | abc |
| 66 | Hydroxypropionic acid | 45, 58, 71, 88, 103 | 1314 | 45, 87, 117, 102, 71 | 935 | d | 138 | Suberic acid | 55, 74, 97, 69, 138 | 1464 | 55, 69, 83, 139, 185 | 1598 | bcd |
| 67 | Indole* | 90, 117, 63, 50, 74 | 1311 | 117, 90, 63, 50, 74 | 1328 | c | 139 | Succinic acid | 55, 59, 87, 45, 116 | 1029 | 101, 55, 73, 129, 45 | 1175 | abc |
| 68 | Indoleacetic acid | 130, 189, 77, 103, 51 | 1839 | 130, 77, 103, 203, 51 | 1898 | abc | 140_1 | Tartaric acid (m) | 59, 85, 44, 115, 159 | 1689 | 115, 88, 71, 63, 131 | 1909 | abc |
| 69 | Indoleacrylic acid | 170, 143, 115, 215, 63 | 2213 | 170, 143, 115, 215, 89 | 2343 | d | 140_2 | Tartaric acid (s) | 59, 101, 145, 69, 85 | 1454 | 115, 133, 88, 105, 160 | 1061 | |
| 70 | Isobutyric acid | 43, 59, 71, 87, 102 | 680 | 71, 43, 88, 116, 101 | 809 | abc | 141 | Tetracosanoic acid | 74, 87, 43, 55, 339 | 2751 | 88, 43, 101, 55, 73 | 2804 | ac |
| 71 | Isocaproic acid | 74, 43, 55, 88, 101 | 905 | 88, 43, 101, 55, 73 | 969 | bc | 142 | trans-Cinnamic acid | 131, 103, 162, 77, 51 | 1409 | 131, 103, 77, 176, 147 | 1503 | abcd |
| 72_1 | Isocitric acid (m) | 115, 55, 143, 83, 99 | 1515 | 101, 129, 55, 157, 85 | 1636 | abcd | 143 | Tryptamine | 130, 143, 218, 103, 77 | 2185 | 130, 143, 232, 103, 77 | 2293 | abcd |
| 72_2 | Isocitric acid (s) | 59, 129, 75, 101, 157 | 1725 | 129, 157, 101, 55, 185 | 1941 | 144 | Valeric acid | 74, 43, 57, 87, 101 | 842 | 73, 41, 57, 88, 60 | 914 | ac | |
| 73 | Isovaleric acid | 74, 43, 59, 101, 85 | 797 | 88, 60, 70, 41, 115 | 878 | abc | 145 | Vanillic acid | 165, 59, 79, 121, 196 | 1759 | 151, 168, 123, 196, 268 | 1898 | bc |
| 74_1 | Itaconic acid (m) | 59, 69, 99, 127, 113 | 1092 | 113, 86, 141, 68, 157 | 1230 | bc | |||||||
| 74_2 | Itaconic acid (s) | 157, 59, 125, 98, 113 | 1387 | 90, 117, 189, 63, 133 | 1661 | ||||||||
Note: a–c, compounds identified in human serum (a), urine (b), feces (c) samples by two independent parameters of MS and Kovats-RI; d, compounds identified in intracellular extract of E. coli. m: main peak; s: secondary peak.
These compounds cannot derivatize with MCF/ECF and elute as prototype.
The top 5 ions for each compound were ordered by the decreasing intensity.
Figure 1.

(A) Pie chart showing chemical classification of the covering 145 compounds in author-constructed MCF & ECF derivatives library. (B) Venn diagram of a subset of 125 metabolites identified in human samples, including 92 in serum, 103 in urine, and 118 in feces. A total of 61% of the compounds were identified in all three body fluids, 29% were detected in two fluids, and 10 % were unique for a specific fluid. Among them, a total of 47 metabolites were also identified in E. coli cell, as the numbers in parenthesis shown.
Reaction scheme was illustrated using a representative compound of tyrosine, which simultaneously contains amine (-NH2), carboxyl (-COOH) and hydroxy (-OH) functional groups (Figure S1). Other compounds in Table 1, when treated with alkyl chloroformate, would react in the same way. The paired MCF/ECF derivatives for each compound have similar fragmentation patterns but slightly different RI, i.e., MCF derivatives with greater volatility had shorter chromatographic retention time than ECF derivatives. Figure S2 illustrated the identification process by interpretation of possible fragmentation mechanism and comparison of RIs of MCF/ECF derivatives for p-hydroxyphenylacetic acid, a microbial metabolite important for tyrosine metabolism. Different from the common methods that just rely on the similarity analysis of comparison with reference library, our library made it possible to mutually authenticate the fragmentation patterns and RIs between MCF/ECF derivatives, which greatly increased the accuracy of compound identification in biological samples. Moreover, the accumulation of fragmentation mechanisms provides information that may be used to solve structure problems for unknown metabolites that have no available authentic standards but have similar chemical structures to known metabolites.
Microbial metabolites identified in human and microbial samples
Based on our library of MCF and ECF derivatives, a subset of 125 metabolites were identified in human samples, including 92 metabolites in serum, 103 in urine, and 118 in feces samples (Figure 1B). A total of 61% of the compounds were identified in all three body fluids, such as 3-(3-hydroxyphenyl)-3-hydroxypropanoic acid, 3-hydroxyphenylacetic acid, 4-hydroxybenzoic acid, butyric acid, hippuric acid, phenylacetic acid, etc. A total of 29% were detected in two fluids (ie., 3-indolepropionic acid, 4-hydroxycinnamic acid, 4-hydroxyphenylpyruvic acid, putrescine, salicyluric acid, vanillic acid, etc.), and 10 % were unique for a specific fluid (ie., indole, cresol, pipecolic acid, ortho-hydroxyphenylacetic acid, N-methylnicotinamide, hydroxyphenyllactic acid, etc.).
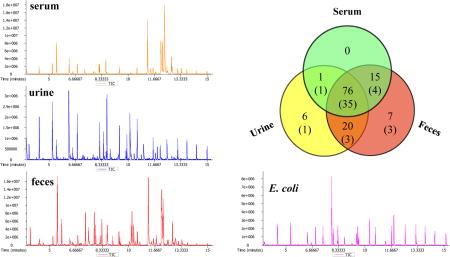
E. coli strains are commonly present in human gut microbiota and the species has been the most widely studied prokaryotic model organism in microbiological research33. In this study, E. coli was used as a model to validate the microbial metabolites that were identified from human biospecimens. A total of 52 metabolites were detected in E. coli cells cultured in vitro, and 47 of them (90%) were found to overlap with human samples (Figure 1B). The total ion current (TIC) chromatograms of representative human and microbial samples, standards mixture and internal RI markers are illustrated in Figure 2.
Figure 2.

GC/TOFMS total ion current (TIC) chromatograms of MCF derivatives in human serum, urine and feces samples, a sample of intracellular metabolites extracted from E. coli cell, a mixture of reference standards, and a mixture of 13 alkanes (C8-C30) which act as internal RI markers for the conversion of retention times to classic Kovats RI.
Optimization of sample preparation and GC separation
Given that the influences of solvent-to-catalyst ratio, reaction temperature, reaction time and pH on derivatization efficiencies have been thoroughly studied in many previous publications22,26, the focus of this work was to develop a fast, sensitive and reliable approach for high-throughput and large-scale microbiome metabolomics research. In our pilot study, methyl- and ethyl-chloroformate both yielded satisfactory derivatization efficiency in standard mixtures and biological samples (Figure S3). Therefore, for this current protocol, we chose MCF derivatization and performed the following optimization experiments.
Determination of the appropriate sampling amount range
Appropriate sampling amount helps to avoid GC column overloading and mass detector oversaturation and therefore improves the accuracy of relative quantification protocols. We examined the linear correlation of mass intensities of a wide range of volume/weight ratios for urine and feces samples. Table S2 shows that the majority of metabolites exhibited a good correlation coefficient (greater than 0.9900) within an appropriate range of sample loading. In this work, the optimal column loading volume of urine and lyophilized weight of feces was 100 µL and 10 mg, respectively.
Influence of the lyophilization process on metabolite analysis in urine and cell samples
Dehydration of samples via lyophilization has only recently been introduced for use in metabolomics studies26,27. Lyophilization is an easy and safe way to effectively concentrate samples making it a very useful tool for metabolite profiling. However, the influence of the lyophilization process on the physical integrity of metabolites isolated from biological fluids and cells has not been completely studied. In this work, we compared the number of identified metabolites and their peak abundance, using fresh and lyophilized urine and E. coli cell samples. We found that the lyophilization process produced stronger signal intensities for most of metabolites identified in urine and cell samples, and as a result, a greater number of metabolites were identified with lyophilization compared to the procedure without lyophilization (data not shown). A possible explanation for this is that lyophilization increased compound solubility in the medium of derivatization, and thus, reduced the loss of volatile compounds.
Combination of preprocessing and derivatization of fecal samples
Human fecal samples, especially the aqueous extract, have recently received attention due to increased interest in exploring the relationships between symbiotic gut microflora and human health. In many previous studies34, before being subject to derivatization, homogenization in water without pH adjustment was commonly applied in the preparation of fecal water. The protocol for MCF derivatization employed in our experiments allowed us to develop a simplified procedure that combined two steps, the preprocessing and derivatization of fecal samples as one. This combination processing protocol makes it more amenable for large-scale sample analyses that are common in metabolomics studies. We also did a comparison experiment of the one-step extraction with sodium hydroxide solution and the two-step extraction using sodium hydroxide solution followed by methanol (based on optimized ratio for MCF derivatization26), with the aim of increasing the extraction efficiency. Results showed that, compared to the one-step extraction, the two-step method improved the relative extraction efficiency of some metabolites, especially the medium and long-chain fatty acids (Figure S4).
Optimization of GC separation parameters
Large-scale metabolomics studies often have problems with large analytical variations over a long time due to the large sample size, but a fast analysis method can help to reduce this effect. In order to achieve the separation of as many metabolites in as short a run time as possible, programmed temperature parameters in GC were optimized, as shown in Table S3. In condition 1 which has a single run time of 28.85 min and only one stage of temperature raise, we found that a majority of compounds in Table 1 mainly distributed before 20 min, and only a small number of metabolites appeared after 20 min. So we changed the temperature gradient program from one-stage to two-stage, and compared the separation efficiencies of three temperature gradient rates in the first stage (condition 2, 3 and 4). Results showed that when the temperature gradient was increased from 10 °C/min to 20 °C/min, more metabolites were detected in both pooled serum and urine samples, with higher peak height, smaller peak width at half height (PWH) and higher peak purity (PP). As a consequence, condition 4 was chosen as the optimal analysis condition and the analysis time of a single run was reduced to 15.25 min from 28.85 min. (Table S3).
There is increasing interest in using short-chain fatty acids (SCFA) as biomarkers to study the relationship between gut microbial activity and the host’s health status, particular in the area of obesity and metabolic disorder35. Therefore, a reliable method for the accurate separation and measurement of SCFA has gained importance. In this study the separation and identification of 12 SCFAs was achieved with good separation in less than 3 minutes (Figure S5), a superior result compared to our previously reported method25.
Method Validation
Linearity and quantification limits
The linearity of response was determined by linear regression modeling according to a series of standards at different concentrations in solvent (Table S4). The correlation coefficient (R2) value was greater than 0.9900 for most of compounds investigated with the ability to detect a wide concentration range. To be noted, some compounds such as 3-hydroxybutyric acid, 3-indolepropionic acid, 4-hydroxyphenylpyruvic acid, 5-hydroxy-L-tryptophan, etc., could not be detected at lower concentrations due to the detection limit, and some compounds such as hydrocinnamic acid, L-phenylalanine, L-glutamic acid, L-cysteine, etc., had quadratic regression at higher concentrations. Thus, these compounds were not reported in the result. Additionally, the quantification limit of each compound was determined by analyzing the signal-to-noise ratio (S/N) provided by ChromaTOF software.
Reproducibility of results
The reproducibility of the automated derivatization technique and the GC/TOFMS analysis were investigated by using both the standard mixtures and biological samples. Six independently prepared standard mixtures and samples were analyzed by successive replicate measurements, respectively. As showed in Table S4, most of the test compounds and metabolites identified in human serum, urine and fecal samples exhibited acceptable reproducibility with relative standard deviations (RSDs) smaller than 15%, excepting some compounds whose concentrations were close to the quantification detection limit.
Stability
The stability of derivatized analytes under different storage conditions was evaluated using human serum, urine and fecal samples. Samples, after automated derivatization, were separated into four aliquots and stored under four different sets of conditions including room temperature, 4 °C, −20 °C, and −80 °C, each for 0, 1, 2, 3, 4 and 6 days. The analysis error due to drift of instrument detector responses over long time periods were corrected using internal RI standards. Results indicated that better stability could be achieved under lower temperature (data not shown). Nearly 80% of the derivatized metabolites showed acceptable stability with RSD% less than 20% within 6 days when stored at −80 °C, in all of three different biological sample types (Table S5).
Application
Finally, we applied our method to comprehensively analyze 76 paired human serum, urine and fecal samples and E. coli BL 21 cellular extracts as well. Each of three kinds of human samples was derivatized using automation and analyzed in 5 batches. During each batch, there was a quality control (QC) sample for every 17 study samples. We assessed the variability of the derivatization and instrument analysis across batches using QC samples, which were either commercially obtained or self-prepared using pooled samples from volunteers. As shown in the PCA scores plots (Figure 3), the QC samples were clustered closely relative to the rest of serum, urine and fecal samples, indicating the good reproducibility of our method. Table 2 shows the quantification results of over one hundred compounds in human and E. coli cell samples. Only those metabolites that were identified in over 80% of the human samples were included and quantified. This big panel of human and gut microbiota co-metabolites, particularly those metabolites that were simultaneously identified in multiple matrices, are likely to be of great importance in exploring host-gut microbiota metabolic interactions.
Figure 3.

PCA scores plots of 76 human serum (yellow circle), urine (blue circle) and feces samples (green circle) and their 5 QC samples that were either purchased commercially or collected from volunteers (red circle). (A) R2X=0.504, two principal components; (B) R2X=0.479, two principal components; and (C) R2X=0.267, two principal components.
Table 2.
Quantification results in human serum, urine, feces and E. coli cell samples (Median ± SE).
| Compounds | Concentrations | Compounds | Concentrations | ||||||
|---|---|---|---|---|---|---|---|---|---|
|
|
|
||||||||
| human serum (µg/mL) |
human urine (µg/mL) |
human feces (µg/10 mg) |
E. Coli cell (µg/1×107 cells) |
human serum (µg/mL) |
human urine (µg/mL) |
human feces (µg/10 mg) |
E. Coli cell (µg/1×107 cells) |
||
| 2-Hydroxybutyric acid | 3.71 ± 0.22 | 0.19 ± 0.11 | 0.11 ± 0.01 | L-2-Hydroxyglutaric acid | 7.32 ± 0.43 | 0.83 ± 0.08 | |||
| 3-(3-Hydroxyphenyl)-3-hydroxypropanoic acid | 0.32 ± 0.28 | L-Alanine | 23.15 ± 1.00 | 13.90 ± 1.41 | 1.59 ± 0.20 | 1.51 ± 0.27 | |||
| 3-Aminoisobutanoic acid | 3.91 ± 2.20 | L-Alpha-aminobutyric acid | 1.25 ± 0.05 | 0.70 ± 0.04 | 0.10 ± 0.05 | ||||
| 3-Hydroxyisovaleric acid | 5.07 ± 0.53 | 0.20 ± 0.01 | L-Asparagine | 10.15 ± 0.36 | 13.11 ± 0.57 | 1.02 ± 0.1 | |||
| 3-Hydroxyphenylacetic acid | 1.22 ± 0.35 | 0.26 ± 0.16 | L-Aspartic acid | 2.28 ± 0.03 | 3.13 ± 0.18 | 0.78 ± 0.11 | |||
| 3-Indolepropionic acid | 3.17 ± 0.19 | L-Cysteine | 1.35 ± 0.05 | 4.55 ± 0.32 | 0.07 ± 0.20 | 0.04 ± 0.004 | |||
| 3-Methyl-2-oxovaleric acid | 23.78 ± 0.93 | 10.90 ± 0.16 | 1.12 ± 0.02 | 1.07 ± 0.01 | L-Glutamic acid | 10.6 ± 0.76 | 6.85 ± 0.51 | 67.69 ± 4.38 | 6.21 ± 0.94 |
| 3-Methylpentanoic acid | 0.04 ± 0.02 | L-Histidine | 63.24 ± 7.45 | 0.69 ± 0.14 | 0.78 ± 0.05 | ||||
| 4-Hydroxybenzoic acid | 0.60 ± 0.05 | 0.17 ± 0.03 | Linoleic acid | 810.87 ± 35.01 | 27.15 ± 4.35 | 0.11 ± 0.003 | |||
| 4-Hydroxycinnamic acid | 3.40 ± 0.45 | 3.09 ± 0.76 | L-Isoleucine | 5.47 ± 0.28 | 0.90 ± 0.05 | 0.52 ± 0.11 | 5.98 ± 1.06 | ||
| Adipic acid | 4.99 ± 0.68 | 0.40 ± 0.16 | L-Leucine | 11.64 ± 0.64 | 1.65 ± 0.12 | 0.82 ± 0.21 | 4.91 ± 0.87 | ||
| Alpha-Hydroxyisobutyric acid | 3.84 ± 0.24 | L-Lysine | 17.79 ± 0.75 | 13.48 ± 1.89 | 7.56 ± 0.64 | 5.59 ± 1.08 | |||
| Alpha-Linolenic acid | 133.05 ± 5.73 | 5.27 ± 1.31 | L-Methionine | 2.03 ± 0.08 | 0.68 ± 0.02 | 0.37 ± 0.05 | 0.53 ± 0.08 | ||
| Aminoadipic acid | 9.83 ± 1.12 | 0.57 ± 0.13 | L-Norleucine | 3.46 ± 0.57 | |||||
| Arachidic acid | 0.21 ± 0.02 | 1.56 ± 0.56 | L-Phenylalanine | 7.32 ± 0.26 | 5.21 ± 0.50 | 0.68 ± 0.22 | 2.86 ± 0.61 | ||
| Arachidonic acid | 78.26 ± 3.79 | 5.60 ± 2.45 | L-Proline | 16.6 ± 0.75 | 0.62 ± 0.03 | 0.63 ± 0.05 | 0.40 ± 0.06 | ||
| Behenic acid | 0.66 ± 0.17 | L-Tryptophan | 17.01 ± 0.37 | 15.33 ± 0.39 | 1.42 ± 0.05 | 1.56 ± 0.08 | |||
| Beta-Alanine | 5.32 ± 0.32 | 0.85 ± 0.05 | L-Tyrosine | 20.57 ± 0.94 | 12.39 ± 1.76 | 2.17 ± 0.35 | 1.09 ± 0.16 | ||
| Butyric acid | 0.35 ± 0.03 | 122.52 ± 18.54 | 0.03 ± 0.003 | L-Valine | 17.89 ± 0.71 | 2.16 ± 0.14 | 0.62 ± 0.16 | 1.55 ± 0.26 | |
| Capric acid | 0.25 ± 0.02 | 0.07 ± 0.15 | Malic acid | 0.18 ± 0.05 | 1.36 ± 0.09 | 0.05 ± 0.01 | |||
| Caproic acid | 0.34 ± 0.31 | Malonic acid | 0.87 ± 0.04 | 0.24 ± 0.03 | |||||
| Caprylic acid | 0.28 ± 0.02 | 0.07 ± 0.02 | m-Cresol | 2.10 ± 0.18 | |||||
| cis-Aconitic acid | 1.98 ± 0.08 | 65.85 ± 5.63 | 0.17 ± 0.01 | Methylsuccinic acid | 0.95 ± 0.05 | 0.32 ± 0.06 | |||
| Citraconic acid | 1.66 ± 0.02 | 0.17 ± 0.004 | Myristic acid | 1.04 ± 0.51 | |||||
| Citramalic acid | 13.62 ± 0.76 | 0.72 ± 0.02 | Nervonic acid | 0.35 ± 0.04 | |||||
| Citric acid | 39.14 ± 2.19 | 915.84 ± 76.1 | 2.41 ± 0.16 | 0.45 ± 0.01 | Nicotinic acid | 2.61 ± 0.01 | 0.67 ± 0.16 | ||
| Docosapentaenoic acid | 3.22 ± 2.44 | 0.68 ± 0.33 | Nonadecanoic acid | 0.10 ± 0.01 | |||||
| Docosatrienoic acid | 14.32 ± 0.68 | 0.27 ± 0.07 | Norvaline | 0.33 ± 0.04 | 4.02 ± 0.65 | ||||
| Dodecanoic acid | 0.28 ± 0.02 | 0.25 ± 0.02 | 0.22 ± 0.13 | 0.02 ± 0 | Oleic acid | 400.44 ± 13.75 | 38.04 ± 4.54 | 0.23 ± 0.01 | |
| Dopamine | 13.17 ± 0.33 | 15.81 ± 1.66 | 6.27 ± 0.16 | 0.97 ± 0.04 | Ornithine | 5.72 ± 0.16 | 1.28 ± 0.17 | ||
| Eicosapentaenoic acid | 393.26 ± 17.83 | 6.81 ± 2.29 | Ortho-Hydroxyphenylacetic acid | 0.89 ± 0.04 | |||||
| Eicosatrienoic acid | 40.9 ± 3.25 | 3.08 ± 1.32 | Oxoglutaric acid | 2.76 ± 3.17 | 6.46 ± 0.50 | 0.19 ± 0.06 | 1.43 ± 0.74 | ||
| Eicosenoic acid | 5.35 ± 2.00 | 1.06 ± 0.30 | Palmitic acid | 167.74 ± 4.88 | 19.91 ± 1.53 | 0.24 ± 0.02 | |||
| Erucic acid | 0.57 ± 0.29 | Palmitoleic acid | 12.23 ± 1.04 | 2.05 ± 0.15 | |||||
| Ethylmethylacetic acid | 0.26 ± 0.01 | 1.75 ± 0.10 | 0.02 ± 0 | p-Cresol | 1.32 ± 0.11 | ||||
| Fumaric acid | 1.57 ± 0.03 | Pelargonic acid | 0.39 ± 0.01 | 0.044 ± 0.002 | |||||
| Gamma-Aminobutyric acid | 6.01 ± 0.05 | 1.22 ± 0.08 | 3.88 ± 0.48 | Pentadecanoic acid | 0.76 ± 0.02 | 1.12 ± 0.14 | 0.03 ± 0 | ||
| Glutaric acid | 2.51 ± 0.20 | 1.70 ± 0.24 | Phenol | 0.28 ± 0.001 | 0.07 ± 0.03 | ||||
| Glyceric acid | 37.68 ± 14.81 | 4.32 ± 0.34 | Phenylacetic acid | 1.58 ± 0.16 | 2.06 ± 0.16 | ||||
| Glycine | 11.54 ± 0.93 | 51.66 ± 3.94 | 1.16 ± 0.18 | p-Hydroxyphenylacetic acid or 3-Indoleacetonitrile | 4.33 ± 0.72 | 0.10 ± 0.06 | |||
| Glycolic acid | 21.27 ± 2.64 | 2.03 ± 0.81 | Pimelic acid | 2.88 ± 0.12 | 0.31 ± 0.01 | ||||
| Heptadecanoic acid | 1.72 ± 0.06 | 0.62 ± 0.07 | Propionic acid | 10.98 ± 1.08 | 0.002 ± 0.001 | ||||
| Heptanoic acid | 0.05 ± 0.08 | Putrescine | 0.74 ± 0.27 | ||||||
| Hippuric acid | 218.77 ± 35.78 | Pyroglutamic acid | 33.68 ± 0.65 | ||||||
| Hydrocinnamic acid | 0.71 ± 0.19 | Salicyluric acid | 2.67 ± 0.35 | ||||||
| Indole | 0.67 ± 0.03 | Stearic acid | 125.55 ± 4.12 | 24.24 ± 1.87 | |||||
| Indoleacetic acid | 25.72 ± 1.65 | 1.56 ± 0.08 | Suberic acid | 12.39 ± 0.33 | 1.25 ± 0.08 | ||||
| Isobutyric acid | 0.002 ± 0.001 | 0.20 ± 0.03 | 1.87 ± 0.13 | 0.02 ± 0.002 | Succinic acid | 12.42 ± 1.83 | 3.80 ± 1.86 | 0.14 ± 0.07 | |
| Isocaproic acid | 0.08 ± 0.04 | Tartaric acid | 10.71 ± 17.06 | ||||||
| Isocitric acid | 160.52 ± 15.64 | 0.64 ± 0.04 | Tetracosanoic acid | 0.37 ± 0.04 | |||||
| Isovaleric acid | 0.21 ± 0.01 | 2.26 ± 0.14 | 0.02 ± 0.001 | Valeric acid | 3.90 ± 0.30 | ||||
| Itaconic acid | 6.11 ± 0.27 | 0.31 ± 0.01 | Vanillic acid | 1.73 ± 0.26 | 0.18 ± 0.07 | ||||
CONCLUSION
In this work, we developed an automated high-throughput sample derivatization and analysis method for the simultaneous identification of 92, 103, 118 and 52 microbial metabolites in human serum, urine, feces and E. coli cell samples, respectively, in a single run analysis of ~15 minutes. A combined MS/RI library of MCF and ECF derivatives from 145 structurally diverse compounds was constructed to aid in metabolite identification. The identified metabolites participate in multiple metabolic pathways related to host-gut microbiota co-metabolism. Our proposed method exhibited good linearity, reproducibility and stability. This method has potential as a powerful tool for quantitative microbiome metabolomics studies.
Supplementary Material
Acknowledgments
This work was financially supported by Nestle Institute of Health Sciences Ltd. (007184-00002). Linjing Zhao acknowledges the China Scholarship Council for her visiting scholar grant (201408310049) in University of Hawaii Cancer Center.
Footnotes
Supporting Information Available: Further details are given in the supplemental Figure S1–5 and Table S1–5. This material is available free of charge via the Internet at http://pubs.acs.org.
References
- 1.Turnbaugh PJ, Ley RE, Mahowald MA, Magrini V, Mardis ER, Gordon JI. Nature. 2006;444:1027–1031. doi: 10.1038/nature05414. [DOI] [PubMed] [Google Scholar]
- 2.Gomez-Arango LF, Barrett HL, McIntyre HD, Callaway LK, Morrison M, Dekker Nitert M. Diabetes. 2016;65:2214–2223. doi: 10.2337/db16-0278. [DOI] [PubMed] [Google Scholar]
- 3.Dumas ME, Barton RH, Toye A, Cloarec O, Blancher C, Rothwell A, Fearnside J, Tatoud R, Blanc V, Lindon JC, Mitchell SC, Holmes E, McCarthy MI, Scott J, Gauguier D, Nicholson JK. Proc Natl Acad Sci U S A. 2006;103:12511–12516. doi: 10.1073/pnas.0601056103. [DOI] [PMC free article] [PubMed] [Google Scholar]
- 4.Strober W, Fuss I, Mannon P. J Clin Invest. 2007;117:514–521. doi: 10.1172/JCI30587. [DOI] [PMC free article] [PubMed] [Google Scholar]
- 5.Chu FF, Esworthy RS, Chu PG, Longmate JA, Huycke MM, Wilczynski S, Doroshow JH. Cancer Res. 2004;64:962–968. doi: 10.1158/0008-5472.can-03-2272. [DOI] [PubMed] [Google Scholar]
- 6.Jia W, Li H, Zhao L, Nicholson JK. Nat Rev Drug Discov. 2008;7:123–129. doi: 10.1038/nrd2505. [DOI] [PubMed] [Google Scholar]
- 7.Holmes E, Kinross J, Gibson GR, Burcelin R, Jia W, Pettersson S, Nicholson JK. Sci Transl Med. 2012;4:137rv136. doi: 10.1126/scitranslmed.3004244. [DOI] [PubMed] [Google Scholar]
- 8.Nicholson JK, Holmes E, Kinross J, Burcelin R, Gibson G, Jia W, Pettersson S. Science. 2012;336:1262–1267. doi: 10.1126/science.1223813. [DOI] [PubMed] [Google Scholar]
- 9.Martin FP, Wang Y, Yap IK, Sprenger N, Lindon JC, Rezzi S, Kochhar S, Holmes E, Nicholson JK. J Proteome Res. 2009;8:3464–3474. doi: 10.1021/pr900099x. [DOI] [PubMed] [Google Scholar]
- 10.Samuel BS, Shaito A, Motoike T, Rey FE, Backhed F, Manchester JK, Hammer RE, Williams SC, Crowley J, Yanagisawa M, Gordon JI. Proc Natl Acad Sci U S A. 2008;105:16767–16772. doi: 10.1073/pnas.0808567105. [DOI] [PMC free article] [PubMed] [Google Scholar]
- 11.Neis EP, Dejong CH, Rensen SS. Nutrients. 2015;7:2930–2946. doi: 10.3390/nu7042930. [DOI] [PMC free article] [PubMed] [Google Scholar]
- 12.Zheng X, Xie G, Zhao A, Zhao L, Yao C, Chiu NH, Zhou Z, Bao Y, Jia W, Nicholson JK, Jia W. J Proteome Res. 2011;10:5512–5522. doi: 10.1021/pr2007945. [DOI] [PubMed] [Google Scholar]
- 13.Yokoyama MT, Carlson JR. Am J Clin Nutr. 1979;32:173–178. doi: 10.1093/ajcn/32.1.173. [DOI] [PubMed] [Google Scholar]
- 14.Serino M, Luche E, Gres S, Baylac A, Berge M, Cenac C, Waget A, Klopp P, Iacovoni J, Klopp C, Mariette J, Bouchez O, Lluch J, Ouarne F, Monsan P, Valet P, Roques C, Amar J, Bouloumie A, Theodorou V, Burcelin R. Gut. 2012;61:543–553. doi: 10.1136/gutjnl-2011-301012. [DOI] [PMC free article] [PubMed] [Google Scholar]
- 15.Ridlon JM, Kang DJ, Hylemon PB. J Lipid Res. 2006;47:241–259. doi: 10.1194/jlr.R500013-JLR200. [DOI] [PubMed] [Google Scholar]
- 16.Wang Z, Klipfell E, Bennett BJ, Koeth R, Levison BS, Dugar B, Feldstein AE, Britt EB, Fu X, Chung YM, Wu Y, Schauer P, Smith JD, Allayee H, Tang WH, DiDonato JA, Lusis AJ, Hazen SL. Nature. 2011;472:57–63. doi: 10.1038/nature09922. [DOI] [PMC free article] [PubMed] [Google Scholar]
- 17.Said HM. Biochem J. 2011;437:357–372. doi: 10.1042/BJ20110326. [DOI] [PMC free article] [PubMed] [Google Scholar]
- 18.Hanfrey CC, Pearson BM, Hazeldine S, Lee J, Gaskin DJ, Woster PM, Phillips MA, Michael AJ. J Biol Chem. 2011;286:43301–43312. doi: 10.1074/jbc.M111.307835. [DOI] [PMC free article] [PubMed] [Google Scholar]
- 19.Hou W, Zhong D, Zhang P, Li Y, Lin M, Liu G, Yao M, Liao Q, Xie Z. J Chromatogr A. 2016;1429:207–217. doi: 10.1016/j.chroma.2015.12.031. [DOI] [PubMed] [Google Scholar]
- 20.Husek P. J Chromatogr B Biomed Sci Appl. 1998;717:57–91. [PubMed] [Google Scholar]
- 21.Villas-Boas SG, Smart KF, Sivakumaran S, Lane GA. Metabolites. 2011;1:3–20. doi: 10.3390/metabo1010003. [DOI] [PMC free article] [PubMed] [Google Scholar]
- 22.Qiu Y, Su M, Liu Y, Chen M, Gu J, Zhang J, Jia W. Anal Chim Acta. 2007;583:277–283. doi: 10.1016/j.aca.2006.10.025. [DOI] [PubMed] [Google Scholar]
- 23.Tao X, Liu Y, Wang Y, Qiu Y, Lin J, Zhao A, Su M, Jia W. Anal Bioanal Chem. 2008;391:2881–2889. doi: 10.1007/s00216-008-2220-8. [DOI] [PubMed] [Google Scholar]
- 24.Gao X, Pujos-Guillot E, Martin JF, Galan P, Juste C, Jia W, Sebedio JL. Anal Biochem. 2009;393:163–175. doi: 10.1016/j.ab.2009.06.036. [DOI] [PubMed] [Google Scholar]
- 25.Tan B, Qiu Y, Zou X, Chen T, Xie G, Cheng Y, Dong T, Zhao L, Feng B, Hu X, Xu LX, Zhao A, Zhang M, Cai G, Cai S, Zhou Z, Zheng M, Zhang Y, Jia W. J Proteome Res. 2013;12:3000–3009. doi: 10.1021/pr400337b. [DOI] [PMC free article] [PubMed] [Google Scholar]
- 26.Villas-Boas SG, Delicado DG, Akesson M, Nielsen J. Anal Biochem. 2003;322:134–138. doi: 10.1016/j.ab.2003.07.018. [DOI] [PubMed] [Google Scholar]
- 27.Smart KF, Aggio RB, Van Houtte JR, Villas-Boas SG. Nat Protoc. 2010;5:1709–1729. doi: 10.1038/nprot.2010.108. [DOI] [PubMed] [Google Scholar]
- 28.Kvitvang HF, Andreassen T, Adam T, Villas-Boas SG, Bruheim P. Anal Chem. 2011;83:2705–2711. doi: 10.1021/ac103245b. [DOI] [PubMed] [Google Scholar]
- 29.Husek P. J Chromatogr B Biomed Appl. 1995;669:352–357. doi: 10.1016/0378-4347(95)00115-y. [DOI] [PubMed] [Google Scholar]
- 30.Citova I, Sladkovsky R, Solich P. Anal Chim Acta. 2006;573–574:231–241. doi: 10.1016/j.aca.2006.04.077. [DOI] [PubMed] [Google Scholar]
- 31.Winder CL, Dunn WB, Schuler S, Broadhurst D, Jarvis R, Stephens GM, Goodacre R. Anal Chem. 2008;80:2939–2948. doi: 10.1021/ac7023409. [DOI] [PubMed] [Google Scholar]
- 32.Kind T, Wohlgemuth G, Lee DY, Lu Y, Palazoglu M, Shahbaz S, Fiehn O. Anal Chem. 2009;81:10038–10048. doi: 10.1021/ac9019522. [DOI] [PMC free article] [PubMed] [Google Scholar]
- 33.Tenaillon O, Skurnik D, Picard B, Denamur E. Nat Rev Microbiol. 2010;8:207–217. doi: 10.1038/nrmicro2298. [DOI] [PubMed] [Google Scholar]
- 34.Gao X, Pujos-Guillot E, Sebedio JL. Anal Chem. 2010;82:6447–6456. doi: 10.1021/ac1006552. [DOI] [PubMed] [Google Scholar]
- 35.Salazar N, Dewulf EM, Neyrinck AM, Bindels LB, Cani PD, Mahillon J, de Vos WM, Thissen JP, Gueimonde M, de Los Reyes-Gavilan CG, Delzenne NM. Clin Nutr. 2015;34:501–507. doi: 10.1016/j.clnu.2014.06.001. [DOI] [PubMed] [Google Scholar]
Associated Data
This section collects any data citations, data availability statements, or supplementary materials included in this article.