Abstract
Super-resolution (SR) fluorescence microscopy, a class of optical microscopy techniques at a spatial resolution below the diffraction limit, has revolutionized the way we study biology, as recognized by Nobel Prize in Chemistry in 2014. Stochastic optical reconstruction microscopy (STORM), a widely used SR technique, is based on the principle of single molecule localization. STORM routinely achieves a spatial resolution of 20–30 nm, a ten-fold improvement compared to conventional optical microscopy. Among all SR techniques, STORM offers a high spatial resolution with simple optical instrument and standard organic fluorescent dyes, but it is also prone to image artifacts and degraded image resolution due to improper sample preparation or imaging conditions. It requires careful optimization of all three aspects involving sample preparation, image acquisition and image reconstructions to ensure a high-quality STORM image, which will be extensively discussed in this unit.
Keywords: Super-resolution fluorescence microscopy, stochastic optical reconstruction microscopy (STORM), single molecule localization microscopy (SMLM)
INTRODUCTION
Fluorescence microscopy is an essential tool for biologists to visualize molecular structures and their interactions. The fundamental diffraction limits the resolution of conventional microscopy to be approximately half of the wavelength (~λ/2NA, where λ is wavelength and NA is the numerical aperture of the optical system). Super-resolution (SR) fluorescence microscopy, a new class of microscopy techniques that break this fundamental diffraction-limited resolution, has experienced rapid growth in the past 10 years. Various types of SR techniques have been developed, such as structured illumination microscopy (SIM) (Gustafsson, 2000), stimulated emission microscopy (STED) (Hell and Wichmann, 1994), (fluorescence) photo-activated localization microscopy [(f)PALM] (Hess et al., 2006; Betzig et al., 2006) and (direct) stochastic optical reconstruction microscopy [(d)STORM] (Rust et al., 2006; Heilemann et al., 2008). These techniques either achieve sub-diffraction-limited resolution by optical manipulation of point spread function (PSF) such as STED, or by precise localization of single fluorescent emitters such as (d)STORM and (f)PALM, also known as single molecule localization microscopy (SMLM).
Among the state-of-the-art SR microscopy techniques, (d)STORM has several advantages such as the use of standard organic fluorescent dyes, relatively simple instrument and one of the best resolution down to ~20 nm. In (d)STORM (or SMLM), a small subset of the densely labeled fluorophores is sequentially switched “on” to achieve sparsely distributed single fluorescent emitters at each image frame; then the centers of the sparsely distributed single fluorescent emitters are determined by localization algorithm at a nanometer precision; after accumulating localized positions from a sufficiently large number of image frames (typically 5,000–40,000 frames), the final reconstructed image improves the resolution by 10 times. Therefore, (d)STORM requires a synergy of all three equally important aspects: (1) properly labeling of photo-switchable fluorophores onto the molecules of interest, (2) stochastic photo-activation of labeled fluorophores to achieve sparsely distributed single fluorescent emitters in the imaging field (i.e., image acquisition), and (3) precise localization of individual single fluorescent emitters at each image frame (i.e., image reconstruction), and a compromise in any of these steps can lead to significant image artifacts and degradation in image resolution. Many well-written reviews have provided the detailed introduction of the general principles and labeling of photo-switchable fluorophores (van de Linde et al., 2011; Bates et al., 2013a, 2013b; Enderlein, 2015). Conventional diffraction-limited fluorescence microscopy techniques that are mostly “turn-key” instruments that do not demand the users to fully understand the technology itself. However, mastering (d)STORM requires a substantial understanding of all key factors that involve chemistry, optical instrument and image processing, which often presents a challenge to many biologists without substantial technical background (Lambert and Waters, 2016). In this unit, we do not intend to repeat the previous reviews and protocols, but to focus on a comprehensive description of the protocols and interpretations on how to estimate and select all key technical factors of (d)STORM imaging that are critical to a high-quality and reproducible super-resolution image.
1. LABELING OF PHOTO-SWITCHABLE FLUOROPHORES
Labeling photo-switchable fluorophores onto the molecular target of interest is the first critical step. Two types of photo-switchable fluorophores are used – standard organic fluorescent dyes (e.g., Alexa Fluor 647) and activator-reporter (or tandem) dye pairs (e.g., Alexa Fluor 405-Alexa Fluor 647), and their associated imaging method is called direct STORM (or dSTORM) (van de Linde et al., 2011) and STORM (Bates et al., 2013b), respectively. Throughout this unit, dSTORM will be used if a single organic fluorescent dye is used; STORM will be used if a dye pair is used; and (d)STORM will be used if both methods are included.
Selection of proper fluorophores is the first critical step for (d)STORM imaging. Many organic dyes such as cyanine dyes, rhodamine dyes, oxazine dyes, have been reported to be photo-switchable under dSTORM imaging conditions, but only a handful of them are good candidates for dSTORM imaging. The photo-switching properties of 26 organic dyes for dSTORM imaging has been extensively characterized (Dempsey et al., 2011). Among all organic fluorescent dyes, Cy5 or its analog Alexa Fluor 647 is the best photo-switchable fluorophore for dSTORM imaging, with excellent blinking properties, high photon counts and high signal-to-background ratio when the fluorophores are switched “on” and “off” and high duty cycles for repeated localization.
In general, two fluorescent staining methods are used – transfection of genetically engineered fluorescent protein plasmids and immunofluorescence staining. The former applies to live cells; while the latter is commonly used in fixed cells and tissue. Here, we focus on immunofluorescence staining, the most commonly used staining method for (d)STORM imaging. It is similar to immunostaining for conventional fluorescence microscopic imaging, but the optimization in labeling density is essential to achieve high-quality and reproducible (d)STORM images that is discussed in this unit.
Materials
Chemicals include 4% PFA (Paraformaldehyde), Triton X-100, BSA (bovine serum albumin), 2-mercaptoethanol (βME), Cysteamine (MEA), Glucose Oxidase from Aspergillus niger-Type VII, lyophilized powder, ≥ 100,000 units/g solid, Catalase from bovine liver-lyophilized powder, ≥ 10,000 units/mg protein, NaCl, Cyclooctatetraene (COT) (optional), PIPES, MgCl2, EGTA, 1M Tris pH 8.0, 1N HCl, Phosphate-Buffered Saline (PBS), and all are purchased from Sigma-Aldrich.
Additional materials include 100 nm gold nanoparticle solution (EM.GC100) (BBI Solutions), donkey anti-rabbit antibody and donkey anti-mouse antibody (Jackson ImmunoResearch), Alexa Fluor 405 carboxylic acid succinimidyl ester and Alexa Fluor 647 carboxylic acid succinimidyl ester (ThermoFisher), NAP-5 Size exclusion columns, Cy2 and Cy3B reactive dye (GE Healthcare), and Glass bottom dishes (FD3510) (World Precision Instruments).
Blocking buffer: 3% BSA + 0.1% Triton X-100 in PBS.
Washing buffer: 0.2% BSA + 0.05% Triton X-100.
Preparation of glass-bottom petri-dishes or coverslips
Coat coverslips or glass-bottom petri-dish (coverslip #1.5) with Poly-D-lysine (PDL) for 20 minutes at room temperature.
Wash coverslips or petri-dishes with PBS once and dry in the air.
-
Fiducial marker coating (optional, only needed if fiducial marker correction is used)
Notes: Fiducial markers are used to correct sample drifts. Either gold or fluorescent nanoparticles are recommended as the fiducial markers. We will take gold nanoparticles as an illustrative example.
1) Dilute 100 nm gold nanoparticle solution in ddH2O at 1:50, sonicate in an ultrasound bath for at least 5 minutes, and then add the gold nanoparticle solution onto PDL coated dishes for 2 hours.
2) Remove the solution and air dry for 10 minutes. Additional layer of PDL is coated to improve the cell or tissue adhesion as described in Step 1 and 2.
3) Check density (ideally at least 3 fiducial markers in the field of view (FOV)).
Note: The choice between gold and fluorescent beads is made based on their susceptibility to photobleaching. If high laser power is constantly used during a long acquisition process, gold nanoparticles are preferred, as fluorescent beads can be photobleached before the completion of image acquisition. If relatively low power laser is used, fluorescent beads are preferred due to their high brightness.
Conjugation of photo-switchable fluorophores onto secondary antibody
Fluorophore-conjugated secondary antibody used for (d)STORM imaging can synthesized in the laboratory. For two-color STORM imaging based on dye-pair photo-switchable fluorophores, we use the example of Alexa Fluor 405-Alexa Fluor 647 pair and Cy2-Alexa Fluor 647 pair conjugated secondary antibodies; for two-color dSTORM imaging, we use the example of Cy3B and Alexa Fluor 647 conjugated secondary antibodies.
1.0-mg tube of Alexa Fluor 405 and Alexa Fluor 647 are dissolved in 100 μL of anhydrous DMSO, and divided into 50 aliquots with 0.02 mg each. One dye pack of Cy2 or Cy3B is dissolved in 20 μL DMSO and divided into 10 aliquots. For long-term storage, remove DMSO by a lyophilizer or evaporator, and store at -20°C in dry condition.
Dissolve the aliquot tubes described above with DMSO, Alexa 405, Cy2, or Cy3B is dissolved in 10 μL DMSO, and Alexa Fluor 647 is dissolved in 40 μL DMSO.
Prepare fresh 0.5 M NaHCO3 solution.
To conjugate secondary antibodies with a single fluorescent dye for dSTORM (using Alexa Fluor 647 and Cy3B as an example), 40 μL donkey anti-rabbit antibody, 10 μL NaHCO3, and 2 μL Alexa Fluor 647 are mixed and incubated for 30 minutes on a shaking platform, being protected from light. Similarly, 40 μL donkey anti-mouse antibody, 10 μL NaHCO3, and 1 μL Cy3B are mixed and incubated under the same condition.
To conjugate secondary antibodies with dye pair, 40 μL donkey anti-rabbit antibody, 10 μL NaHCO3, 5 μL Cy2, and 1 μL Alexa Fluor 647 are mixed thoroughly, and incubated for 30 minutes on a shaking platform, being protected from light. Similarly, 40 μL donkey anti-mouse antibody, 10 μL NaHCO3, 5 μL Alexa 405 and 1 μL Alexa Fluor 647 are mixed and incubated under the same condition.
During the reaction, wash the columns 3 times by 1000 μL PBS each time. When the reaction is complete, add 150 μL PBS to bring the reaction volume to 200 μL.
Add the entire reaction solution to the columns. After the last drip, add 550 μL PBS to wash, then add another 300 μL PBS and collect the fluorophore-conjugated antibody in a centrifuge tube. (The labeled antibody is expected to elute in fraction #3 off the column).
Measure the absorbance of the fluorophore-conjugated secondary antibody using a Nanodrop 2000. Store the labeled antibody fraction at 4°C. For long-term storage, aliquot and store in -20°C.
-
Calculation for the concentration of the labeled dyes. The concentration of labeling dye is calculated using Beer-Lambert’s law. Concentration of the labeled fluorophore = Aλmax/ελmax, where Aλmax is measured absorbance maxima of the labeled fluorophore and ελmax is the extinction coefficient at the wavelength of absorbance maxima.
Extinction coefficients: Alexa Fluor 405 = 34,000 M−1cm−1 (at 401 nm), Cy2 = 150,000 M−1cm−1 (at 489 nm), Cy3B = 130000 M−1cm−1 (at 559 nm), Alexa Fluor 647 = 239,000 M−1cm−1 (at 650 nm).
Immunofluorescence staining (on cultured cells)
Plate the cells on the coated dishes at the desired density and allow them to recover overnight.
Remove the medium and wash once with warm PBS, fix with 4% paraformaldehyde (PFA) in PBS for 10 minutes.
Remove the fixative and wash cells twice with PBS.
Remove the washing solution. Add 0.1% Triton X-100 in PBS (permeabilization buffer) to the dish and incubate for 10 minutes. (If ethanol, methanol or acetone was used to fix the cell, no permeabilization is required.)
-
Wash cells 3X with PBS, add blocking buffer and incubate for 1 hour.
Note: Blocking process is used to avoid the secondary antibody from reacting with the unreacted aldehydes, highly charged or very hydrophobic structures. If using polyclonal antibodies, low-affinity IgGs may bind speciously to structures that are not the target of interest.
Dilute the primary antibody in the blocking buffer at a desired concentration, add to the cells and incubate overnight at 4°C.
Wash the cells 3X with washing buffer for 5 minutes per wash.
-
Dilute the secondary antibody conjugated with fluorescent dyes (e.g., Alexa Fluor 647) in the blocking buffer at the desired concentration, add the antibody solution to the cells and incubate for 2 hours at room temperature. Protect from light.
Note: The concentration of primary and secondary antibodies need to be optimized to achieve the best labeling density for (d)STORM imaging.
Aspirate and wash 3X with washing buffer for 5 minutes per wash, wash once with PBS.
-
Post-fix with 4% PFA for 10 minutes at room temperature.
Note: Post-fixation is usually not needed in conventional fluorescence imaging, but it is recommended in (d)STORM imaging since long requisition time is often needed.
-
Wash 3X with PBS and store in PBS before (d)STORM imaging.
Note 1: For two-color staining, two different primary or secondary antibodies are diluted at the desired concentration together in the blocking buffer and incubated simultaneously.
Note 2: Cytoskeleton Buffer is recommended if microtubule or actin is imaged with STORM. Before Step 2, cells are pre-extracted for 30–60sec in 0.5% Triton X-100 (Triton) in BRB80 buffer supplemented with 4 mM EGTA.
BRB buffer: 80 mM PIPES, 1mM MgCl2, 1mM EGTA adjusted to pH 6.8 with KOH. This solution can be stored at 4°C. (This solution can also be made and store as a 5X stock).
2. IMAGE ACQUISITION
The fluorophore itself labeled via immunofluorescence staining described above is not photo-switchable under the imaging conditions for conventional fluorescence microscopy. Two important factors are needed to make it photo-switchable: imaging buffer and high excitation power density (a few kW·cm−2). The imaging buffer should contain a thiol compound such as cysteamine (MEA) or 2-mercaptoethanol (βME), to enable photo-switching. If cyanine dyes are used, an oxygen scavenger system is also necessary to reduce the photo bleaching. Similar criteria also apply to dye pair based STORM imaging. In this section, we describe the preparation of imaging buffer and data acquisition steps.
Materials
Buffer A: 0.5 mL 1M Tris (pH 8.0) + 0.146 g NaCl + 50 mL H2O.
Buffer B: 2.5 mL 1M Tris (pH 8.0) + 0.029 g NaCl + 5 g Glucose + 47.5 mL H2O.
Preparation of imaging buffer
GLOX: 14 mg Glucose Oxidase + 50 μL Catalase (17 mg/mL) + 200 μL Buffer A. (17 mg/mL catalase as prepared by dissolve 0.85 mg Catalase in 50 μL Buffer A). It is recommended to store the GLOX solution in 4°C and no longer than 1 week.
1 M MEA: 77 mg MEA + 1.0 mL 0.25 N HCl. (pH value of the MEA solution should be in the range of 7.5–8.5, adjust into the range with HCl if necessary). This MEA stock solution can be kept at 4°C and used within 1–2 weeks of preparation. For long-term storage, freeze small aliquots at −20°C and keep them for several months.
Data acquisition
-
Imaging Buffer (~1 mL): Add 10 μL GLOX and 100 μL 1M MEA solution (10 μL βME, if βME buffer is used) into 1 mL buffer B, gently mixed.
Cyclooctatetraene (COT) is reported to significantly increase the number of photons emitted per cycle by each dye during (d)STORM imaging (Olivier et al., 2013). 2 mM COT is optional to add to the imaging buffer if higher photon count is required.
Switch the PBS in the sample dish to imaging buffer described above, add oil to the objective and place the dish on it.
Use a lower laser power (~1 mW) to identify the imaging objects and focal plane and acquire a conventional wide-field fluorescence image.
Increase the laser power to maximum (~2–10 kW·cm−2 power density) to turn “off” fluorescent molecules and trigger photo-switching.
-
For dSTORM imaging, set the exposure time (e.g., 20–50 milliseconds) and the total acquisition frame numbers (10,000–40,000 frames), and start the acquisition.
Note: For dSTORM imaging, the imaging condition remains the same except that pulsed activation of 405nm or 488nm (at low power of ~1–100 μW) can added during the data acquisition if the number of “on” molecules at each frame becomes very sparse.
-
For STORM imaging based on dye pairs, one activation frame (e.g., 405nm) and three imaging frames are typically used for each cycle, and ~10,000 cycles are often needed for each color (a total of 40,000 frames). The users can refer to the manuals from N-STORM (Nikon) for detailed operation.
Note: For example, two dye-pairs are used – Alexa Fluor 405-Alexa Fluor 647 for color 1 and Cy2-Alexa Fluor 647 for color 2. Two activator lasers (405 nm and 488 nm) are pulsed on: when 405 nm laser is pulsed on to turn on Alexa Fluor 405-Alexa Fluor 647 channel, then the imaging laser (647 nm) is turned on for image acquisition in color 1 channel; when 488 nm laser is pulsed on to turn on Cy2-Alexa Fluor 647 channel, and then the imaging laser 647 nm is turned on for image acquisition in color 2 channel.
3. IMAGE RECONSTRUCTION
The previous section of “Image Acquisition” describes how to get high-quality raw images, which ensures the sequent reconstruction of high-quality super-resolution image. Upon the completion of image acquisition, the final (d)STORM image is reconstructed by localizing single fluorescent emitters (“on” molecules) recorded at each frame. Image reconstruction software is generally provided by commercial STORM system (e.g., N-STORM). But there are also a large number of SMLM image reconstruction software made freely available with detailed documentation, and have been rigorously evaluated in a recent report (Sage et al., 2015). ThunderSTORM (Ovesný et al., 2014), a user-friendly ImageJ plugin, is one of the most widely used free software for (d)STORM image reconstruction. Alternatively, if high-speed super-resolution image reconstruction is required (e.g., online view or very large data set with tens of millions localization events), rapidSTORM (Wolter et al., 2012b) is also a good option. Both have detailed manuals and step-by-step guide for image reconstruction process. It should be noted that the selection of the proper parameters (e.g., image filtering, localization method) based on the specific raw image is critical for accurate identification of candidate single molecules and high-quality (d)STORM image reconstruction. Our protocol below gives a brief description of how to choose the critical parameters for (d)STORM image reconstruction, based on ThunderSTORM (Ovesný et al., 2014), a software based on free software platform ImageJ (Schneider et al., 2012). Please note that the selected parameters and options described in this protocol are not the only choices. The users need to refer to their manuals for detailed guide to select the proper sets of parameters based on their specific image sets.
Setting parameters for (d)STORM image reconstruction
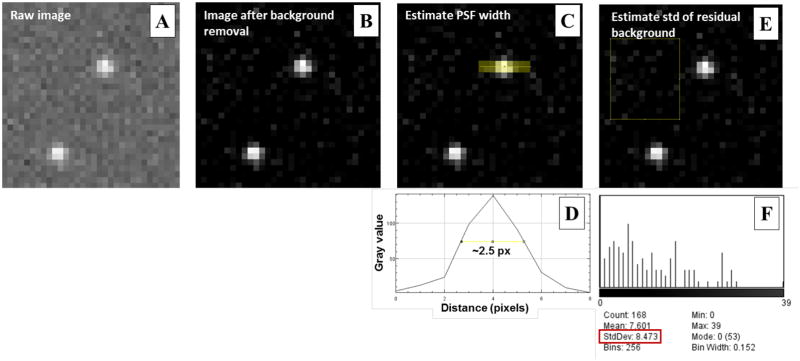
Subtract the background signal from the raw image taken at each frame. In ImageJ, go to Process → Subtract Background (Rolling ball radius can be set to 10 pixels) (see Figs. 1(A–B)).
Estimate the width of the point spread function (PSF). In ImageJ, go to Straight Line symbol (width of 2 pixels), and draw a line across the image of a single fluorescent emitter (see Fig. 1C). Then go to Analyze → Plot Profile, and measure the full-width at half maximum (FWHM) of the profile. As shown in Fig. 1D, the measured FWHM is ~2.5 pixels in our example, corresponding to the sigma (standard deviation) of PSF of 2.5 pixels/2.35 = 1.1 pixels.
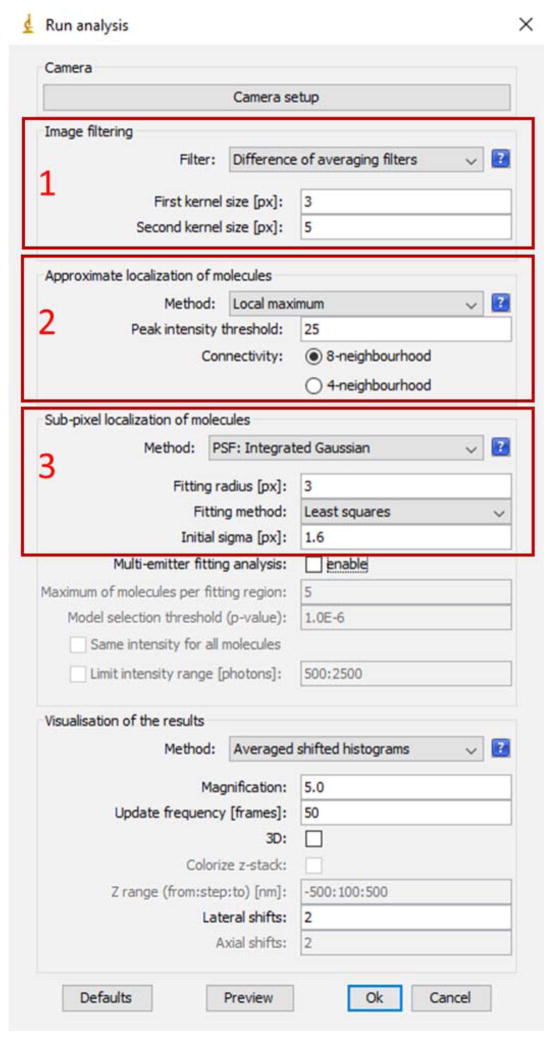
Set parameters in Image filtering in ThunderSTORM → Run Analysis → Image filtering (Red Box 1 of Fig. 2). We recommend “Difference of averaging filter” that is suitable in most (d)STORM raw images. The first kernel size should be slightly larger than the previously measured FWHM of PSF, in our example shown in Fig. 1, we set it to 3 pixels (the measured FWHM of 2.5 pixels); and the second kernel size should be at least 2 times larger than the FWHM of the PSF, in our example shown in Fig. 1, we set it to 5 pixels.
Set parameters in “Approximate localization molecules” in ThunderSTORM → Run Analysis (Red Box 2 of Fig. 2). We recommend to use “Local maximum” for (d)STORM raw images; for “Peak intensity threshold”, we recommend 3 times of the standard deviation of the residual background, and in our example shown in Fig. 1, we set it to 25 (as the measured background standard deviation is ~8.5 pixels shown in Figs. 1(E–F)); for “Connectivity”, we recommend “8-neighbourhood” (default setting).
Set parameters in “Sub-pixel localization of molecules” in ThunderSTORM → Run Analysis → Sub-pixel localization of molecules (Red Box 3 of Fig. 2). In Method, we recommend “Gaussian PSF” or “Integrated Gaussian PSF” (their localization results do not differ much for most (d)STORM data); for “Fitting radius”, we recommend 3 times of the PSF sigma, and in our example shown in Fig. 1, we set it to 3; for “Fitting method”, we recommend “least square”.
-
If the raw image consists of high-density single molecules (with overlapping fluorescent emitters), “Multi-emitter fitting analysis” box is checked.
Note: This image reconstruction algorithm is ~20 times slower than the single-molecule image reconstruction algorithm.
After all the parameters are set up, start the image reconstruction.
Figure 1.
The illustration of how to select parameters for (d)STORM super-resolution image reconstruction. (A) The representative raw image from a single frame. (B) The image after background removal. (C) The illustration of how to estimate PSF width. A line (thickness = 2 pixels) across the yellow area in the image is plotted, shown in (D). The full-width at half maximum (FWHM) is shown in about 2.5 pixels. (E) The illustration of how to estimate standard deviation of the background. The histogram of the background in the yellow box of (E) is shown in (F) and standard deviation is about 8.5 pixels, shown in red box.
Figure 2.
A snapshot of “Run Analysis” of ThunderSTORM ImageJ plugin.
COMMENTARY
Background Information
General information of (d)STORM imaging
The (d)STORM, as a single-molecule localization method in the family of SR fluorescence microscopy techniques, has a relatively unique mechanism of image formation compared to other optical methods to achieve a super resolution. It is essentially based on chemical manipulation of fluorophores to make them photo-switchable in a stochastic manner followed by image processing to localize the individual single fluorescent emitters at a nanometer precision. Unlike conventional optical microscopy where the image resolution is determined by diffraction defined by the full-width at half maximum of the point spread function (PSF), approximately λ/2NA, the (d)STORM image resolution is determined by multiple factors that can affect localization precision of single fluorescent emitters. Theoretically, the localization precision is expressed in terms of the standard deviation of the position measurement, , where s is the standard deviation of the PSF and N is the number of collected photons. In practice, all technical factors that affect the ability to accurately localize individual fluorescent emitters can ultimately affect the image resolution. These technical factors range from instrument configuration, to the properties and labeling of photo-switchable fluorophores, and to image reconstruction algorithms. In addition, the image resolution is also density-limited. In this section, we discuss how the major technical factors affect the localization precision.
(d)STORM imaging setup and associated technical factors
A common (d)STORM imaging setup mainly consists of light source for illumination, objective lens for light collection, cameras for image detection (see Fig. 3), together with a drift correction module.
Figure 3.
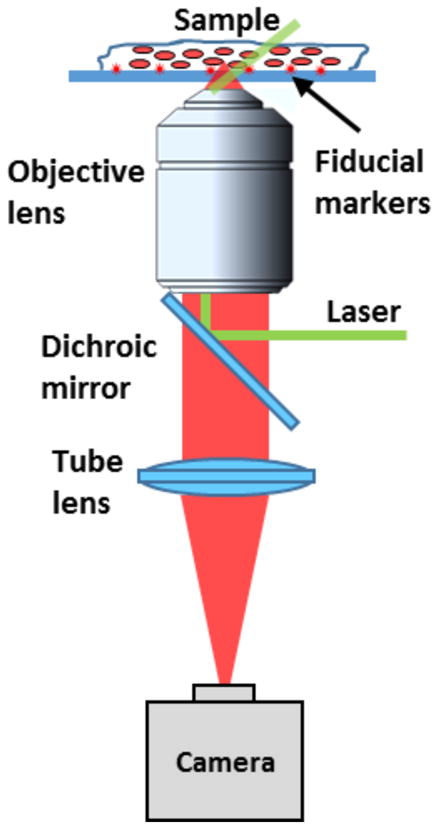
A simplified schematic of the (d)STORM instrument setup.
1) Illumination
The (d)STORM optical system generally requires a high-power laser to ensure that most of the fluorescent molecules are turned to the dark (“off”) state and only a small portion of the molecules on the bright (“on”) state. But the high-power laser also increases the background signal, such as auto-fluorescence, scattering light or those non-bleached fluorescent molecules. Additional effort should be paid to decrease the background signal. Total internal reflection fluorescence imaging (TIRF) is commonly used when the molecule of interest is within a few hundred nanometers from the surface of the cover glass. Its evanescent field limits the illumination depth to be ~100–200nm from the surface of the coverglass, and the background signal from those out-of-focus planes are all rejected. However, TIRF does not work if target molecules are located at more than 200 nm above the coverglass surface, where high-angle inclined illumination (Tokunaga et al., 2008) or light-sheet illumination (Gebhardt et al., 2013; Galland et al., 2015) are needed. High-angle inclined illumination is easier to implement, and hence is widely used (such as in the commercial STORM system); a thinner depth of illumination provides a better reduction of the background, but results in a smaller imaging FOV that timits the throughput. In comparison, light-sheet illumination requires additional illumination path in the optical system, and its orthogonal arrangement between illumination and collection objectives also limits the NA of the objectives and complicates the sample holder. Hence it is not commonly used in STORM system, but its ability to illuminate a large FOV with a relatively thin section (several microns) makes it potentially attractive for high-throughput imaging. It should be noted that if the sample is very thin (a few microns such as COS7 cells), the illumination methods do not matter much and even conventional epi-illumination can be used (Douglass et al., 2016).
2) Objective lens
The (d)STORM usually uses an objective lens with high numerical aperture (NA) to collect the fluorescence signal. One advantage is that the localization precision of single molecules is proportional to the diffraction-limited resolution that is inversely proportional to the NA of the objective and a higher NA leads to better localization precision; the other advantage is that the objective lens with higher NA can collect more photons to increase the total photon number for each single fluorescent emitter, which also improves the localization precision. To be more specific, for example, the commonly used objective lens for (d)STORM has a NA of 1.49, corresponding to a collection half angle of ~80° and a collection efficiency of ~42%; if the objective lens with NA of 1.3 is used, the collection half angle is ~59° and the collection efficiency reduces to ~25%. So the final localization precision with an objective of NA = 1.49 is 50% better than that with an objective of NA = 1.3. Hence, in practice, we usually select the objective lens with a NA higher than 1.4.
In addition, if TIRF illumination is used, the NA of the objective lens has to be higher than 1.4 to create the critical angle. When using the high NA objective lens, the user should note that, due to the refraction index mismatch of the imaging buffer (~1.33) and immersion oil (~1.515), the spherical aberration becomes significant at a large imaging depth (>10 μm), where adaptive optics or water-immersion objective lens can be introduced to reduce the aberration.
3) Camera
Super-resolution localization microscopy usually uses high-end scientific cameras (EMCCD or sCMOS) with high quantum efficiency (QE) and low noise. Lots of factors can influence the performance of a camera, such as dark current noise, read noise, fixed pattern noise, excess noise, QE. The scientific cameras usually employ deep cooling to make the thermally induced “dark current” negligible (< 0.1 electron per frame), and the back-illuminated sensor manufacturing technique to increase the QE of the sensor up to 95%, thus preserving almost all the photons in the image recording process.
The EMCCD and sCMOS adopt different technical route to minimize noise. EMCCD uses the same gain register and A/D converter for all the pixels, so its fixed pattern noise from different signal response can be neglected; but its relatively slow read speed limits the speed for image acquisition. In addition, EMCCD uses the on-chip electron-multiplication process, which can enhance the signal and suppress the read noise to be less than 1 electron. But the electron-multiplication process is a double-edged sword – it suppresses the read noise, but introduces the excess noise to each pixel and decreases the localization precision by a factor of (Mortensen et al., 2010; Quan et al., 2010b). In comparison, sCMOS assigns a specific gain register to each pixel and A/D converter to each column, and hence the read speed is much faster than EMCCD, but its high fixed pattern noise needs additional correction in the post processing (Huang et al., 2013). The sCMOS does not have specific electron multiplication registers, so the read noise of sCMOS cameras is above 1 electron, but without adding excess noise.
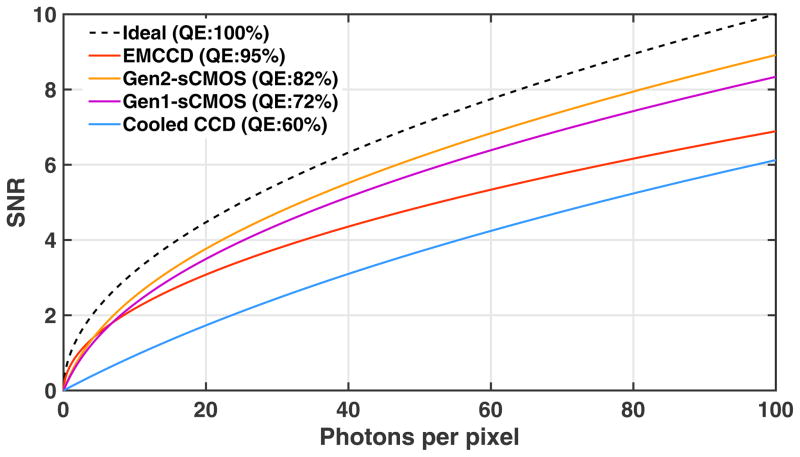
Should the user select EMCCD or sCMOS cameras? The CMOS manufacturing technique has achieved significant advances in recent years and sCMOS becomes an excellent alternative to EMCCD cameras. For most (d)STORM imaging applications, the performance of sCMOS cameras in terms of localization precision is even better than that of EMCCD. In addition, sCMOS cameras significantly improve the throughput by offering a larger FOV. In comparison, EMCCD is not only more expensive, but also has a smaller FOV, and its SNR advantage is only useful in very weak light level (< 3 photons per pixel) that is mostly not needed in most (d)STORM imaging conditions. Figure 4 shows the estimated SNR for EMCCD, sCMOS (including both the first and second generation sCMOS sensors) and regular cooled interline CCD camera; and sCMOS clearly shows a better SNR when photons per pixel is larger than 20. Although EMCCD is traditionally used for single molecule imaging and (d)STORM, sCMOS has gradually replaced EMCCD as the preferred detector for single molecule localization microscopy. For example, the second-generation N-STORM system (N-STORM 4.0) uses sCMOS in replace of the EMCCD used in their first-generation system.
Figure 4.
4) Drift correction
Motion blur due to the sample drift is one of the major causes of image distortion in super-resolution imaging, caused by various sources such as mechanical vibration, thermal expansion. Therefore, online drift correction is generally used for image acquisition that requires a relatively long time (several minutes), especially in (d)STORM. Various methods have been developed to compensate the sample drift during data acquisition. The axial depth of focus is usually less than 1 μm, so the axial drift needs to be corrected online if the axial stability of the microscopy system is not sufficient. In comparison, the lateral FOV is usually much larger (tens of microns), and thus the lateral drift can be corrected in the post-processing step.
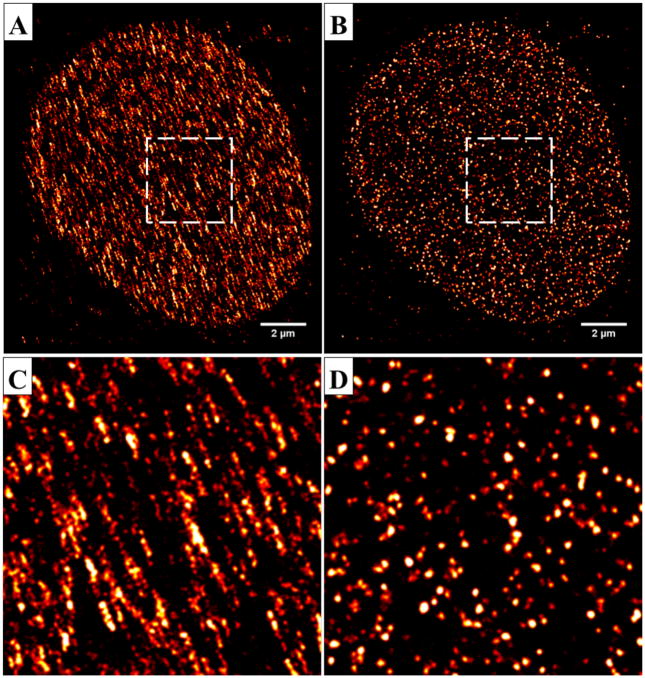
Commercial SR microscopy system uses the reflected infrared light at the interface between the coverglass and the imaging medium due to their refractive index mismatch, to monitor the drift in the axial direction (Bates et al., 2013b), and uses image cross-correlation methods to correct for the lateral drift during the image reconstruction step (Wang et al., 2014; Mlodzianoski et al., 2011). This combination can handle the drift correction in most situations, but the reflection-based axial drift correction method does not work well when the refraction index between the coverglass and the medium is close and the image correlation based lateral drift correction method depends heavily on the image content and sample structure, which does not work well when the imaged target is dynamic in the imaging process or low numbers of imaged molecules. In this context, fiduciary markers (gold or fluorescent nanoparticles attached to the surface of the coverglass) are introduced (Lee et al., 2012; Pertsinidis et al., 2010). By tracking the position of the markers on the coverglass, the precise drift in three dimensions is monitored online. When the imaging plane is distant from the focal plane where the fiduciary markers are located (e.g., a few microns above the coverglass surface), additional “jump” process between the focal planes of the imaging objects and the fiduciary markers (e.g., every few seconds assuming no axial drift in a short time period) is needed in the image acquisition process (York et al., 2011). Figure 5 shows an example of dSTORM image of nucleosomes of the cell nucleus (histone protein H2B is labeled by Alexa Fluor 647) before and after drift correction, where the focal plane of the imaging object is about 2–3μm above the surface of the coverslip where the fiduciary markers are located. This comparison highlights the importance of drift correction in (d)STORM imaging.
Figure 5.
Super-resolution dSTORM images of nucleosomes (H2B immunostained with Alexa Fluor 647) in the cell nucleus (A) before and (B) after the drift correction. The focal plane of the imaging object is ~2–3μm above the surface of the coverslip. (C–D) The zoomed-in region of the white box in in A and B.
Image Reconstruction
The high-quality raw image is the key pre-requisite for the sequent reconstruction of high-quality (d)STORM image. Single-molecule based super-resolution image reconstruction is generally comprised of three steps.
1) Background estimation
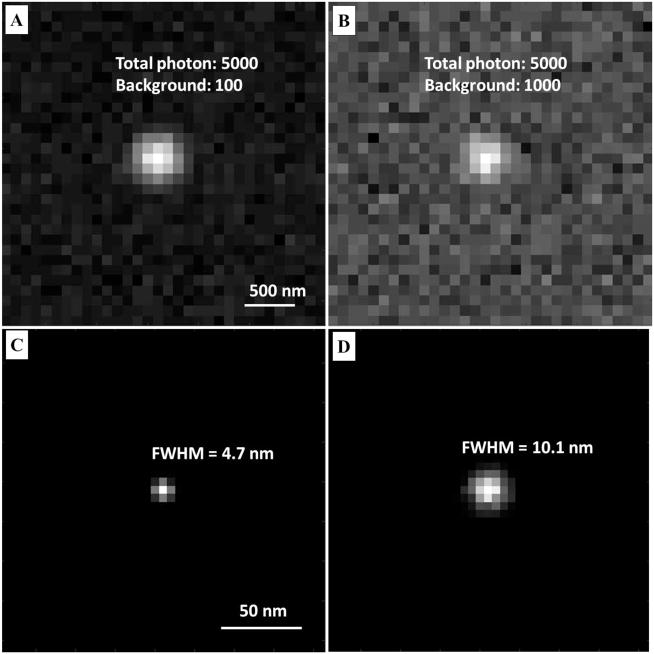
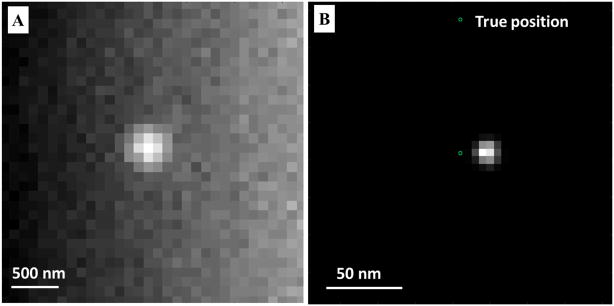
Background is common in (d)STORM imaging, especially when imaging objects are located at deeper depth larger than 3μm above the coverslip surface. Various sources can contribute to the background signals, such as auto-fluorescence, scattering and non-bleached fluorescent molecules close to and distant from the focal plane. High background signals not only degrade the localization precision, but also increases the fake localization events, leading to reconstruction artifact. Figure 6 shows the effect of background on localization precision, where the presence of a high background (B, D) leads to a reduced localization precision compared to that in the case of a low background (A, C). If the background is non-uniform, the localization position can be shifted toward the region with brighter background, resulting in severe localization bias, as shown in Fig. 7, where the localized position is shifted from the true position. Therefore, precise background estimation is highly important in these situations to remove these effect that can negatively affect the localization precision. The background can be classified into two types: (A) background with a small change between subsequent frames, which mainly consists of auto-fluorescence and non-bleached out-of-focus fluorescent molecules; and (B) background that changes every imaging frame, which is mainly from non-bleached fluorescent molecules near the focal plane. For Type (A) background, temporal filters (e.g., temporal median filter (Hoogendoorn et al., 2014)) can be used for background estimation; and for Type (B) background, low-pass filters (e.g., wavelet transform) can be used for background estimation.
Figure 6.
Effect of different background levels on the localization accuracy. (A, C) The raw image and localized (B, D) super-resolution image of a single fluorescent emitter at a low background level of 1000 photons per pixel and a high background level of 1000 photons per pixel, respectively, at a total photon number for a single fluorescent emitter set to 5000 to mimic the emission properties of Alexa Fluor 647. The final localization precision, measured by the standard deviation of localized positions, is reduced by over a factor of 2 at a high background level compared to a low background level. Total photon number of a single fluorescent emitter: 5000. Pixel size of the raw image: 100 nm; pixel size of the super-resolution image: 5 nm.
Figure 7.
Effect of non-uniform background on the localization accuracy. A non-uniform background leads to significant localization bias. (A) From left to right, the background is simulated as 100 to 500 photons per pixel. (B) The localized position carries a bias of over 15 nm at a localization precision of ~10 nm. Total photon number of a single fluorescent emitter: 5000. Pixel size of the raw image: 100 nm. Pixel size of the super-resolution image: 5 nm.
2) Identification of candidate molecules
Identifying the single fluorescent emitters (bright spot) from the raw image at each frame is much simpler if the background is well estimated. To highlight the candidate molecules, different of filters can be used, such as Gaussian smoothing filter, difference of Gaussian filter, difference of mean filter and wavelet denoising filter. Bandpass filters (difference of Gaussian filter, difference of mean filter and wavelet denoising) can efficiently highlight the fluorescent emitters and more importantly, robust to the influence of residual background if the background is not well estimated. Then, the pixel with local maxima is recognized as the center of the candidate molecules, and the corresponding region-of-interest (ROI) is delivered to the next step for localization. This step also implements another important task of rejecting overlapped molecules, because most single-molecule localization algorithms can only precisely localize well-separated individual molecules without overlap. So the candidate molecules with distance less than the diameter of the PSF can be rejected in this step and save the computation time.
3) Single molecule localization
The most rigorous method to localize single molecules from the diffraction-limited image is to fit the raw data with a PSF model and vary the parameters to minimize the difference between the raw data and PSF model. In practice, Gaussian function is typically used to approximate the PSF model, and shot noise is used as the noise model. The fitting process is usually implemented by mathematical optimization routines. The two most commonly used method for the optimization routine is least square estimation (LS) and maximum likelihood estimation (MLE).
Maximum likelihood estimator (MLE) is thought to be the most precise method which can reach the theoretical limit (Mortensen et al., 2010). MLE requires an accurate PSF model, noise model and camera information, and by varying the model parameters, it searches the parameters to maximize the joint likelihood (defined as the product of the likelihood of signals on each pixel) between the model and the data. In practice, a threshold is often set to stop the iteration if the parameters are precise enough. As this process usually takes tens of iterations, its computation speed is usually slow. Therefore, multi-core CPUs or GPUs are usually used to accelerate the computation speed of MLE (Wolter et al., 2012a; Quan et al., 2010a; Smith et al., 2010).
However, it is not always possible to get the exact information about the PSF model, noise model and camera information, where least square estimator (LS) is a better fitting tool. LS fitting requires no detailed knowledge of the camera noise, and search the parameters that can minimize the difference between the model and the raw data. Compared to MLE, LS requires less detailed information on the noise model and camera, and is more robust to PSF distortion caused by aberration or scattering (Ovesný et al., 2014; Wolter et al., 2012a).
Generally speaking, localization fitting methods (especially MLE) work the best when accurate noise and PSF models are available. But when computational simplicity (e.g. implemented on chip) or computing speed (online analysis) is crucial, single-iteration algorithm is often preferable. Some single-iteration algorithms such as radial symmetry (Ma et al., 2012; Parthasarathy, 2012), gradient fitting (Ma et al., 2015) have similar localization precision as the iterative fitting based algorithms, but can run two orders of magnitude faster, hence can also be used to identify the starting values for an iterative fitting routine.
Single molecule vs. high-density molecule localization
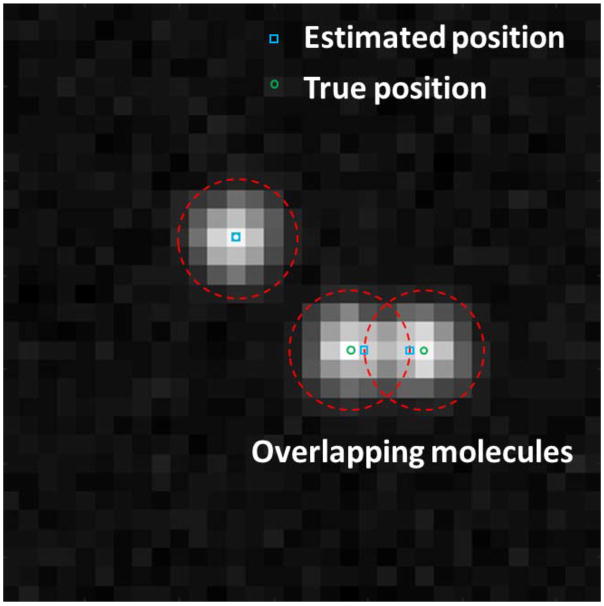
Conventional (d)STORM imaging requires the fluorophores to be sparsely activated without overlap. In the image reconstruction process using single molecule localization algorithms, the overlapping molecules are rejected for better localization precision. To reconstruct a super-resolution image with sufficient localization density, it requires accumulating tens of thousands of imaging frames that takes 10–15 minutes, resulting in a low throughput. High-density molecule localization is proposed as a strategy to improve the throughput and imaging speed by increasing the number of activated single molecules at each frame with a reduced number of imaging frames. In addition, when the structure of the imaging object itself is highly condensed, such as chromatin, overlapping molecules are always present due to its highly compact structure.
Algorithms to localize overlapping molecules can be classified into two types: multi-emitter fitting based algorithm (Quan et al., 2011; Huang et al., 2011; Holden et al., 2011) and deconvolution based algorithm (Mukamel et al., 2012; Zhu et al., 2012). The first category fits a multiple-emitter Gaussian PSF model to the raw data, which is a straightforward extension to the single molecule fitting. The model is a sum of PSFs at different positions, in which the number of single emitters is one of the parameters optimized to minimize the mismatch between the raw data and the model, using similar mathematical optimization routines – MLE and LS. Similar to the single molecule fitting algorithm, MLE is better if the PSF model, noise model and camera information are known. An important parameter for multi-emitter fitting is the estimated molecule number, which can significantly affect the final localization precision.
Deconvolution-based algorithms estimate a local density of emitters. Density is estimated on a grid that is finer than the raw image (e.g., 1/8 pixel), and the density should be 0 everywhere except at the position of an emitter. In SMLM, this task has been accomplished by Richardson-Lucy (RL) deconvolution (Mukamel et al., 2012) and compressed sensing (CS) (Zhu et al., 2012). Because the high-density localization algorithms run much slower than single emitter localization algorithms, GPU has been introduced to accelerate the computation speed. But even with GPU, it is still impossible for ultrahigh speed data analysis such as online image reconstruction or large data set (e.g., tens of millions of localized molecules). Single iteration algorithm can potentially improve the computation speed, but no closed form mathematical solution is currently available due to the complexity of the overlapping emitter model. Please be noted that the precision of high-density localization (even with the state-of-the-art algorithms) is often compromised compared to those of sparsely distributed single molecule localization, despite a higher throughput. Therefore, if the users want a highest resolution possible, it is important to ensure sparsely distributed single fluorescent emitters at each image frame.
Measure of (d)STORM image resolution
The resolution of (d)STORM image is affected by a multitude of factors such as localization precision, Nyquist resolution, labeling density and the underlying spatial structure of the imaging object. To objectively measure the image resolution of SMLM or (d)STORM, Fourier ring correlation (FRC) (Nieuwenhuizen et al., 2013) is introduced, which can be computed directly from the experimental data alone without any a priori information. FRC resolution makes it possible to compare the resolution for images taken with different nanoscopy methods, to optimize and rank different emitter localization and labeling strategies, to define a stopping criterion for data acquisition. However, it should be noted that FRC resolution is also affected by the sample structure and density of localizations, hence the comparison should be based on similar sample structure and labeling density.
Multicolor (d)STORM imaging
Conventional multicolor imaging is realized by labeling the molecules of interest with dyes at different emission wavelengths. The same approach is also applicable to multicolor (d)STORM imaging, in which the only difference is the use of photo-switchable fluorophores.
For multicolor dSTORM imaging, the selection of appropriate photo-switchable fluorophores is critical. On one hand, since the organic dyes usually have a wide absorption and emission spectra, it is important to choose the dyes with well separated spectra to avoid or maximally limit the crosstalk. On the other hand, the chosen fluorophores must show good photo-switching ability that can significantly affect the quality of super-resolution image. Generally, the photo-switching fluorophore which can be used in dSTORM imaging should meet the following requirements: (1) high photon counts per switching cycle; (2) low fraction of time the dye spent in its “on” state (on-off duty cycle); and (3) high survival fraction and number of switching cycles. High photon count ensures a high localization precision and low duty cycle ensures a small fraction of molecules to be at “on” state to avoid overlapping molecules. As the image resolution of (d)STORM is density-limited, the third factor leads to multiple repeated localizations per molecule with a higher precision.
More than 26 organic dyes have been evaluated for dSTORM imaging. Although most organic fluorescent dyes exhibit some photo-switchable properties under the same dSTORM imaging condition, most of them do not meet the above criteria as candidates for dSTORM imaging. Among them, ATTO 488, Alexa Fluor 568 (substitutable with Cy3B), Alexa Fluor 647 (substitutable with Cy5), and Alexa Fluor 750 are recommended for multicolor dSTORM. Because of its exceptional photo-switching properties, Alexa Fluor 647 or Cy5 is recommended as the most ideal fluorescent dye if only single-color dSTORM imaging is needed.
Alternatively, a “dye pair” scheme can be used (Bates et al., 2007), in which a cyanine dye (Alexa Fluor 647/Cy5/Cy7) and a shorter-wavelength fluorophore (Alexa Fluor 405/Cy2/Cy3) are paired in close proximity by conjugating to an antibody or double-stranded DNA, referred to as “reporter” and “activator”, respectively. These reporter dyes display robust photo-switching behaviors by re-activating them with the “activator” wavelength. Multicolor STORM imaging can be implemented by using an identical reporter dye paired with different activator dyes (e.g., Cy2-Cy5 and Cy3-Cy5) or using different reporter dyes paired with same activator dye (e.g., Cy3-Cy5 and Cy3-Cy7).
Critical Parameters and Troubleshooting
1. Choice of fixatives
The main objective of fixation is to preserve cells and tissue as close to their natural state as possible, thereby preventing autolysis or putrefaction. Crosslinking and protein precipitation are the two general approaches for cell fixation. Crosslinking fixatives such as PFA fix cell or tissue by forming covalent chemical bonds between proteins; While precipitating fixatives such as methanol and ethanol, and acetone act by reducing the solubility of protein molecules. Since the membrane is permeabilized by precipitating fixative, there is no need to permeabilize with Triton after fixation as that used in crosslinking fixative.
All the fixatives have their advantages and disadvantages, and fixative should be carefully selected, and fixation protocol should also be optimized depending on the target molecules of interest. For example, cold methanol shows a good result on microtubule fixation; alcohol fixative has good performance on nucleic acids; formaldehyde is commonly used in tissue fixation and preserves most antigens. Overall, the selection of appropriate fixative should meet the following three criteria: 1) best preserving the original structure and morphology of cells or tissue; 2) best preserving the activity of antigens; 3) avoiding the use of fixative that can cause autofluorescence. For example, aldehyde fixatives react with amines and proteins to generate fluorescent products, glutaraldehyde is worse than formaldehyde. If glutaraldehyde has to be used for fixation, the sample can be reduced by freshly prepared 0.1% NaBH4 solution to bleach the autofluorescence. Therefore, the type of fixative, fixation time, temperature and pH values can all affect the experiment results.
2. Immunostaining
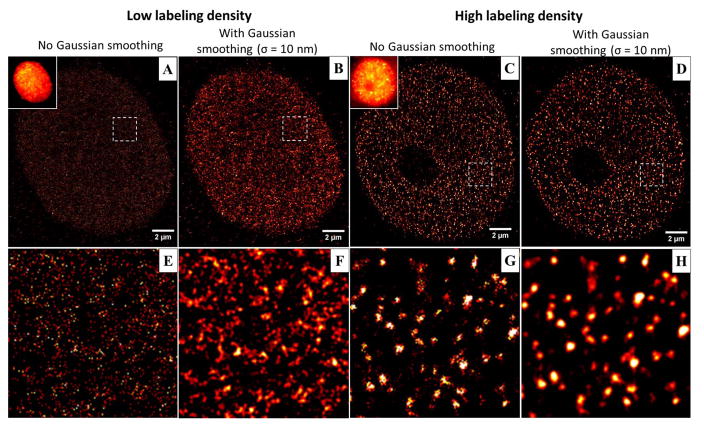
The most important parameter in the immunofluorescence staining step for (d)STORM imaging is to optimize the labeling density. As the resolution of (d)STORM image depends on labeling density, a lower labeling density significantly compromises the image resolution and results in serious image artifact. Figure 9 shows an example of reconstructed dSTORM images of H2B in the cases of low labeling density and high labeling density via immunofluorescence staining with Alexa Fluor 647. Although the conventional wide-field images appear similar (see the insets of Figs. 9(A, C)), their corresponding dSTORM images (Figs. 9(A, C)) exhibit distinct structures. The reconstructed dSTORM image in the case of a low labeling density (Fig. 9E) exhibits more diffuse structural features without distinct cluster-like nucleosomes; while the heterogeneous and discrete nucleosome clusters (Ricci et al., 2015) become distinctly clear in the case with a high labeling density (Fig. 9G). It should be noted that Gaussian rendering (via a Gaussian blur filter) is often used in the (d)STORM image rending step to minimize the effect of image pixelation and improve the visualization (see Figs. 9(B, D, F, H)). Such image processing should not dramatically change the structure presented in the image (see Figs. 9(C, G) vs. Figs. 9(D, H)). However, for the case of low labeling density, the smoothed image can amplify the image artifact (see Figs. 9(A, E) vs. Figs. 9(D, F)).
Figure 9.
The reconstructed dSTORM images of H2B in the case of (A–B, E–F) low labeling density and (C–D, G–H) high labeling density. (A–B) The dSTORM images of H2B in the case of low labeling density before and after applying a Gaussian smoothing filter (σ = 10 nm). (C–D): The reconstructed dSTORM images of H2B in the case of high labeling density before and after applying the same Gaussian smoothing filter as (B). The figure insets of (A, C) are the corresponding wide-field image of H2B. (E–H): The zoomed-in region of the white boxes shown in (A–D).
To ensure sufficient labeling density, we suggest using a higher antibody concentration than the recommended one from the suppliers which is often tested for conventional immunofluorescence staining. We also recommend a blocking step to minimize non-specific binding. Additionally, we recommend to incubate the primary antibody overnight at 4°C (rather than a few hours used by immunofluorescence staining for conventional fluorescence imaging) and incubate the secondary antibody at least 1 hour at the room temperature.
The fluorophore-conjugated secondary antibodies are often commercially available, which is routinely used for conventional imaging. However, since they are typically not well-validated for (d)STORM imaging, in our experience, the performance of commercial antibodies varies from different companies or lot numbers. Many commercially available fluorophore-conjugated antibodies do not provide sufficient labeling density, leading to low localization number in the reconstructed (d)STORM image, even if a decent wide-field image can be obtained. Further, the antibody-to-dye ratio is often unclear or varies from different lots. Therefore, we recommend to conjugate the fluorophores with secondary antibody in the laboratory for dSTORM imaging, rather than using the commercially available fluorophore-conjugated secondary antibodies. The secondary antibodies can react with dyes with an NHS ester group in alkalescent condition (pH~8.5), which can be done in most of the research laboratories following the manufacturer’s protocol or the protocol outlined in this unit.
In addition, antibody validation, which is an important process for any antibody-based assay, is even more important for (d)STORM imaging. Some commercially available antibodies do not meet the criteria of high labeling density for dSTORM imaging due to their poor labeling efficiency, even when they are sufficient for conventional microscopy. Therefore, the antibody first needs to be validated to ensure sufficient labeling density and localization number for the structure of interest. Although there is no well-defined localization number needed for the imaging object, too few (1–2) localization number from a structure of interest requires extra caution to ensure that the dSTORM image is the true representation of the imaging object. Therefore, for primary antibodies, it is always recommended to choose those with high specificity and sensitivity (e.g. ChIP Grade, Knockout (KO) validated antibodies). For secondary antibodies, we recommend using those with fluorophore conjugation performed in the laboratory as described in this unit.
3. Imaging buffer
The photo-switching properties of the fluorophore highly depends on the presence of imaging buffer. The ideal photo-switching properties for (d)STORM imaging is that the majority of the fluorophores stays at dark (“off”) state for a long period of time (several minutes) to prevent a high background; while only a small portion of the fluorophores stay at “on” state for a short time period of tens of milliseconds with a high photon count. Besides the properties of the fluorophore itself, two factors in the imaging buffer significantly affect the photoswitching properties of the fluorophore – thiol concentration and oxygen scavenger system. Upon photoexcitation, the fluorophore reacts with thiol in solution and forms intermediate states that turn dark (“off” state). The dark state has a long lifetime and returns to the “on” state spontaneously (Dempsey et al., 2009; van de Linde et al., 2011). The oxygen removal reduces the effect of photobleaching (Dempsey et al., 2009) and increases the lifetime of the intermediate states (van de Linde et al., 2011), especially for cyanine dyes (e.g., Alexa Fluor 647 or Cy5). Therefore, both thiol concentration and oxygen scavenger are required for proper photo-switching properties.
There are two types of thiols commonly used in (d)STORM imaging, 2-mercaptoethanol (βME) and MEA. In some cases, the switching behavior of the dyes is rather sensitive to the types of thiol as well as its concentration. For example, 2-mercaptoethanol contained buffer provides more photon counts per switching cycle for Alexa Fluor 647/Cy5; MEA has a longer duty cycle which is good to the densely labeled samples. Moderate to low concentration of MEA enhances the photo-switching rates, but high concentrations of MEA diminishes either the number of switching cycles or the number of photons per switching cycle (Bates et al., 2013b). Generally, if the photoswitching rate is too low, decrease the MEA concentration or pH value and vice versa.
On the other hand, an oxygen scavenging system is usually required in (d)STORM imaging to improve photo-switching of the fluorophore. The most commonly used oxygen scavenging system consists of a combination of glucose, glucose oxidase and catalase enzymes. But this system results in a time-dependent acidification of the buffer caused by the accumulation of the by-product – gluconic acid. An alternative oxygen scavenging system is a combination of protocatechuic acid and protocatechuic dioxygenase (PCA/PCD) that provide stable pH over several hours, but it is more expensive compared to the glucose based system.
During the long imaging process, when the molecular O2 reacts with oxygen scavenging system in the imaging buffer that results in a decrease in the pH value, the photo-switching properties of the fluorophore can be significantly compromised. Therefore, we recommend using the fresh imaging buffer and replacing the buffer at the appropriate time. The time interval for replacing the buffer depends on the volume of the buffer added to the sample, and for the dishes use in this protocol (FD3510, WPI) which contains ~200 μL buffer, we recommend using the imaging buffer for no more than 1 hour. If the sample is well sealed with minimal influx of atmospheric oxygen, the imaging buffer can last a few hours (Nahidiazar et al., 2016).
4. Image acquisition
In the image acquisition step, two parameters are important – exposure time and the number of image frames to be collected. Theoretically, the exposure time should be adjusted to be equal to the “on” time of the fluorophore, to maximize the collected photons from each switching cycle in a single image frame. A higher power of the excitation laser can also increase the blinking rate of the fluorophore, thus improving the data acquisition speed. However, if the laser power is too high, it can cause significant thermal damage to the sample and the optics during a long time of data acquisition. The users should confirm minimal damage, if high laser power density (e.g., > 5kW/cm2) is used.
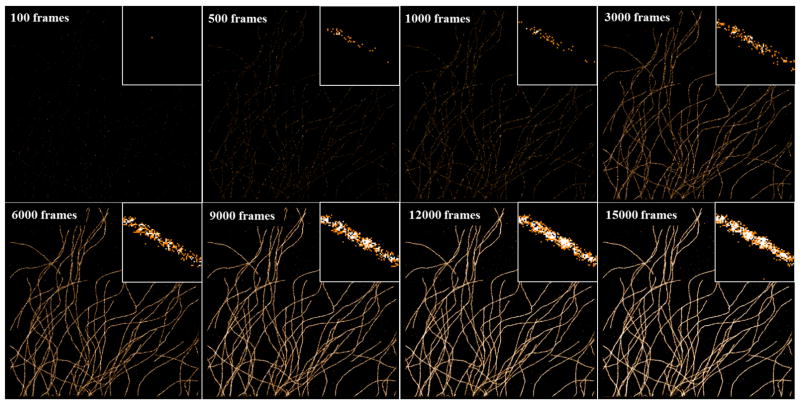
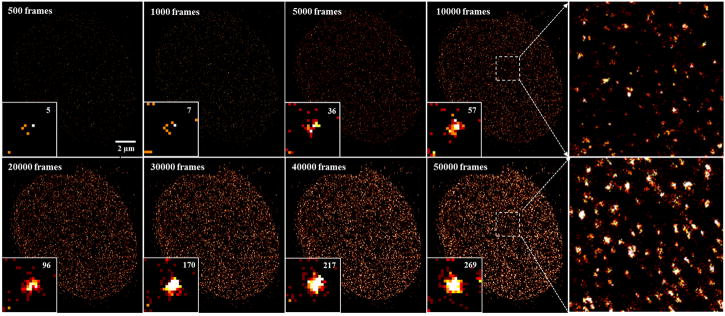
Selecting the sufficient number of imaging frames is important to faithfully reconstruct the super-resolution image in (d)STORM, and too few frame numbers can lead to significant image artifact. Figures 10 and 11 show the examples of reconstructed dSTORM images based on different number of frames. The number of frames highly depends on whether the structures of interest can be densely labelled or not. For example, the ultra-structure of the densely labeled microtubules can be seen after accumulating ~5,000 frames; while the structure of nucleosomes (labeled by histone protein H2B) requires the accumulation of ~20,000 frames to present the unambiguous nucleosome clusters. Such difference often depends on the structure itself and antibody efficiency if the labeling density is already optimized. A high localization number increases the image contrast and visualization, which is often preferred. It should be noted that additional irradiation using low-power shorter-wavelength lasers (e.g., 405 nm, 488 nm, 532 nm) facilitates the recovery of those “off”-state fluorophores, which can improve the efficiency of image acquisition when the number of “on” molecules becomes too sparse; but caution should be taken to avoid significant overlapping molecules and high background which can dramatically degrade the localization precision and image resolution.
Figure 10.
The dSTORM images of microtubules immuno-stained by Alexa Fluor 647 reconstructed by different numbers of imaging frames. The insets show the magnified region.
Figure 11.
The dSTORM of nucleosomes which is labeled by histone H2B immuno-stained via Alexa 647 and reconstructed by different numbers of imaging frames. The right two figures show the magnified structure as indicated in the white boxes. Number in the right top of the figure insets is the localization number in the selected area for the same single cluster.
5. Multicolor (d)STORM imaging
Multicolor imaging performed by either dSTORM or dye-pair has its advantages and disadvantages and the users should determine the proper method based on their specific application. In the case of dSTORM, the sample preparation for multicolor dSTORM is simpler than using dye pairs, which only requires different photo-switching dyes with distinctive emission and most of these fluorophore-conjugated antibodies are commercially available; for image acquisition, only the corresponding lasers for the photo-switching fluorophores are required. However, the chromatic aberration caused by different emission wavelength is unneglectable at a resolution down to below 100 nm. Therefore, a chromatic correction is required, mostly based on the derived chromatic shift between different color channels from multicolor fluorescent beads (TetraSpeck bead, 0.1μm diameter, blue/green/orange/dark red fluorescence, Invitrogen T7279). However, due to the heterogeneous aberration in the entire field of view and along the axial direction, such correction has a limited accuracy in all three dimensions. In addition, Alexa Fluor 647 is still the best photo-switchable fluorophore for dSTORM imaging and all other fluorophores have somewhat compromised performance, such as higher background, lower photon counts, which may negatively affect the image resolution.
If dye-pair is used, the antibody conjugated with dye pairs usually need to be synthesized in the laboratory. More importantly, the ratio between the reporter dye and activator dye need to be well optimized to ensure the switching efficiency. Usually at least more than 3 activator dye is conjugated to 1 reporter dye to minimize the fraction of antibodies labeled with more than one reporter dye, due to the inefficient switching for antibodies labelled with multiple reporter dyes (Bates et al., 2013a). Since the dye pair mode can use the identical reporter dye for multiple imaging channels, chromatic aberration correction is not required. Another advantage is that we can use the best reporter dye (i.e., Alexa Fluor 647 or its analog Cy5) for multicolor imaging. However, the cross-talk is always present if using dye-pair with the same reporter dye. Take the example of two-color STORM imaging with Cy2-Cy5 pair and C3-Cy5 pair, respectively. Because the red imaging laser (640 nm) can also excite Cy5 (dSTORM effect) besides the activation lasers for Cy2 and Cy3, there are non-specific signals from the dSTORM effect of Cy5 in both activation and imaging laser channels, giving a source of color crosstalk, even though this nonspecific crosstalk occurs with a relatively low probability (<5–10%). There are some strategies to reduce such nonspecific cross-talk. For example, higher activation laser intensity and lower imaging laser intensity can be used to reduce the nonspecific activation rate. Additionally, only the imaging frame immediately after an activation frame is recognized as a controlled activation event and the following two frames can be used as non-specific activation to correct for crosstalk (Bates et al., 2007; Dani et al., 2010).
In addition, an optimized imaging buffer that works well for all fluorescent dyes is needed. In general, the imaging buffer containing 2-mercaptoethanol is recommended for Alexa Fluor 647 and Cy3B, and MEA contained buffer is preferable if ATTO 488 or Alexa Fluor 568 are used. In the case of two-color imaging, for example, if Alexa Fluor 647, ATTO 488 or Alexa Fluor 568 is being used, MEA containing buffer is recommended. In multicolor STORM imaging by dye pairs, the blinking fraction also depends on different type of thiol contained buffers, it has been showed that MEA containing buffer leads to a lower crosstalk blinking fraction which caused by the reporter laser compared to 2-mercapethanol containing buffer.
Anticipated Results
1. Single-color dSTORM imaging
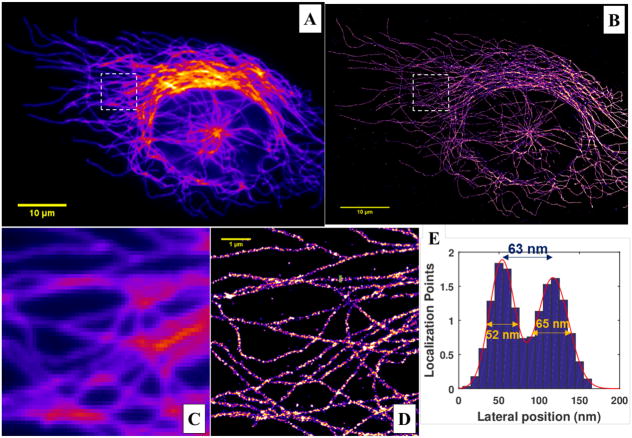
Figure 12 shows an example of conventional wide-field and reconstructed super-resolution image of microtubules immunostained by Alexa 647, following the sample preparation method described above, single-color dSTORM image acquisition, reconstructed using least-square single-emitter Gaussian fitting method. The dSTORM image (Fig. 12D) should present a much higher resolution with clear separation of different microtubule filament compared to the wide-field image (Fig. 12C). A cross-sectional profile shown in Fig. 12E quantifies the size, defined by the full-width at half-maximum, of representative microtubule filaments and their separation distance. The size and the separation distance for two closely spaced microtubules should be approximately 50–70 nm. Please note that this refers to randomly selected microtubule filaments, neither the smallest size, nor the hollow structures of a single microtubule. If regions with hollow structures are selected, the expected size should be less than 50 nm.
Figure 12.
(A–B) The conventional wide-field and reconstructed super-resolution image of microtubules from MCF10A cells, immuno-stained by Alexa 647 using dSTORM imaging and reconstructed. (C–D) The zoomed-in region of the white boxes shown in (A–B), respectively. (E) The cross-sectional profile from a marked region in (D), together the fitted full-width at half-maximum (FWHM). Illumination laser with a wavelength of 642 nm (VFL-P-1000–642-OEM3, MPB Communications) at a power density of 3 KW/cm2 is used, a total of 40,000 image frames at a speed of 50 Hz (acquisition time of 20 ms) are recorded on a sCMOS camera (pco.edge 4.2, PCO-Tech) with a pixel size of 130 nm on the sample plane. The super-resolution image is reconstructed using the least-square single-emitter Gaussian fitting method. The extracted molecules are fitted with least-square single-emitter Gaussian function model. Those candidate molecules that meet the following criteria are rejected: (1) total photon number less than 100; (2) the FWHM of PSF with 50% larger or smaller than that of the ideal PSF; (3) position with more than 2-pixel distance from the region center; (4) peak intensity vs. background intensity less than 0.5. The final super-resolution image was reconstructed by accumulating all molecules that meet the above criteria, with a pixel size of 10 nm followed by a Gaussian smoothing filter (σ=10 nm).
2. Two-color (d)STORM imaging
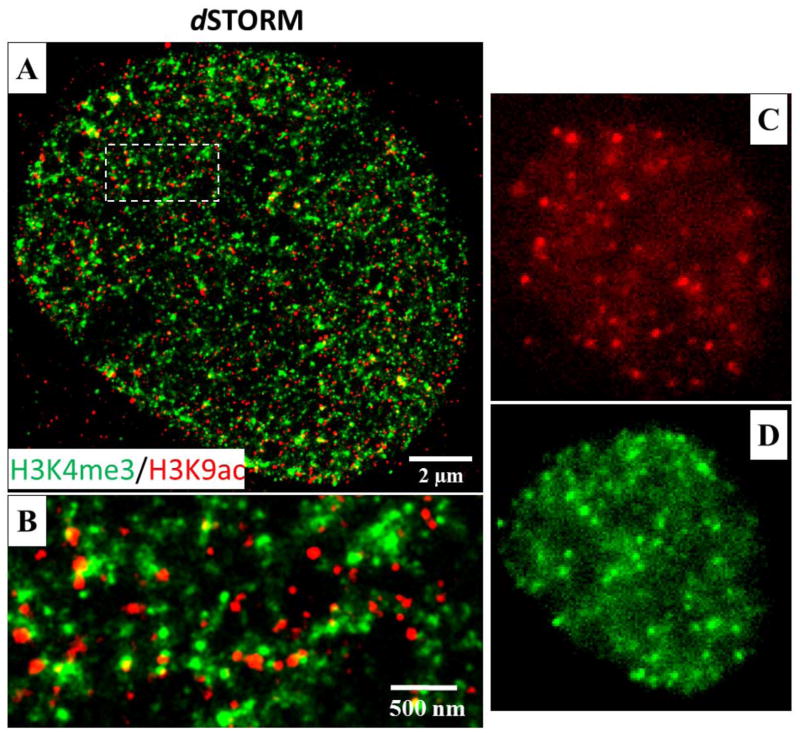
Figure 13 shows an example of two-color super-resolution images of methylated and acetylated histone proteins (H3K4me3 and H3K9Ac) in the cell nucleus of MCF-10A cells via two-color dSTORM. Figures 13(A-B) show the expected reconstructed two-color images of two histone proteins. Both H3K4me3 and H3K9Ac exhibit nanosized clusters, with a small percentage of co-localization. The representative raw image frames for Alexa Fluor 647 and Cy3B channels are shown in Figs. 13(C–D) and those bright “dots” are individual fluorescent emitters and each is fitted with a Gaussian function. It should be noted that for multicolor dSTORM imaging, the longer wavelength color channel (e.g., 647 nm) should be imaged first to avoid the photobleaching effect caused by the shorter wavelength laser (e.g., 561nm laser) due to the overlapping spectra of Cy3B and Alexa 647. If the sequence is reversed, a significant reduction in blinking fluorophores can be seen when the color channel of 647 nm is being imaged.
Figure 13.
Two-color super-resolution imaging of methylated (H3K4me3) and acetylated (H3K9Ac) histone proteins by dSTORM. (A–B) The dSTORM images of H3K4me3 and H3K9Ac. H3K4me3 is labeled with Cy3B and H3K9Ac is labeled with Alexa Fluor 647 in the cell nucleus of MCF-10A cells. (C–D) The representative raw images of Alexa Fluor 647 channel (H3K9Ac) and Cy3B channel (H3K4me3), respectively. Continuous illumination with a 642 nm or 561 nm laser are used in the two-color dSTORM imaging. The two channels are imaged sequentially at the exposure time of 20ms, for 30000 imaging frames using 642 nm excitation, followed by 30,000 imaging frames using 561 nm excitation. Fluorescent beads (0.1μm diameter, F8803, excited using 488 nm laser) are used as fiduciary markers on the coverslip to correct for 3D system drift every 200 frames.
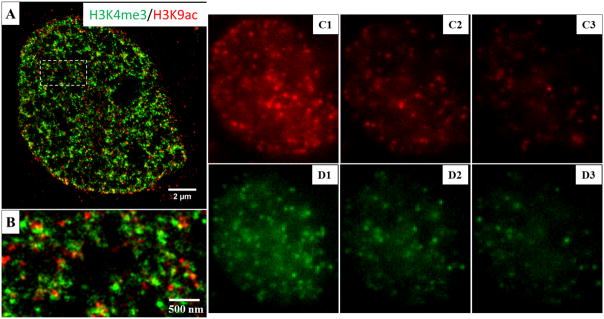
Figure 14 shows an example of two-color super-resolution images of the same histone proteins (H3K4me3 and H3K9Ac) in the cell nucleus of MCF-10A cells as Fig. 13 via two-color STORM imaging based on dye-pair photo-switchable fluorophores. The reconstructed two-color STORM image in Figs. 14(A–B) shows similar structural features as those in Fig. 13(A–B). The representative three consecutive raw image frames for Alexa Fluor 405-Alexa Fluor 647 pair are shown in Figs. 14(C1–C3). The first frame (Fig. 14C1) is the image frame right after activation with 405 nm laser, or controlled activation event; and the subsequent two frames (Figs. 14(C2–C3)) are considered as non-specific activation which accounts for less than 10% of total single fluorescent emitters, and is used to correct for cross-talk between the two color channels.
Figure 14.
Two-color super-resolution imaging of methylated (H3K4me3) and acetylated (H3K9Ac) histone proteins by STORM based on dye-pair photo-switchable fluorophores. (A–B) Reconstructed STORM image. H3K4me3 is labeled with Cy2-Alexa Fluor 647 and H3K9Ac is labeled with Alexa 405-Alexa 647. (C1–C3) The representative raw images of the three consecutive frames after the activation of 488 nm for Cy2-Alexa Fluor 647 pair for one cycle. (D1–D3) The representative three consecutive frames after the activation of 405 nm for Alexa Fluor 405-Alexa Fluor 647 pair for one cycle. The samples are periodically activated with a sequence of 405nm, 488nm laser pulses and then imaged with a 647 nm laser. In each switching cycle, one of the activation laser is turned on for 1 frame, followed by 3 frames of illumination with 647 nm imaging laser. The imaging frame that immediately after an activation pulse is recognized as a controlled activation event and a color is assigned accordingly. A total of 40000 frames include 10,000 activation frames and 30,000 imaging frames for each channel, acquired at the exposure time of 15ms. Cross-talk subtraction algorithm (described in the protocol) is used to subtract the non-specific activation signal.
Time Considerations
Following the cell fixation, the immunofluorescence staining step includes cell permeabilization and blocking step (~1.5 hours), the incubation with primary antibody (overnight) and dye-conjugated secondary antibody (~2 hours). Following the immunostaining, the image acquisition for each FOV takes about 15 minutes (if using 50Hz, 40,000 frames). The speed of image reconstruction following data acquisition depends on the total number of localized molecules, localization algorithm, the threshold to identify single fluorescent emitters, and performance of the computer. For example, if single molecule localization algorithm (Integrated Gaussian function, least square optimization method) is used, the time of image reconstruction using ThunderSTORM on a single-core Intel i7–6700 CPU is about 1600 localization events per second; if multi-emitter Gaussian algorithm is used for a high-density localization case, time of image reconstruction (based on ThunderSTORM, multi-emitter enabled) on the same computer is about 74 localization events per second.
Figure 8.
Effect of overlapping molecules on the localization accuracy. (A) Simulated raw image with overlapping molecules, defined as the molecules with a distance less than the diameter of the PSF. (B) The localized positions exhibit a significant bias of over 10 nm, compared to the ground truth. Total photon number of a single fluorescent emitter: 5000. Pixel size of the raw image: 100 nm.
Significance Statement.
Recent advance in super-resolution (SR) fluorescence microscopy has revolutionized biological imaging and offers new possibilities of visualizing molecular-scale information that was invisible before, as recognized by 2014 Nobel Prize in Chemistry. Among different approaches to achieve the sub-diffraction-limited resolution of optical microscopy, stochastic optical reconstruction microscopy (STORM) can reach a resolution down to 20 nm, one of the best among all SR techniques. Unlike most optical imaging techniques, STORM is based on localization of sequentially activated single fluorescent emitters at a nanometer precision and requires a synergy from three critical aspects – optimized labeling of photo-switchable fluorophores, data acquisition and image reconstruction – to obtain a high-quality and reproducible super-resolution image. A compromise in any aspect can lead to significant image artifacts.
Acknowledgments
We acknowledge the funding support from National Institute of Health Grant Number R01EB016657 and R01CA185363.
LITERATURE CITED
- Bates M, Huang B, Dempsey GT, Zhuang X. Multicolor super-resolution imaging with photo-switchable fluorescent probes. Science. 2007;317:1749–1753. doi: 10.1126/science.1146598. Available at: http://www.ncbi.nlm.nih.gov/pmc/articles/PMC2633025/pdf/nihms-88394.pdf. [DOI] [PMC free article] [PubMed] [Google Scholar]
- Bates M, Jones SA, Zhuang X. Preparation of photoswitchable labeled antibodies for STORM imaging. Cold Spring Harb Protoc. 2013a;2013:540–541. doi: 10.1101/pdb.prot075168. Available at: http://www.ncbi.nlm.nih.gov/pubmed/23734027. [DOI] [PubMed] [Google Scholar]
- Bates M, Jones SA, Zhuang X. Stochastic optical reconstruction microscopy (STORM): a method for superresolution fluorescence imaging. Cold Spring Harb Protoc. 2013b;2013:498–520. doi: 10.1101/pdb.top075143. Available at: http://www.ncbi.nlm.nih.gov/pubmed/23734025. [DOI] [PubMed] [Google Scholar]
- Betzig E, Patterson GH, Sougrat R, Lindwasser OW, Olenych S, Bonifacino JS, Davidson MW, Lippincott-Schwartz J, Hess HF. Imaging intracellular fluorescent proteins at nanometer resolution. Science. 2006;313:1642–1645. doi: 10.1126/science.1127344. [DOI] [PubMed] [Google Scholar]
- Dani A, Huang B, Bergan J, Dulac C, Zhuang X. Superresolution Imaging of Chemical Synapses in the Brain. Neuron. 2010;68:843–856. doi: 10.1016/j.neuron.2010.11.021. Available at: http://dx.doi.org/10.1016/j.neuron.2010.11.021. [DOI] [PMC free article] [PubMed] [Google Scholar]
- Dempsey GT, Bates M, Kowtoniuk WE, Liu DR, Tsien RY, Zhuang X. Photoswitching mechanism of cyanine dyes. Journal of the American Chemical Society. 2009;131:18192–18193. doi: 10.1021/ja904588g. [DOI] [PMC free article] [PubMed] [Google Scholar]
- Dempsey GT, Vaughan JC, Chen KH, Bates M, Zhuang X. Evaluation of fluorophores for optimal performance in localization-based super-resolution imaging. Nat Methods. 2011;8:1027–1036. doi: 10.1038/nmeth.1768. Available at: http://www.ncbi.nlm.nih.gov/pubmed/22056676. [DOI] [PMC free article] [PubMed] [Google Scholar]
- Douglass KM, Sieben C, Archetti A, Lambert A, Manley S. Super-resolution imaging of multiple cells by optimized flat-field epi-illumination. Nature Photonics. 2016 doi: 10.1038/nphoton.2016.200. Available at: http://www.nature.com/doifinder/10.1038/nphoton.2016.200. [DOI] [PMC free article] [PubMed]
- Enderlein J. Direct Stochastic Optical Reconstruction Microscopy (dSTORM) Advanced Fluorescence Microscopy. 2015:263–276. doi: 10.1007/978-1-4939-2080-8_14. [DOI] [PubMed] [Google Scholar]
- Galland R, Grenci G, Aravind A, Viasnoff V, Studer V, Sibarita JB. 3D high- and super-resolution imaging using single-objective SPIM. Nature methods. 2015;12:641–4. doi: 10.1038/nmeth.3402. [DOI] [PubMed] [Google Scholar]
- Gebhardt JCM, Suter DM, Roy R, Zhao ZW, Chapman AR, Basu S, Maniatis T, Xie XS. Single-molecule imaging of transcription factor binding to DNA in live mammalian cells. Nature methods. 2013;10:421–6. doi: 10.1038/nmeth.2411. [DOI] [PMC free article] [PubMed] [Google Scholar]
- Gustafsson MG. Surpassing the lateral resolution limit by a factor of two using structured illumination microscopy. J Microsc. 2000;198:82–87. doi: 10.1046/j.1365-2818.2000.00710.x. Available at: http://www.ncbi.nlm.nih.gov/pubmed/10810003. [DOI] [PubMed] [Google Scholar]
- Heilemann M, van de Linde S, Schuttpelz M, Kasper R, Seefeldt B, Mukherjee A, Tinnefeld P, Sauer M. Subdiffraction-resolution fluorescence imaging with conventional fluorescent probes. Angew Chem Int Ed Engl. 2008;47:6172–6176. doi: 10.1002/anie.200802376. Available at: http://www.ncbi.nlm.nih.gov/pubmed/18646237. [DOI] [PubMed] [Google Scholar]
- Hell SW, Wichmann J. Breaking the Diffraction Resolution Limit By Stimulated-Emission - Stimulated-Emission-Depletion Fluorescence Microscopy. Optics Letters. 1994;19:780–782. doi: 10.1364/ol.19.000780. [DOI] [PubMed] [Google Scholar]
- Hess ST, Girirajan TPK, Mason MD. Ultra-High Resolution Imaging by Fluorescence Photoactivation Localization Microscopy. Biophysical Journal. 2006;91:4258–4272. doi: 10.1529/biophysj.106.091116. [DOI] [PMC free article] [PubMed] [Google Scholar]
- Holden SJ, Uphoff S, Kapanidis AN. DAOSTORM: an algorithm for high- density super-resolution microscopy. Nature methods. 2011;8:279–280. doi: 10.1038/nmeth0411-279. [DOI] [PubMed] [Google Scholar]
- Hoogendoorn E, Crosby KC, Leyton-Puig D, Breedijk RMP, Jalink K, Gadella TWJ, Postma M. The fidelity of stochastic single-molecule super-resolution reconstructions critically depends upon robust background estimation. Scientific reports. 2014;4:3854. doi: 10.1038/srep03854. [DOI] [PMC free article] [PubMed] [Google Scholar]
- Huang F, Hartwich TM, Rivera-Molina FE, Lin Y, Duim WC, Long JJ, Uchil PD, Myers JR, Baird MA, Mothes W, et al. Video-rate nanoscopy using sCMOS camera-specific single-molecule localization algorithms. Nat Methods. 2013;10:653–658. doi: 10.1038/nmeth.2488. Available at: http://www.ncbi.nlm.nih.gov/pmc/articles/PMC3696415/pdf/nihms475969.pdf. [DOI] [PMC free article] [PubMed] [Google Scholar]
- Huang F, Schwartz SL, Byars JM, Lidke KA. Simultaneous multiple-emitter fitting for single molecule super-resolution imaging. Biomedical optics express. 2011;2:1377–1393. doi: 10.1364/BOE.2.001377. [DOI] [PMC free article] [PubMed] [Google Scholar]
- Lambert TJ, Waters JC. Navigating challenges in the application of superresolution microscopy. The Journal of Cell Biology. 2016:1–11. doi: 10.1083/jcb.201610011. [DOI] [PMC free article] [PubMed] [Google Scholar]
- Lee SH, Baday M, Tjioe M, Simonson PD, Zhang R, Cai E, Selvin PR. Using fixed fiduciary markers for stage drift correction. Optics express. 2012;20:12177–83. doi: 10.1364/OE.20.012177. [DOI] [PMC free article] [PubMed] [Google Scholar]
- van de Linde S, Loschberger A, Klein T, Heidbreder M, Wolter S, Heilemann M, Sauer M. Direct stochastic optical reconstruction microscopy with standard fluorescent probes. Nat Protoc. 2011;6:991–1009. doi: 10.1038/nprot.2011.336. Available at: http://www.ncbi.nlm.nih.gov/pubmed/21720313. [DOI] [PubMed] [Google Scholar]
- Ma H, Long F, Zeng S, Huang ZL. Fast and precise algorithm based on maximum radial symmetry for single molecule localization. Opt Lett. 2012;37:2481–2483. doi: 10.1364/OL.37.002481. [DOI] [PubMed] [Google Scholar]
- Ma H, Xu J, Jin J, Gao Y, Lan L, Liu Y. Fast and Precise 3D Fluorophore Localization based on Gradient Fitting. Scientific Reports. 2015;5:14335. doi: 10.1038/srep14335. [DOI] [PMC free article] [PubMed] [Google Scholar]
- Mlodzianoski MJ, Schreiner JM, Callahan SP, Smolková K, Dlasková A, Šantorová J, Ježek P, Bewersdorf J, Je P. Sample drift correction in 3D fluorescence photoactivation localization microscopy. Optics Express. 2011;19:15009. doi: 10.1364/OE.19.015009. [DOI] [PubMed] [Google Scholar]
- Mortensen KI, Churchman LS, Spudich Ja, Flyvbjerg H. Optimized localization analysis for single-molecule tracking and super-resolution microscopy. Nature methods. 2010;7:377–381. doi: 10.1038/nmeth.1447. [DOI] [PMC free article] [PubMed] [Google Scholar]
- Mukamel EA, Babcock H, Zhuang X. Statistical deconvolution for superresolution fluorescence microscopy. Biophysical Journal. 2012;102:2391–2400. doi: 10.1016/j.bpj.2012.03.070. [DOI] [PMC free article] [PubMed] [Google Scholar]
- Nahidiazar L, Agronskaia AV, Broertjes J, van den Broek B, Jalink K, Vogelsang J, Kasper R, Steinhauer C, Person B, Heilemann M, et al. Optimizing Imaging Conditions for Demanding Multi-Color Super Resolution Localization Microscopy. [Accessed July 20, 2016];PLOS ONE. 2016 11:e0158884. doi: 10.1371/journal.pone.0158884. Available at: http://dx.plos.org/10.1371/journal.pone.0158884. [DOI] [PMC free article] [PubMed] [Google Scholar]
- Nieuwenhuizen RPJ, Lidke Ka, Bates M, Puig DL, Grünwald D, Stallinga S, Rieger B. Measuring image resolution in optical nanoscopy. Nature methods. 2013;10:557–62. doi: 10.1038/nmeth.2448. [DOI] [PMC free article] [PubMed] [Google Scholar]
- Olivier N, Keller D, Gönczy P, Manley S. Resolution Doubling in 3D-STORM Imaging through Improved Buffers. PLoS ONE. 2013;8:e69004. doi: 10.1371/journal.pone.0069004. Available at: http://www.ncbi.nlm.nih.gov/pubmed/23874848. [DOI] [PMC free article] [PubMed] [Google Scholar]
- Ovesný M, Křížek P, Borkovec J, Švindrych Z, Hagen GM. ThunderSTORM: A comprehensive ImageJ plug-in for PALM and STORM data analysis and super-resolution imaging. Bioinformatics. 2014;30:2389–2390. doi: 10.1093/bioinformatics/btu202. [DOI] [PMC free article] [PubMed] [Google Scholar]
- Parthasarathy R. Rapid, accurate particle tracking by calculation of radial symmetry centers. Nature Methods. 2012;9:724–726. doi: 10.1038/nmeth.2071. [DOI] [PubMed] [Google Scholar]
- Pertsinidis A, Zhang Y, Chu S. Subnanometre single-molecule localization, registration and distance measurements. Nature. 2010;466:647–651. doi: 10.1038/nature09163. [DOI] [PubMed] [Google Scholar]
- Quan T, Li P, Long F, Zeng S, Luo Q, Hedde PN, Nienhaus GU, Huang ZL. Ultra-fast, high-precision image analysis for localization-based super resolution microscopy. Optics express. 2010a;18:11867–11876. doi: 10.1364/OE.18.011867. [DOI] [PubMed] [Google Scholar]
- Quan T, Zeng S, Huang ZL. Localization capability and limitation of electron-multiplying charge-coupled, scientific complementary metal-oxide semiconductor, and charge-coupled devices for superresolution imaging. Journal of biomedical optics. 2010b;15:66005. doi: 10.1117/1.3505017. [DOI] [PubMed] [Google Scholar]
- Quan T, Zhu H, Liu X, Liu Y, Ding J, Zeng S, Huang ZL. High-density localization of active molecules using Structured Sparse Model and Bayesian Information Criterion. Optics Express. 2011;19:16963. doi: 10.1364/OE.19.016963. [DOI] [PubMed] [Google Scholar]
- Ricci MA, Manzo C, García-Parajo MF, Lakadamyali M, Cosma MP. Chromatin fibers are formed by heterogeneous groups of nucleosomes in vivo. Cell. 2015;160:1145–1158. doi: 10.1016/j.cell.2015.01.054. Available at: http://www.ncbi.nlm.nih.gov/pubmed/25768910. [DOI] [PubMed] [Google Scholar]
- Rust MJ, Bates M, Zhuang XW. Sub-diffraction-limit imaging by stochastic optical reconstruction microscopy (STORM) Nat Methods. 2006;3:793–795. doi: 10.1038/nmeth929. Available at: http://www.ncbi.nlm.nih.gov/pmc/articles/PMC2700296/pdf/nihms-88406.pdf. [DOI] [PMC free article] [PubMed] [Google Scholar]
- Sage D, Kirshner H, Pengo T, Stuurman N, Min J, Manley S, Unser M. Quantitative evaluation of software packages for single-molecule localization microscopy. Nature Methods. 2015;12:1–12. doi: 10.1038/nmeth.3442. Available at: http://www.ncbi.nlm.nih.gov/pubmed/26076424. [DOI] [PubMed] [Google Scholar]
- Schneider CA, Rasband WS, Eliceiri KW. NIH Image to ImageJ: 25 years of image analysis. [Accessed January 12, 2017];Nature Methods. 2012 9:671–675. doi: 10.1038/nmeth.2089. Available at: http://www.nature.com/doifinder/10.1038/nmeth.2089. [DOI] [PMC free article] [PubMed] [Google Scholar]
- Smith CS, Joseph N, Rieger B, Lidke KA. Fast, single-molecule localization that achieves theoretically minimum uncertainty. Nature methods. 2010;7:373–5. doi: 10.1038/nmeth.1449. [DOI] [PMC free article] [PubMed] [Google Scholar]
- Tokunaga M, Imamoto N, Sakata-Sogawa K. Highly inclined thin illumination enables clear single-molecule imaging in cells. Nature methods. 2008;5:159–61. doi: 10.1038/nmeth1171. [DOI] [PubMed] [Google Scholar]
- Wang Y, Schnitzbauer J, Hu Z, Li X, Cheng Y, Huang ZL, Huang B. Localization events-based sample drift correction for localization microscopy with redundant cross-correlation algorithm. Optics express. 2014;22:15982–91. doi: 10.1364/OE.22.015982. [DOI] [PMC free article] [PubMed] [Google Scholar]
- Wolter S, Löschberger A, Holm T, Aufmkolk S, Dabauvalle MC, van de Linde S, Sauer M. rapidSTORM: accurate, fast open-source software for localization microscopy. Nature methods. 2012a;9:1040–1. doi: 10.1038/nmeth.2224. [DOI] [PubMed] [Google Scholar]
- Wolter S, Loschberger A, Holm T, Aufmkolk S, Dabauvalle MC, van de Linde S, Sauer M. rapidSTORM: accurate, fast open-source software for localization microscopy. Nat Methods. 2012b;9:1040–1041. doi: 10.1038/nmeth.2224. [DOI] [PubMed] [Google Scholar]
- York AG, Ghitani A, Vaziri A, Davidson MW, Shroff H. Confined activation and subdiffractive localization enables whole-cell PALM with genetically expressed probes. Nat Methods. 2011;8:327–333. doi: 10.1038/nmeth.1571. Available at: http://www.ncbi.nlm.nih.gov/pmc/articles/PMC3073501/pdf/nihms266587.pdf. [DOI] [PMC free article] [PubMed] [Google Scholar]
- Zhu L, Zhang W, Elnatan D, Huang B. Faster STORM using compressed sensing. Nature methods. 2012;9:721–723. doi: 10.1038/nmeth.1978. [DOI] [PMC free article] [PubMed] [Google Scholar]


