Significance
Alzheimer’s disease (AD) is the most common cause of dementia and is a major public health problem for which there is currently no disease-modifying treatment. There is an urgent need for greater understanding of the molecular mechanisms underlying neurodegeneration in patients to create better therapeutic options. Recently, genetic studies uncovered novel AD risk variants in the microglial receptor, triggering receptor expressed on myeloid cells 2 (TREM2). Previous studies suggested that loss of TREM2 function worsens amyloid-β (Aβ) plaque-related toxicity. In contrast, we observe TREM2 deficiency mitigates neuroinflammation and protects against brain atrophy in the context of tau pathology. These findings indicate dual roles for TREM2 and microglia in the context of amyloid versus tau pathology, which are important to consider for potential treatments targeting TREM2.
Keywords: TREM2, Alzheimer’s disease, neurodegeneration, neuroinflammation, tau
Abstract
Variants in the gene encoding the triggering receptor expressed on myeloid cells 2 (TREM2) were recently found to increase the risk for developing Alzheimer’s disease (AD). In the brain, TREM2 is predominately expressed on microglia, and its association with AD adds to increasing evidence implicating a role for the innate immune system in AD initiation and progression. Thus far, studies have found TREM2 is protective in the response to amyloid pathology while variants leading to a loss of TREM2 function impair microglial signaling and are deleterious. However, the potential role of TREM2 in the context of tau pathology has not yet been characterized. In this study, we crossed Trem2+/+ (T2+/+) and Trem2−/− (T2−/−) mice to the PS19 human tau transgenic line (PS) to investigate whether loss of TREM2 function affected tau pathology, the microglial response to tau pathology, or neurodegeneration. Strikingly, by 9 mo of age, T2−/−PS mice exhibited significantly less brain atrophy as quantified by ventricular enlargement and preserved cortical volume in the entorhinal and piriform regions compared with T2+/+PS mice. However, no TREM2-dependent differences were observed for phosphorylated tau staining or insoluble tau levels. Rather, T2−/−PS mice exhibited significantly reduced microgliosis in the hippocampus and piriform cortex compared with T2+/+PS mice. Gene expression analyses and immunostaining revealed microglial activation was significantly attenuated in T2−/−PS mice, and there were lower levels of inflammatory cytokines and astrogliosis. These unexpected findings suggest that impairing microglial TREM2 signaling reduces neuroinflammation and is protective against neurodegeneration in the setting of pure tauopathy.
Alzheimer’s disease (AD) is the most prevalent form of dementia and is thought to be caused by accumulation of two different proteins in the brain. Amyloid-β (Aβ) aggregates form extracellular plaques, while hyperphosphorylated tau (p-tau) is present in intracellular neurofibrillary tangles (1). Microgliosis, or activation of the innate immune cells in the brain, is an additional pathological signature routinely found in regions affected by abundant plaques and tangles (2, 3). Chronic microgliosis has long been hypothesized to influence accumulation of Aβ and tau, contribute to neuronal damage, and ultimately exacerbate neurodegeneration (4, 5). However, studies over the past two decades have reported both beneficial and detrimental effects of microglia in AD (4, 5). Thus, the role of microglia and inflammation in disease onset and progression remains poorly understood.
The discovery that rare coding variants in the triggering receptor expressed on myeloid cells 2 (TREM2) are associated with a twofold to fourfold increased risk for developing sporadic, late-onset AD further implicates the role of microglia in AD (6, 7). TREM2 is specifically expressed in microglia in the brain and has been shown to impact a multitude of functions including activation, inflammation, phagocytosis, proliferation, and survival (8). Although the exact molecular effects of AD-associated risk variants in TREM2 are still being investigated, the most common position 47 arginine-to-histidine (R47H) variant appears to reduce binding to anionic phospholipids, including binding to apolipoproteins such as ApoE, and reduce lipid-induced TREM2 activity (9–14). The exact physiological ligand(s) of TREM2 are currently unknown, but it is this thought that decreased ligand binding results in a loss of microglial functions, which consequently increases risk for the development of AD (8).
AD pathology is characterized first by the appearance of Aβ plaques followed by the spread of neurofibrillary tau tangles from the transentorhinal region, to the hippocampus, and into the neocortex (15). Several studies have investigated the effects of TREM2 on plaque deposition and associated pathologies (14, 16–20). One consistent observation has been that reduction or loss of TREM2 function reduces the number of plaque-associated microglia. However, the effects of TREM2 deficiency on overall plaque load have been variable (8). Interestingly, two recent reports found that, despite no difference in the number of plaques, alterations in plaque composition and morphology corresponded to increased neuritic dystrophy and p-tau accumulation around plaques in Trem2-deficient mouse models and in human R47H variant carriers (19, 20). Therefore, TREM2 is currently thought to be protective in the response to amyloid pathology, while variants leading to a loss of TREM2 function impair microglia signaling and are deleterious. However, the potential role of TREM2 in the context of tau pathology has not yet been characterized.
In this study, we aimed to investigate whether TREM2 affected tau pathology, the microglial response to tau pathology, or neurodegeneration. Surprisingly, despite finding no significant changes in tau accumulation, we observed attenuated brain atrophy together with reduced microglial activation in PS19 human tau (htau) transgenic mice lacking TREM2. Collectively, our data demonstrate that TREM2 mitigates the microglial response to tau pathology or damage induced by tau aggregates, which protects against neurodegeneration.
Results
TREM2 Deficiency in PS19 Mice Attenuates Tau-Mediated Neurodegeneration.
To investigate the effects of TREM2 on tauopathy, we crossed Trem2+/+ (T2+/+) and Trem2−/− (T2−/−) mice (21) to PS19 tau-transgenic mice to generate T2+/+PS and T2−/−PS mice. PS19 mice express an htau transgene containing a P301S mutation that is causative for a familial form of frontal temporal dementia (FTD). These mice acquire substantial tangle deposition and gliosis by 9 mo of age (22). Additionally, PS19 mice develop gross neurodegeneration culminating in severe brain atrophy that can be visibly observed through enlargement of the lateral ventricles and thinning of hippocampal and certain cortical regions (22). In this study, we only examined male mice as there is significantly more tau pathology and neurodegeneration in male versus female PS19 mice (23).
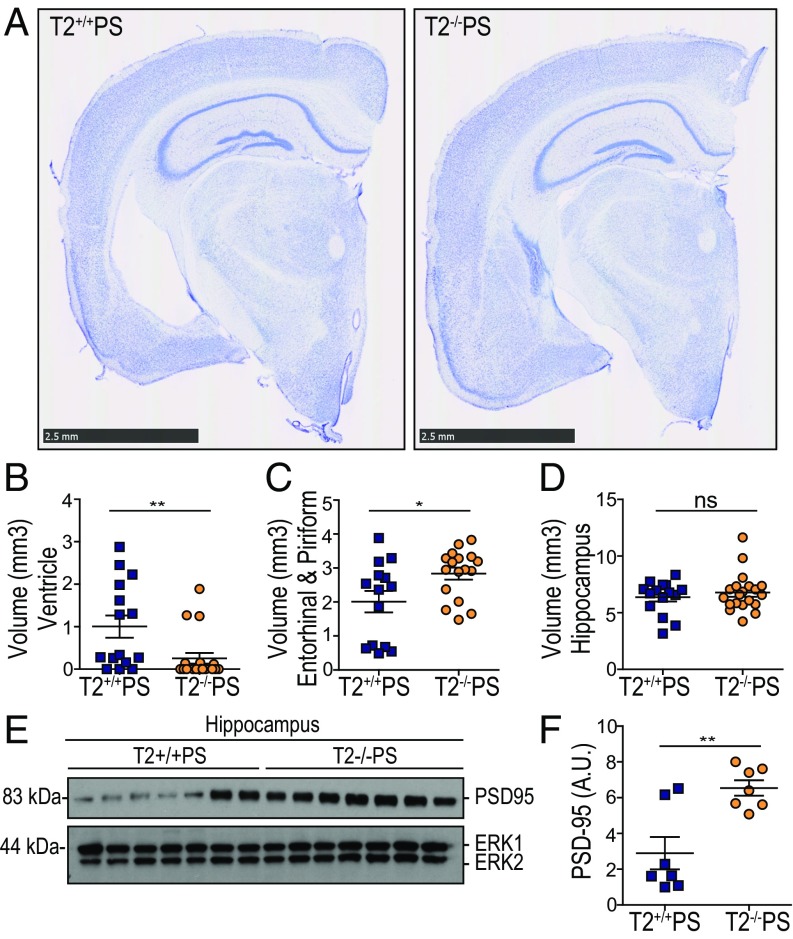
We initially observed a striking and unexpected attenuation of neurodegeneration in T2−/−PS compared with T2+/+PS mice (Fig. 1A). By performing a stereological assessment, we determined that there was significantly less ventricular enlargement in T2−/−PS mice compared with T2+/+PS littermates (Fig. 1 A and B). Notably, there is variability in that mice appear to have substantial ventricular enlargement (ventricles >1 mm3) or not, with ∼47% of T2+/+PS mice showing markedly enlarged ventricles as opposed to ∼16% of T2−/−PS mice (Fig. 1B). This finding corresponded with significant preservation of the entorhinal and piriform cortex volume in T2−/−PS mice (Fig. 1 A and C). While no significant changes in hippocampal volume were observed (Fig. 1 A and D), levels of the synaptic protein, PSD-95, were significantly lower in T2+/+PS mice (Fig. 1 E and F), indicating more synaptic degeneration in this region compared with T2−/−PS mice. The reduced brain atrophy and preservation of PSD-95 in T2−/−PS mice suggests that loss of TREM2 function is neuroprotective in the setting of tauopathy.
Fig. 1.
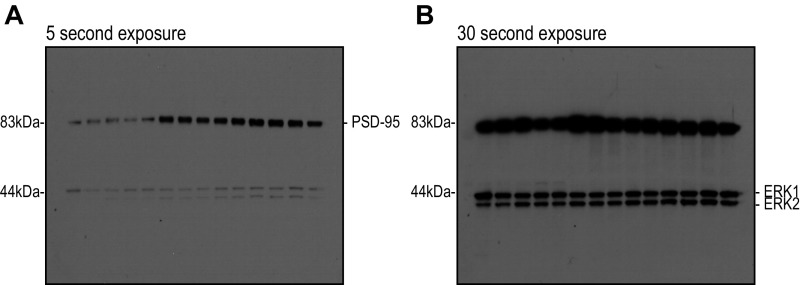
TREM2 deficiency attenuates neurodegeneration in PS19 mice. (A) Representative images of Nissl staining from T2+/+PS and T2−/−PS mice. (Scale bars, 2.5 mm.) Quantification of the average volume of the (B) ventricles (P = 0.0034; T2+/+PS, n = 15; T2−/−PS, n = 19), (C) entorhinal and piriform cortex (P = 0.0232; T2+/+PS, n = 14; T2−/−PS, n = 17), and (D) hippocampus (P = 0.4589; T2+/+PS, n = 15; T2−/−PS, n = 20). (E) Immunoblot analysis from hippocampal RIPA lysates of PDS-95 in T2+/+PS and T2−/−PS mice. ERK served as a loading control. (F) Quantification of the relative protein levels for PSD-95 to the internal control, ERK1. Blots shown in E are cropped. Full-length blots are presented in Fig. S1. A Mann–Whitney test was used to determine statistical significance for ventricular volume due to the nonparametric data set. For all other graphs, significance was determined by an unpaired, two-tailed Student’s t test. Significance was defined as *P < 0.05 and **P < 0.01.
Fig. S1.
Full scans of immunoblot data. Unedited film from PSD-95 (∼83-kDa) and ERK1/2 (∼44- and 42-kDa) immunoblots.
TREM2 Deficiency Does Not Alter Phosphorylated or Insoluble Tau Levels.
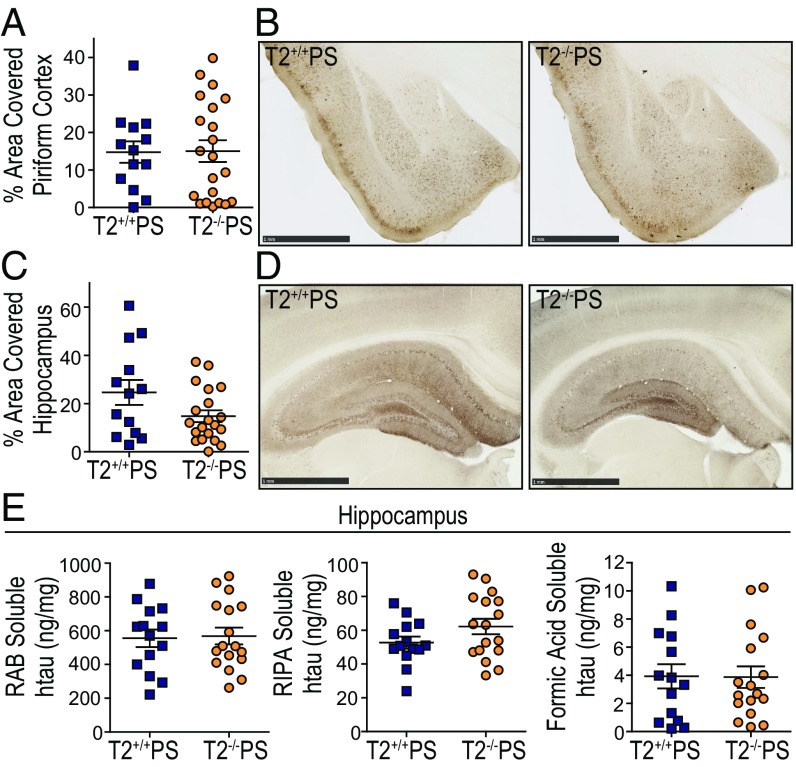
To investigate whether the preservation of brain volume in T2−/−PS mice was due to a reduction in overall tau deposition, we assessed the accumulation of p-tau and insoluble tau aggregates in T2+/+PS and T2−/−PS mice. The tau monoclonal antibody, AT8, recognizes a double phosphorylation epitope (pS202, pT205) and has been shown to primarily stain intraneuronal and extraneuronal neurofibrillary tangles associated with Braak stages IV, V, and VI (24). Staining with biotinylated AT8 did not reveal any significant differences in p-tau deposition between 9-mo-old T2+/+PS and T2−/−PS mice in the piriform cortex (Fig. 2 A and B) or hippocampus (Fig. 2 C and D). To further examine tau aggregation in these mice, we performed a sequential biochemical extraction of hippocampal brain tissue. Samples were first extracted in a high-salt RAB buffer, the subsequent pellet was resuspended in a detergent radioimmunoprecipitation assay (RIPA) buffer, and the final pellet was solubilized in 70% formic acid (FA). RAB and RIPA fractions contain more soluble tau species while the 70% FA fraction contains insoluble, tau aggregates. The concentration of tau in each fraction was measured using an htau-specific ELISA. We observed no significant differences in tau levels in any fraction between T2+/+PS and T2−/−PS mice (Fig. 2E). These data indicate that TREM2 deficiency does not result in obvious changes to p-tau accumulation or tau solubility despite the attenuated neurodegenerative phenotype.
Fig. 2.
No differences were observed in tau phosphorylation or solubility in 9-mo-old T2+/+PS and T2−/−PS mice. Quantification of the percent area covered by biotinylated AT8 staining in the (A) piriform cortex (P = 0.9499; T2+/+PS, n = 13; T2−/−PS, n = 21) and (B) hippocampus (P = 0.0652; T2+/+PS, n = 13; T2−/−PS, n = 20). Representative images of biotinylated AT8 p-tau staining in the (C) piriform cortex and (D) hippocampus from T2+/+PS and T2−/−PS mice. (Scale bars, 1 mm.) (E) Tau solubility in the hippocampus was quantified using a human-tau (htau) specific sandwich ELISA to measure (Left) RAB-soluble htau (P = 0.8562; T2+/+PS, n = 14; T2−/−PS, n = 17), (Center) RIPA-soluble htau (P = 0.1233; T2+/+PS, n = 14; T2−/−PS, n = 17), and (Right) FA-soluble htau levels (P = 0.9584; T2+/+PS, n = 14; T2−/−PS, n = 17). Data are presented as mean ± SEM. Significance was determined using an unpaired, two-tailed Student’s t test.
Microgliosis Is Impaired in T2−/−PS Mice in the Presence of Tauopathy.
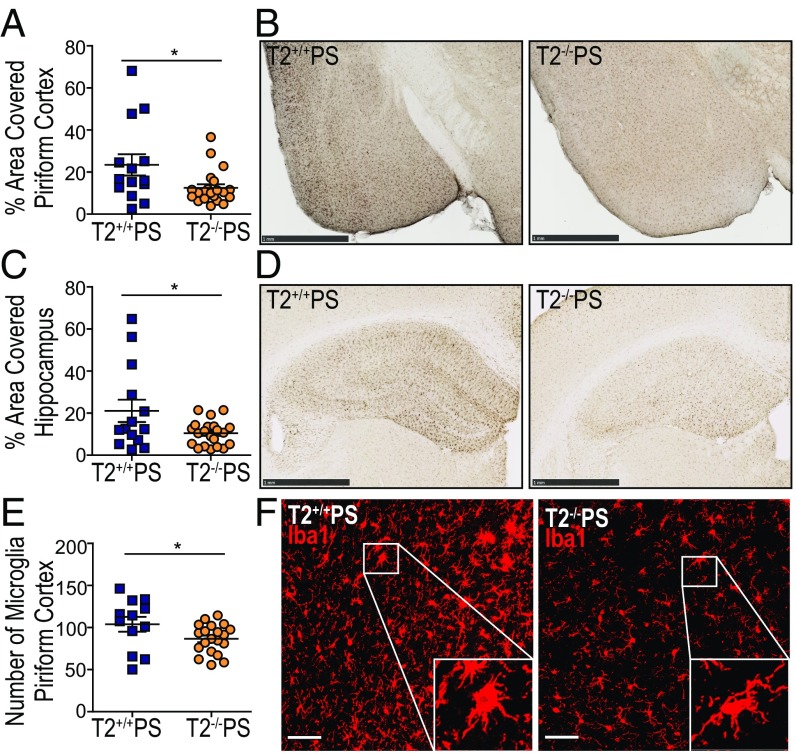
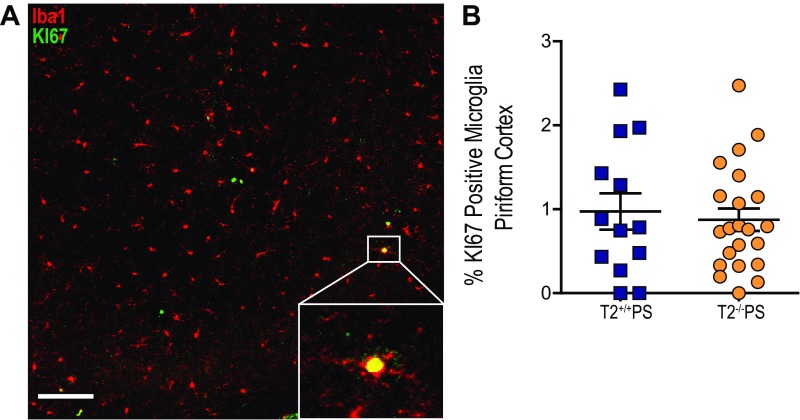
Given that the lack of Trem2 expression did not significantly affect p-tau or insoluble tau levels in PS19 mice, we hypothesized that attenuation of the neurodegenerative phenotype in these mice may be attributed to the microglial response to tau accumulation. Reactive microglia have been described in brain regions affected by a high density of tau tangles both in AD as well as in other primary tauopathies such as FTD (2, 5, 25). Staining for the microglial marker, Iba1, revealed significantly reduced microgliosis in the piriform cortex (Fig. 3 A and B) and hippocampus (Fig. 3 C and D) of T2−/−PS mice compared with T2+/+PS mice. To further assess these findings, we quantified the total number of immunofluorescence-labeled Iba1-positive microglial cell bodies by confocal microscopy and found significantly fewer microglia in the piriform cortex of T2−/−PS mice (Fig. 3E). Additionally, we observed that microglia in T2+/+PS mice were amoeboid, consistent with a more activated phenotype, whereas microglia in T2−/−PS mice appeared ramified (Fig. 3F). Costaining with the proliferative cell marker, KI-67 (19), did not reveal differences between T2+/+PS and T2−/−PS mice (Fig. S2). There were very few proliferative microglia in either group (on average, approximately two microglia from two sections per mouse for both genotypes). Therefore, microglial proliferation does not appear to account for the decrease in the total number of microglia observed in T2−/−PS mice.
Fig. 3.
TREM2 deficiency reduces microgliosis in PS19 mice. Quantification of the percent area covered by Iba1 staining in the (A) piriform cortex (P = 0.0242; T2+/+PS, n = 14; T2−/−PS, n = 21) and (B) hippocampus (P = 0.0266; T2+/+PS, n = 14; T2−/−PS, n = 21). Representative images of Iba1 staining in the (C) piriform cortex and (D) hippocampus from T2+/+PS and T2−/−PS mice. (Scale bars, 1 mm.) (E) Quantification of immunofluorescence staining for Iba1-positive cell bodies in the piriform cortex (P = 0.0478; T2+/+PS, n = 12; T2−/−PS, n = 20). (F) Representative images of Iba1 immunofluorescence staining in the piriform cortex. Microglia in T2+/+PS mice display a more ramified phenotype as opposed to in T2−/−PS mice where microglia appear quiescent. Images represent maximum-intensity projections of z stacks. (Scale bars, 50 µm.) Data are mean ± SEM. Significance was determined using an unpaired, two-tailed Student’s t test with *P < 0.05.
Fig. S2.
No effect of TREM2 deficiency on KI-67–positive microglia in the piriform cortex. (A) Quantification of KI-67–positive microglia in the piriform cortex (P = 0.6844; T2+/+PS: 0.9725 ± 0.2171, n = 13; T2−/−PS: 0.8738 ± 0.2406, n = 22). (B) Representative image of KI-67–positive microglia. Images represent maximum-intensity projections of z stacks. (Scale bars: 50 µm.) Data are mean ± SEM. Significance was determined using an unpaired, two-tailed Student’s t test with *P < 0.05.
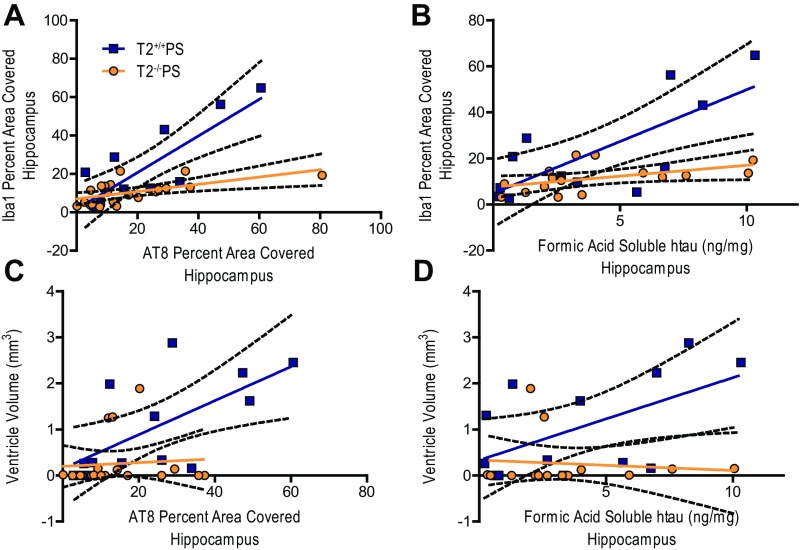
The amount of reactive gliosis in human AD patient brains has been reported to more closely correlate with the degree of neurofibrillary tangle pathology as opposed to amyloid plaque burden (26, 27). Indeed, we observed that microgliosis, as measured by Iba1 staining in T2+/+PS mice, significantly correlated with AT8 p-tau staining (Fig. S3A) and the amount of FA-soluble htau (Fig. S3B) in the hippocampus. Interestingly, these correlations were blunted in the absence of TREM2 (Fig. S3 A and B). Likewise, the amount of brain atrophy, indicated by increased ventricular volume, significantly correlated with the degree of p-tau staining (Fig. S3C) and amount of FA-soluble htau (Fig. S3D) in T2+/+PS mice. However, these correlations were ablated in T2−/−PS mice (Fig. S3 C and D). Since the p-tau and insoluble tau burden were not significantly different in T2+/+PS and T2−/−PS mice, this suggests that TREM2 deficiency impairs the microglial response to tau accumulation, which protects against brain atrophy.
Fig. S3.
Correlations between tau pathology, microgliosis, and degeneration in the hippocampus of T2+/+PS and T2−/−PS mice. Significant correlations were observed between Iba1 microglial staining and (A) AT8 p-tau staining (T2+/+PS: n = 12, **P < 0.01, R2 = 0.6743; T2−/−PS: n = 21, **P < 0.01, R2 = 0.3392) and (B) FA-soluble htau levels (T2+/+PS: n = 12, **P < 0.01, R2 = 0.5560; T2−/−PS: n = 16, *P < 0.05, R2 = 0.2475) in both groups, but were stronger in T2+/+PS mice. Additionally, significant correlations for ventricular size and (C) AT8 p-tau staining (T2+/+PS: n = 13, *P < 0.05, R2 = 0.4312; T2−/−PS: n = 19, not significant P > 0.05, R2 = 0.0064) and (D) FA-soluble htau levels (T2+/+PS: n = 13, *P < 0.05, R2 = 0.3185; T2−/−PS: n = 14, not significant P > 0.05, R2 = 0.0114) were observed for T2+/+PS but not T2−/−PS mice. Solid, colored lines represent the best-fit line with a linear regression, and black, dashed lines represent 95% confidence intervals.
Nine-Month-Old T2−/−PS Mice Have Decreased Microglial Activation and Expression of Inflammatory Genes.
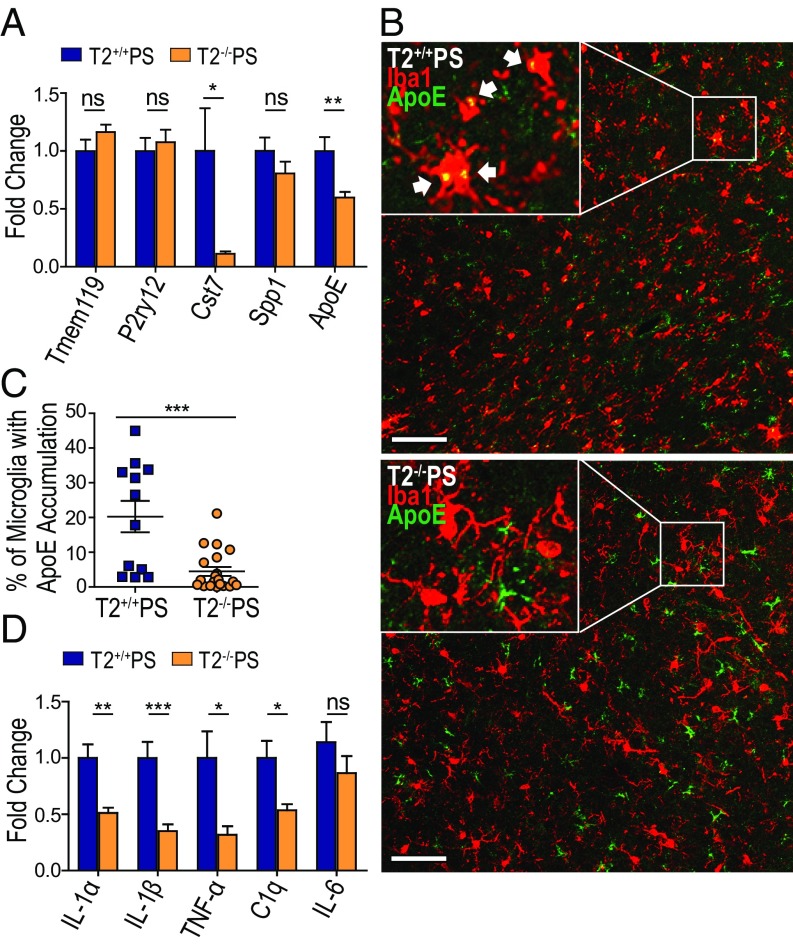
We further wanted to examine whether the loss of TREM2 influenced microglial homeostasis and expression of proinflammatory genes in T2−/−PS mice despite equivalent levels of tauopathy. Quantitative RT-PCR (qRT-PCR) was performed on cortical tissue from T2+/+PS and T2−/−PS mice to assess the expression of several genes that have been reported as homeostatic (Tmem119 and P2ry12) versus activated (Cst7, Spp1, and Apoe) microglia markers (28–31) (Fig. 4A). Only Apoe and Cst7 transcripts were significantly altered and were lower in T2−/−PS mice, indicating less microglial activation. While Cst7 is a microglia-specific gene (32), Apoe is expressed by both astrocytes and microglia in the brain (33). Increased expression of Apoe in microglia has been recently reported in several neurodegenerative disease models as an indicator of microglial activation in response to amassing pathologies and subsequent cell damage (28–31). Therefore, we investigated whether accrual of tau pathology in the piriform cortex altered accumulation of ApoE specifically in microglia. Coimmunostaining revealed ApoE-positive puncta colocalized within Iba1-positive microglial cell bodies (Fig. 4B). Furthermore, the percentage of microglia displaying this phenotype was significantly lower in T2−/−PS mice (Fig. 4C). These data indicate an overall reduction in microglial activation in the absence of TREM2.
Fig. 4.
Decreased microglial activation and inflammatory gene expression in T2−/−PS mice. (A) Expression of microglial homeostatic (Tmem119: P = 0.1755; and P2ry12: P = 0.6323) and activated markers in the cortex of T2+/+PS and T2−/−PS mice (Cst7: P = 0.0274; Spp1: P = 0.2256; ApoE: P = 0.0088). (B) Representative images of ApoE-positive puncta in Iba1-positive cell bodies from coimmunofluorescence staining in the piriform cortex of T2+/+PS and T2−/−PS mice. Images represent maximum-intensity projections of z stacks. (Scale bars, 50 µm.) (C) Quantification of the percentage of Iba1-positive microglial cell bodies with ApoE accumulation in the piriform cortex (P = 0.0003; T2+/+PS, n = 12; T2−/−PS, n = 20). (D) Expression of inflammatory genes in the cortex of T2+/+PS and T2−/−PS mice (IL-1α, P = 0.0021; IL-1β, P = 0.0009; TNF-α, P = 0.0133; and C1q, P = 0.0136; IL-6, P = 0.5512). n = 9–10 for all qRT-PCR analyses. All graphs represent the mean ± SEM. Significance was determined using an unpaired, two-tailed Student’s t test with “ns” denoting not significant, *P < 0.05, **P < 0.01, and ***P < 0.001.
We also assessed several inflammatory markers previously implicated in AD (5). Consistent with the reduction in reactive microglia in T2−/−PS mice, we observed a significant decrease in the expression of both IL-1 isoforms, IL-1β and IL-1α (Fig. 4D). IL-1 signaling has been shown to induce expression of other proinflammatory mediators such as TNF-α and IL-6 (5). Accordingly, TNF-α was significantly down-regulated in T2−/−PS mice; however, IL-6 transcript levels were unaltered (Fig. 4D). In addition to cytokines, complement proteins are reported to be increased in brain regions with AD pathology (5). We found the early subcomponent of the complement cascade, C1q, was significantly down-regulated in T2−/−PS mice (Fig. 4D). Thus, there is a decrease in neuroinflammation in T2−/−PS mice despite tangle deposition and tau-induced damage.
Astrogliosis Is Reduced in T2−/−PS Mice.
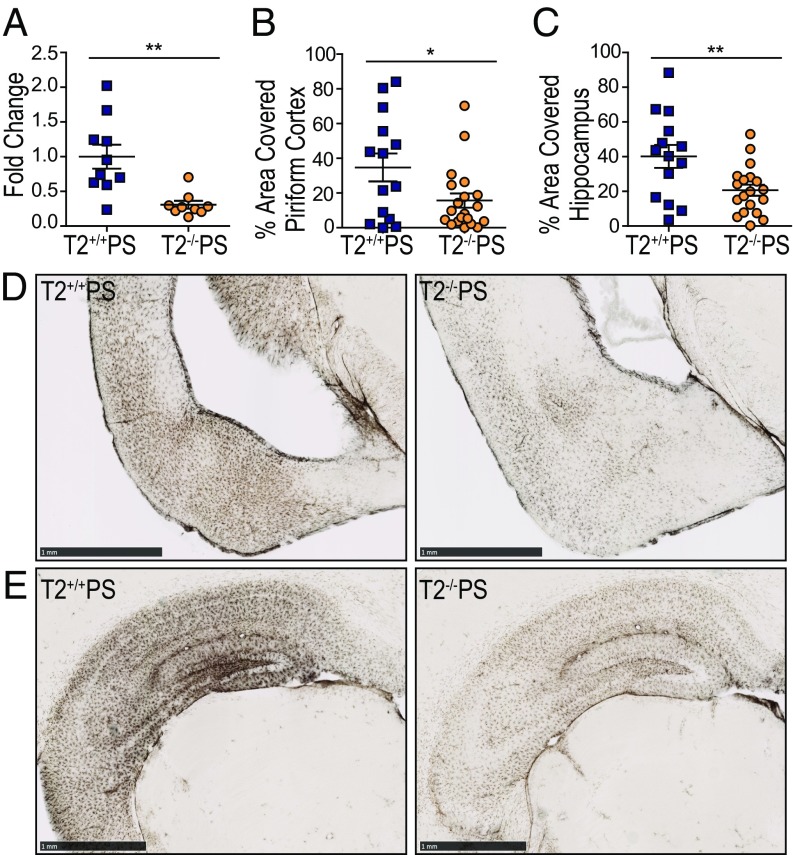
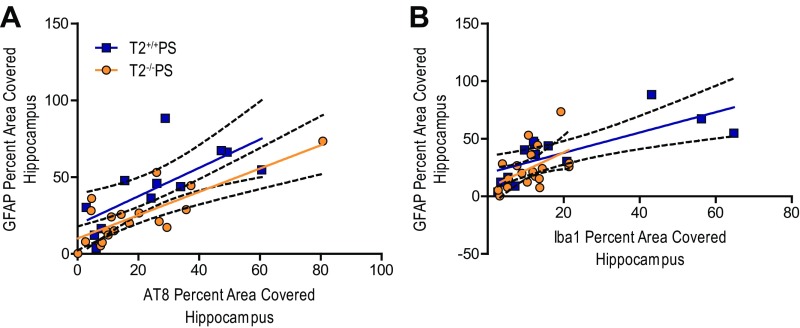
Regions burdened by pathology in AD and other neurodegenerative conditions are also characterized by the presence of reactive astrocytes. Recent studies have further demonstrated that microglia can influence astrocyte reactivity in several disease models (34, 35). In our qRT-PCR analyses for inflammatory mediators, we found that the reactive astrocytic marker, glial fibrillary acidic protein (GFAP), was significantly reduced in the cortex of T2−/−PS mice (Fig. 5A). Immunostaining for GFAP confirmed significantly less astrogliosis in both the piriform cortex (Fig. 5 B and D) and hippocampus (Fig. 5 C and E) of T2−/−PS compared with T2+/+PS mice. The degree of GFAP staining in the hippocampus strongly correlated with the amount of p-tau pathology in both groups (Fig. S4A). Interestingly, however, the correlation between GFAP astrocyte and Iba1 microglia staining was diminished in T2−/−PS compared with T2+/+PS mice (Fig. S4B). This supports the notion that microglia influence reactive astrocytes in tauopathy and that this occurs in a TREM2-dependent manner.
Fig. 5.
Reduced astrogliosis in T2−/−PS mice. (A) Expression of cortical GFAP (P = 0.0019). Quantification of the percent area covered by GFAP staining in the (B) piriform cortex (P = 0.0282; T2+/+PS, n = 14; T2−/−PS, n = 20) and (C) hippocampus (P = 0.0067; T2+/+PS, n = 14; T2−/−PS, n = 19). Representative images of GFAP immunohistochemistry in the (D) piriform cortex and (E) hippocampus of T2+/+PS and T2−/−PS mice. (Scale bars, 1 mm.) Data are mean ± SEM. Significance was determined using an unpaired, two-tailed Student’s t test with *P < 0.05 and **P < 0.01.
Fig. S4.
Correlations between astrogliosis, tau pathology, and microgliosis in the hippocampus of T2+/+PS and T2−/−PS mice. Strong, significant correlations were observed between GFAP staining and (A) AT8 p-tau staining (T2+/+PS: n = 12, **P < 0.01, R2 = 0.5130; T2−/−PS: n = 19, ***P < 0.001, R2 = 0.6311) for both T2+/+PS and T2−/−PS mice. (B) Correlations between GFAP and Iba1 were reduced in T2−/−PS compared with T2+/+PS mice (T2+/+PS: n = 13, **P < 0.01, R2 = 0.5610; T2−/−PS: n = 19, *P < 0.05, R2 = 0.2430). Solid, colored lines represent the best-fit line with a linear regression, and black, dashed lines represent 95% confidence intervals.
Discussion
Our study provides insights into how loss of TREM2 function impacts tau-associated pathologies and the neurodegeneration that ensues in the brain. Surprisingly, it indicates that TREM2 deficiency in the setting of pure tauopathy limits gliosis and neuroinflammation as well as protects against brain atrophy. T2−/−PS mice had significantly attenuated ventricular enlargement and thinning of the entorhinal and piriform cortex layers compared with T2+/+PS mice despite no significant differences in p-tau and insoluble tau accumulation. Further analysis revealed decreased microgliosis and astrogliosis in regions affected by tauopathy in T2−/−PS mice, which corresponded with reduced expression of several proinflammatory genes. These observations suggest that TREM2 facilitates a microglial response to tau pathology and or tau-mediated damage in the brain. Furthermore, our results support that microglia can contribute to the neurodegenerative process in tauopathy without altering tau aggregation.
The absence of TREM2 is associated with decreased microgliosis in a variety of disease models, but the ultimate effects on the different pathologies and neuronal integrity differ. It has previously been shown that TREM2 mediates a microglial response to amyloidosis although not necessarily impacting total plaque load (20, 23). Reminiscent of these observations, we did not detect any obvious effects on tau deposition in T2−/−PS mice but did find decreased microgliosis in areas with abundant tauopathy. Altogether, these data suggest that lack of TREM2 function impairs microglial response to protein aggregation in AD but does not necessarily aggravate it. However, the consequences of TREM2-mediated microgliosis in the context of plaque and tangle pathologies diverge. Previous work illustrates that TREM2 helps sustain a microglial response around plaques that may function to contain toxic Aβ species and protect surrounding neurites (19, 20). Thus, TREM2 signaling may be beneficial in responding to amyloid pathology, while variants leading to a loss of TREM2 function are detrimental. In contrast, our study revealed lack of TREM2 during tauopathy was neuroprotective, reducing gliosis and neuroinflammation, which corresponded with preservation of brain volume. Furthermore, no effects on p-tau pathology were seen in this model, as opposed to observations of increased neuritic dystrophy and p-tau accumulation surrounding amyloid plaques in TREM2-deficient mice (19, 20). We hypothesize that the increase in p-tau detected around plaques in Trem2−/− mice results from either increased damage from amyloid to surrounding neurites or decreased phagocytic clearance of neurites due to less plaque-associated microglia, whereas the p-tau detected in the PS19 mice is attributable to neuronal tau aggregation. Another report also observed beneficial effects of TREM2 deficiency on neuroinflammation and degeneration. Trem2−/− mice had reduced levels of inflammatory transcripts, less hippocampal atrophy, and rescue of behavioral deficits 120 d after traumatic brain injury (36). Overall, these studies indicate TREM2 signaling is important for facilitating the microglial response to damage in the brain and echo the juxtaposing roles that have been described for microglia in neurodegenerative diseases.
Several mechanisms have been proposed to explain how loss of TREM2 function impacts microglial fitness and contributes to various disease phenotypes. For instance, decreased neuroinflammatory markers in TREM2-deficient stroke, traumatic brain injury, and neuropathic pain models may result from impaired chemotaxis following neuronal injury (30) and decreased microglial activation (36–38). Similarly, we found decreases in the percentage of reactive microglia in regions affected by tauopathy in aged T2−/−PS were associated with reduction in inflammatory transcripts, specifically IL-1β, IL-1α, TNF-α, and C1q, suggesting loss of TREM2 function impacts microglia activation, hindering inflammatory responses. However, these observations cannot be definitively attributed to deficits in microglial activation since microgliosis and astrogliosis were reduced as well, making it unclear whether lower cytokines levels are merely a result of overall decreased gliosis. Administration of an agonistic TREM2 antibody significantly increased TNF-α and IL-1β levels in vivo, supporting a microglia activating, proinflammatory role for TREM2 signaling (38). However, TREM2 has classically been described as modestly antiinflammatory and loss of function has also been shown to reduce the same inflammatory markers, such as IL-1β and TNF-α, in other studies (21, 39). Therefore, it remains unclear whether and how TREM2 contributes to microglial activation and regulation of neuroinflammation.
TREM2-deficient microglia have also been shown to have impaired proliferative ability and decreased viability. Trem2−/− plaque-associated microglia have increased TUNEL staining indicative of cellular apoptosis (14) and decreased staining of the proliferation marker KI-67 (19). A recent report further detailed that deficits in cellular metabolism lead to accumulation of autophagic bodies in Trem2−/− microglia and are responsible for decreasing microglial health (40). We did not observe significant differences in microglial proliferation in PS19 mice regardless of Trem2 genotype. Given the reduction in the number of total microglia in T2−/−PS mice is not attributable to cellular proliferation, TREM2-deficient microglia may be undergoing similar metabolic stress which impacts their fitness and capacity to respond to accumulating damage incited by tauopathy, possibly leading to inadvertent cell death. This would also account for the total decrease in microgliosis that was observed. Recent studies provided further evidence that TREM2 promotes microglial survival via the Wnt/β-catenin signaling pathway (41, 42). These results suggest that reduced TREM2 signaling leaves microglia vulnerable to succumbing to pathological insults and injury.
It should be noted that microgliosis deficits do not always equate with increased neuronal injury. Chronic microglial activation has been hypothesized to lead to excessive neuroinflammation that may exacerbate AD pathologies and neurodegeneration (43). Analysis of human AD brain tissue has revealed up-regulation of several inflammatory cytokines in areas of dense tangle pathology and gliosis in AD and other tauopathies (44, 45). Microgliosis induced by protein aggregation may enhance local neuroinflammation and neuronal damage to accelerate disease progression. In this study, we observed that decreased microgliosis, caused by TREM2 deficiency, was associated with less brain atrophy in the context of tau pathology. Since loss-of-function variants in TREM2 are associated with increased risk of AD, we were surprised by this striking protective effect. The attenuation of neurodegeneration and microgliosis observed in TREM2-deficient mice coincides with other recent data from our laboratory in which we found that there was strikingly reduced inflammation and neurodegeneration in PS19 mice lacking ApoE (35). Taken together, these studies suggest that microglial inflammation promotes tau-dependent degeneration. One caveat is that the PS19 mouse is a model of pure tauopathy that expresses a variant of tau that causes FTD and, unlike in AD, does not first develop amyloid plaques. Many groups have reported that loss of TREM2 function exacerbates amyloid-dependent toxicity in mouse models, including accumulation of p-tau and neuritic dystrophy around plaques. Taken together, it is possible that TREM2 function is critical for mitigating amyloid-dependent toxicity early in AD, but subsequently, TREM2-dependent microgliosis becomes detrimental following the onset of tau pathology to promote neurodegeneration. In other words, there may be stage and pathology-specific effects of TREM2 in AD. Moving forward, it is critical that we gain a better understanding of the mechanisms underlying the potential protective and deleterious effects of TREM2 signaling in the setting of AD pathologies. This may be facilitated by mechanistic in vitro studies, further analysis of mouse models, and examining soluble TREM2 fragments detectable in human cerebral spinal fluid throughout the course of AD (46, 47). Elucidating the functions of TREM2 during the progression of AD may lead to increased understanding of the role of innate immunity in AD and aid in developing novel disease-altering treatment strategies.
Methods
Animals.
PS19 htau transgenic mice (purchased from The Jackson Laboratory, https://www.jax.org/strain/008169) expressing the T34 isoform (1N4R) with a P301S mutation were crossed with Trem2−/− or Trem2+/+ mice to generate Trem2+/+ × PS19 (T2+/+PS) and Trem2−/− × PS19 (T2−/−PS) mice. Only male T2+/+PS and T2−/−PS mice were used for analysis in this study. All mice were on a C57BL/6 background. Animal procedures were performed in accordance with protocols approved by the Animal Studies Committee at Washington University School of Medicine.
Brain Extraction and Preparation of Tissue Homogenates.
Mice were anesthetized with i.p. pentobarbital (200 mg/kg), followed by perfusion with 3 U/mL heparin in cold Dulbecco’s PBS. The brains were carefully extracted and cut into two hemispheres. The left hemisphere was collected for immunostaining and fixed in 4% paraformaldehyde overnight before being transferred to 30% sucrose and stored at 4 °C until they were sectioned. Brains were cut coronally into 50-μm sections on a freezing sliding microtome (SM1020R; Leica) and stored in cryoprotectant solution (0.2 M PBS, 15% sucrose, 33% ethylene glycol) at −20 °C until use. The right hemisphere was dissected to isolate the hippocampus for biochemical analysis, and the tissue was kept at −80 °C until analyzed. Biochemical extractions on brain tissue were performed as previously described (48) to assess tau solubility.
Volumetric Analysis of Brain Sections.
Seven coronal brain sections (300 μm between sections) beginning rostrally at the ventricle to the dorsal end of the hippocampus were mounted on slides and allowed to dry overnight. These sections correspond to bregma coordinates −1.23 to −2.69 in the mouse brain atlas (49). The following day, sections were stained in cresyl violet for 6 min and dehydrated in increasing ethanol concentrations followed by xylene and coverslipped with Cytoseal 60. Slides were imaged and processed as previously described. Volumes were quantified by tracing the ventricle or entorhinal-piriform cortex region using NDP viewing software.
Immunostaining for Tau and Glial Markers.
Immunostaining was performed on free-floating sections in 12-well plates. All steps were performed at room temperature, unless indicated otherwise. Immunofluorescence and immunohistochemical stains were performed as described in SI Methods. All stains were quantified in the specified brain region in two to three sections (300 μm between sections) per mouse using ImageJ software, version 2.0.0 (National Institutes of Health), unless otherwise indicated.
Immunoblot for PSD-95.
Total protein concentrations in hippocampal RIPA lysates were determined using a BCA kit (23235; Thermo Fisher) per manufacturer’s instructions. For analyses of PSD-95, 25 μg from each sample was run as described in SI Methods, and detection of ERK was used as a loading control.
RNA Isolation and Real-Time PCR Analyses.
RNA was isolated from cortical tissue using TRIzol (15596018; Thermo Fisher) per the manufacturer’s protocol. RNA was reverse-transcribed using the High Capacity cDNA Reverse Transcription kit (4387406; Applied Biosystems) per the manufacturer’s protocol. Real-time PCR was performed using standard TaqMan probes (4453320; Thermo Fisher) on a Quantstudio 12k Flex System (Applied Biosystems). Relative expression was quantified using the ∆∆Ct method. Β-actin was used as the reference gene and expression as normalized to T2+/+PS.
Tau ELISA.
The concentration of tau species in hippocampal tissue extracts was quantified in a tau sandwich ELISA as previously described (48) using Tau-5 as the coating antibody and human-specific biotinylated HT7 for detection described in SI Methods. No modifications were made to the protocol.
Statistical Analyses.
All graphs represent the mean of all samples in each group ± SEM. GraphPad Prism 5.01 was used to perform statistical analyses. Significance was determined by two-tailed Student’s test, unless otherwise indicated, and P < 0.05 was considered significant.
SI Methods
Antibodies.
Antibodies to Iba1 (1:5,000–1:10,000; 019-19741; Wako), PSD-95 (1:1,000; 18258; Abcam), ERK (1:1,000; 9102; Cell Signaling), biotinylated p-tau AT8 (1:500; MN1020B; Thermo Fisher), biotinylated KI-67 (1:200; SolA15; Thermo Fisher), biotinylated HT7 (1:500; MN1000B; Thermo Fisher), HRP-conjugated anti-mouse (1:7,000; 115-035-003; Jackson), HRP-conjugated anti-rabbit (1:7,000; 111-035-003; Jackson), anti-rabbit 568 (1:500; A11011; Thermo Fisher), and biotinylated anti-rabbit (1:1,000; 711-065-152; Jackson ImmunoResearch) were purchased. Biotinylated anti-mouse ApoE HJ6.3 at 1:200 and anti-Tau5 (27) were used.
Assessment of PSD-95 Levels in Hippocampal Lysates.
Analysis of PSD-95 and ERK levels were performed on 25 μg of total protein from samples processed in SDS-loading buffer and boiled for 10 min. Samples were loaded on an NuPAGE 4–12% Bis-Tris Gel (NP0336; Invitrogen) and transferred onto a nitrocellulose membrane (PowerEase 300W; Life Technologies). Membranes were blocked in 5% milk–TBST for 30 min and incubated in primary antibody diluted in 3% milk–TBST for 3 h, shaking at room temperature. After washing, secondary antibodies were applied for 1 h, shaking at room temperature. Membrane was washed three times for 5 min and imaged using GeneMate Blue Autoradiography Film (9023; Bioexpress) and a medical film processor (SRX-101A; Konica Menolta). Film was quantified using ImageJ software, version 2.0.0 (National Institutes of Health). Illustrator and Photoshop CC 2017 (Adobe Systems) were used for postquantification editing.
Immunofluorescence.
Free-floating sections were washed three times in PBS for 5 min. They were then placed in a 1% Sudan black solution for 20 min, followed by three washes for 5 min in 0.02% PBS-T and one wash in PBS. Sections were then blocked in 3% BSA and 3% normal goat serum (NGS) in PBS with 1% Triton X-100 (PBSX) for 30 min. Sections were incubated in primary antibodies diluted in blocking buffer overnight, shaking at 4 °C followed by three more washing steps. Fluorescently labeled secondary or streptavidin (1:500; S11223; Thermo Fisher) diluted in blocking buffer and applied to the sections for 2-h shaking at room temperature. After washing sections in PBS for three times for 20 min, they were mounted and coverslipped with Prolong Gold (P36930; Invitrogen). Images were taken as a z stack with a LSM 880 II Airyscan FAST confocal microscope (Zeiss) with a 20× objective. Manual quantification was aided using Imaris 8.1 software (Bitplane). Representative images were further processed using ImageJ software, version 2.0.0 (National Institutes of Health), and Illustrator and Photoshop CC 2017 (Adobe Systems).
Immunohistochemistry.
For microglial stains, sections were washed three times in TBS for 5 min and blocked in 0.3% hydrogen peroxide for 10 min. After washing, sections were blocked in 3% NGS in TBS with 0.25% Triton X-100 (TBSX) for 30 min. Primary antibody was diluted in 1% NGS–TBSX, and the sections were incubated in the primary antibody overnight at 4 °C. The next day, sections were washed and incubated with secondary diluted in 1% NGS–TBSX for 1 h. After washing, sections were incubated in ABC elite solution (VectaStain; PK-6100), prepared per manufacturer’s instructions, for 1 h followed by another washing step. Sections were developed in DAB solution (catalog no. D5905; Sigma-Aldrich), washed, and mounted on slides. After drying overnight, the slides were dehydrated in increasing ethanol concentrations followed by xylene and coverslipped with Cytoseal 60 (8310; Thermo Fisher). Phospho-tau AT8 staining was performed as previously described (48). Stained tissue was scanned using a NanoZoomer digital pathology system (Hamamatsu Photonics). Images were processed using NDP viewing software (Hamamatsu).
Acknowledgments
We thank Tyler Ulland for his contributions in the discussions about this work and the preparation of the manuscript. Scanning of immunohistochemistry was performed on the NanoZoomer digital pathology system courtesy of The Hope Center Alafi Neuroimaging Laboratory. Immunofluorescence images were captured on the Zeiss LSM 880 II Airyscan FAST confocal microscope and quantified using Imaris 8.1 software with assistance in part from the Washington University Center for Cellular Imaging. This study was supported by the National Institute of Aging Grant AG053976 (to C.E.G.L.), JPB Foundation (D.M.H.), The Donor’s Cure Foundation (J.D.U.), and the Cure Alzheimer’s Fund (D.M.H. and M.C.).
Footnotes
Conflict of interest statement: C.E.G.L. and D.M.H. are listed as inventors on a patent licensed by Washington University to C2N Diagnostics on the therapeutic use of anti-tau antibodies. D.M.H. cofounded and is on the scientific advisory board of C2N Diagnostics, LLC. C2N Diagnostics, LLC, has licensed certain anti-tau antibodies to AbbVie for therapeutic development. D.M.H. is on the scientific advisory board of Proclara Biosciences and consults for Genentech, Eli Lilly, AbbVie, GlaxoSmithKline, and Denali. J.D.U., M.B.F., F.R.S., L.J.K., J.R.S., G.O.R., E.A., and M.C. declare no competing financial interests.
This article is a PNAS Direct Submission.
This article contains supporting information online at www.pnas.org/lookup/suppl/doi:10.1073/pnas.1710311114/-/DCSupplemental.
References
- 1.Holtzman DM, Morris JC, Goate AM. Alzheimer’s disease: The challenge of the second century. Sci Transl Med. 2011;3:77sr1. doi: 10.1126/scitranslmed.3002369. [DOI] [PMC free article] [PubMed] [Google Scholar]
- 2.Itagaki S, McGeer PL, Akiyama H, Zhu S, Selkoe D. Relationship of microglia and astrocytes to amyloid deposits of Alzheimer disease. J Neuroimmunol. 1989;24:173–182. doi: 10.1016/0165-5728(89)90115-x. [DOI] [PubMed] [Google Scholar]
- 3.Sheffield LG, Marquis JG, Berman NE. Regional distribution of cortical microglia parallels that of neurofibrillary tangles in Alzheimer’s disease. Neurosci Lett. 2000;285:165–168. doi: 10.1016/s0304-3940(00)01037-5. [DOI] [PubMed] [Google Scholar]
- 4.Wyss-Coray T, Mucke L. Inflammation in neurodegenerative disease—a double-edged sword. Neuron. 2002;35:419–432. doi: 10.1016/s0896-6273(02)00794-8. [DOI] [PubMed] [Google Scholar]
- 5.Leyns CEG, Holtzman DM. Glial contributions to neurodegeneration in tauopathies. Mol Neurodegener. 2017;12:50. doi: 10.1186/s13024-017-0192-x. [DOI] [PMC free article] [PubMed] [Google Scholar]
- 6.Guerreiro R, et al. Alzheimer Genetic Analysis Group TREM2 variants in Alzheimer’s disease. N Engl J Med. 2013;368:117–127. doi: 10.1056/NEJMoa1211851. [DOI] [PMC free article] [PubMed] [Google Scholar]
- 7.Jonsson T, et al. Variant of TREM2 associated with the risk of Alzheimer’s disease. N Engl J Med. 2013;368:107–116. doi: 10.1056/NEJMoa1211103. [DOI] [PMC free article] [PubMed] [Google Scholar]
- 8.Ulrich JD, Ulland TK, Colonna M, Holtzman DM. Elucidating the role of TREM2 in Alzheimer’s disease. Neuron. 2017;94:237–248. doi: 10.1016/j.neuron.2017.02.042. [DOI] [PubMed] [Google Scholar]
- 9.Atagi Y, et al. Apolipoprotein E is a ligand for triggering receptor expressed on myeloid cells 2 (TREM2) J Biol Chem. 2015;290:26043–26050. doi: 10.1074/jbc.M115.679043. [DOI] [PMC free article] [PubMed] [Google Scholar]
- 10.Bailey CC, DeVaux LB, Farzan M. The triggering receptor expressed on myeloid cells 2 binds apolipoprotein E. J Biol Chem. 2015;290:26033–26042. doi: 10.1074/jbc.M115.677286. [DOI] [PMC free article] [PubMed] [Google Scholar]
- 11.Kober DL, et al. Neurodegenerative disease mutations in TREM2 reveal a functional surface and distinct loss-of-function mechanisms. Elife. 2016;5:e20391. doi: 10.7554/eLife.20391. [DOI] [PMC free article] [PubMed] [Google Scholar]
- 12.Yeh FL, Wang Y, Tom I, Gonzalez LC, Sheng M. TREM2 binds to apolipoproteins, including APOE and CLU/APOJ, and thereby facilitates uptake of amyloid-beta by microglia. Neuron. 2016;91:328–340. doi: 10.1016/j.neuron.2016.06.015. [DOI] [PubMed] [Google Scholar]
- 13.Song W, et al. Alzheimer’s disease-associated TREM2 variants exhibit either decreased or increased ligand-dependent activation. Alzheimers Dement. 2017;13:381–387. doi: 10.1016/j.jalz.2016.07.004. [DOI] [PMC free article] [PubMed] [Google Scholar]
- 14.Wang Y, et al. TREM2 lipid sensing sustains the microglial response in an Alzheimer’s disease model. Cell. 2015;160:1061–1071. doi: 10.1016/j.cell.2015.01.049. [DOI] [PMC free article] [PubMed] [Google Scholar]
- 15.Musiek ES, Holtzman DM. Three dimensions of the amyloid hypothesis: Time, space and “wingmen.”. Nat Neurosci. 2015;18:800–806. doi: 10.1038/nn.4018. [DOI] [PMC free article] [PubMed] [Google Scholar]
- 16.Ulrich JD, et al. Altered microglial response to Aβ plaques in APPPS1-21 mice heterozygous for TREM2. Mol Neurodegener. 2014;9:20. doi: 10.1186/1750-1326-9-20. [DOI] [PMC free article] [PubMed] [Google Scholar]
- 17.Jay TR, et al. TREM2 deficiency eliminates TREM2+ inflammatory macrophages and ameliorates pathology in Alzheimer’s disease mouse models. J Exp Med. 2015;212:287–295. doi: 10.1084/jem.20142322. [DOI] [PMC free article] [PubMed] [Google Scholar]
- 18.Jay TR, et al. Disease progression-dependent effects of TREM2 deficiency in a mouse model of Alzheimer’s disease. J Neurosci. 2017;37:637–647. doi: 10.1523/JNEUROSCI.2110-16.2016. [DOI] [PMC free article] [PubMed] [Google Scholar]
- 19.Wang Y, et al. TREM2-mediated early microglial response limits diffusion and toxicity of amyloid plaques. J Exp Med. 2016;213:667–675. doi: 10.1084/jem.20151948. [DOI] [PMC free article] [PubMed] [Google Scholar]
- 20.Yuan P, et al. TREM2 haplodeficiency in mice and humans impairs the microglia barrier function leading to decreased amyloid compaction and severe axonal dystrophy. Neuron. 2016;92:252–264. doi: 10.1016/j.neuron.2016.09.016. [DOI] [PubMed] [Google Scholar]
- 21.Turnbull IR, et al. Cutting edge: TREM-2 attenuates macrophage activation. J Immunol. 2006;177:3520–3524. doi: 10.4049/jimmunol.177.6.3520. [DOI] [PubMed] [Google Scholar]
- 22.Yoshiyama Y, et al. Synapse loss and microglial activation precede tangles in a P301S tauopathy mouse model. Neuron. 2007;53:337–351. doi: 10.1016/j.neuron.2007.01.010. [DOI] [PubMed] [Google Scholar]
- 23.Yanamandra K, et al. Anti-tau antibodies that block tau aggregate seeding in vitro markedly decrease pathology and improve cognition in vivo. Neuron. 2013;80:402–414. doi: 10.1016/j.neuron.2013.07.046. [DOI] [PMC free article] [PubMed] [Google Scholar]
- 24.Augustinack JC, Schneider A, Mandelkow E-M, Hyman BT. Specific tau phosphorylation sites correlate with severity of neuronal cytopathology in Alzheimer’s disease. Acta Neuropathol. 2002;103:26–35. doi: 10.1007/s004010100423. [DOI] [PubMed] [Google Scholar]
- 25.Bellucci A, Bugiani O, Ghetti B, Spillantini MG. Presence of reactive microglia and neuroinflammatory mediators in a case of frontotemporal dementia with P301S mutation. Neurodegener Dis. 2011;8:221–229. doi: 10.1159/000322228. [DOI] [PMC free article] [PubMed] [Google Scholar]
- 26.Ingelsson M, et al. Early abeta accumulation and progressive synaptic loss, gliosis, and tangle formation in AD brain. Neurology. 2004;62:925–931. doi: 10.1212/01.wnl.0000115115.98960.37. [DOI] [PubMed] [Google Scholar]
- 27.Serrano-Pozo A, et al. Reactive glia not only associates with plaques but also parallels tangles in Alzheimer’s disease. Am J Pathol. 2011;179:1373–1384. doi: 10.1016/j.ajpath.2011.05.047. [DOI] [PMC free article] [PubMed] [Google Scholar]
- 28.Keren-Shaul H, et al. A unique microglia type associated with restricting development of Alzheimer’s disease. Cell. 2017;169:1276–1290.e17. doi: 10.1016/j.cell.2017.05.018. [DOI] [PubMed] [Google Scholar]
- 29.Butovsky O, et al. Targeting miR-155 restores abnormal microglia and attenuates disease in SOD1 mice. Ann Neurol. 2015;77:75–99. doi: 10.1002/ana.24304. [DOI] [PMC free article] [PubMed] [Google Scholar]
- 30.Mazaheri F, et al. TREM2 deficiency impairs chemotaxis and microglial responses to neuronal injury. EMBO Rep. 2017;18:1186–1198. doi: 10.15252/embr.201743922. [DOI] [PMC free article] [PubMed] [Google Scholar]
- 31.Krasemann S, et al. The TREM2-APOE pathway drives the transcriptional phenotype of dysfunctional microglia in neurodegenerative diseases. Immunity. 2017;47:566–581.e9. doi: 10.1016/j.immuni.2017.08.008. [DOI] [PMC free article] [PubMed] [Google Scholar]
- 32.Srinivasan K, et al. Untangling the brain’s neuroinflammatory and neurodegenerative transcriptional responses. Nat Commun. 2016;7:11295. doi: 10.1038/ncomms11295. [DOI] [PMC free article] [PubMed] [Google Scholar]
- 33.Holtzman DM, Herz J, Bu G. Apolipoprotein E and apolipoprotein E receptors: Normal biology and roles in Alzheimer disease. Cold Spring Harb Perspect Med. 2012;2:a006312. doi: 10.1101/cshperspect.a006312. [DOI] [PMC free article] [PubMed] [Google Scholar]
- 34.Liddelow SA, et al. Neurotoxic reactive astrocytes are induced by activated microglia. Nature. 2017;541:481–487. doi: 10.1038/nature21029. [DOI] [PMC free article] [PubMed] [Google Scholar]
- 35.Shi Y, et al. ApoE4 markedly exacerbates tau-mediated neurodegeneration in a mouse model of tauopathy. Nature. 2017;549:523–527. doi: 10.1038/nature24016. [DOI] [PMC free article] [PubMed] [Google Scholar]
- 36.Saber M, Kokiko-Cochran O, Puntambekar SS, Lathia JD, Lamb BT. Triggering receptor expressed on myeloid cells 2 deficiency alters acute macrophage distribution and improves recovery after traumatic brain injury. J Neurotrauma. 2017;34:423–435. doi: 10.1089/neu.2016.4401. [DOI] [PubMed] [Google Scholar]
- 37.Sieber MW, et al. Attenuated inflammatory response in triggering receptor expressed on myeloid cells 2 (TREM2) knock-out mice following stroke. PLoS One. 2013;8:e52982. doi: 10.1371/journal.pone.0052982. [DOI] [PMC free article] [PubMed] [Google Scholar]
- 38.Kobayashi M, Konishi H, Sayo A, Takai T, Kiyama H. TREM2/DAP12 signal elicits proinflammatory response in microglia and exacerbates neuropathic pain. J Neurosci. 2016;36:11138–11150. doi: 10.1523/JNEUROSCI.1238-16.2016. [DOI] [PMC free article] [PubMed] [Google Scholar]
- 39.Colonna M. TREMs in the immune system and beyond. Nat Rev Immunol. 2003;3:445–453. doi: 10.1038/nri1106. [DOI] [PubMed] [Google Scholar]
- 40.Ulland TK, et al. TREM2 maintains microglial metabolic fitness in Alzheimer’s disease. Cell. 2017;170:649–663.e13. doi: 10.1016/j.cell.2017.07.023. [DOI] [PMC free article] [PubMed] [Google Scholar]
- 41.Zheng H, et al. TREM2 promotes microglial survival by activating Wnt/β-catenin pathway. J Neurosci. 2017;37:1772–1784. doi: 10.1523/JNEUROSCI.2459-16.2017. [DOI] [PMC free article] [PubMed] [Google Scholar]
- 42.Otero K, et al. Macrophage colony-stimulating factor induces the proliferation and survival of macrophages via a pathway involving DAP12 and beta-catenin. Nat Immunol. 2009;10:734–743. doi: 10.1038/ni.1744. [DOI] [PMC free article] [PubMed] [Google Scholar]
- 43.Ransohoff RM. How neuroinflammation contributes to neurodegeneration. Science. 2016;353:777–783. doi: 10.1126/science.aag2590. [DOI] [PubMed] [Google Scholar]
- 44.Lull ME, Block ML. Microglial activation and chronic neurodegeneration. Neurotherapeutics. 2010;7:354–365. doi: 10.1016/j.nurt.2010.05.014. [DOI] [PMC free article] [PubMed] [Google Scholar]
- 45.Wang W-Y, Tan M-S, Yu J-T, Tan L. Role of pro-inflammatory cytokines released from microglia in Alzheimer’s disease. Ann Transl Med. 2015;3:136. doi: 10.3978/j.issn.2305-5839.2015.03.49. [DOI] [PMC free article] [PubMed] [Google Scholar]
- 46.Suárez-Calvet M, et al. Dominantly Inherited Alzheimer Network Early changes in CSF sTREM2 in dominantly inherited Alzheimer’s disease occur after amyloid deposition and neuronal injury. Sci Transl Med. 2016;8:369ra178. doi: 10.1126/scitranslmed.aag1767. [DOI] [PMC free article] [PubMed] [Google Scholar]
- 47.Zhong L, et al. Soluble TREM2 induces inflammatory responses and enhances microglial survival. J Exp Med. 2017;214:597–607. doi: 10.1084/jem.20160844. [DOI] [PMC free article] [PubMed] [Google Scholar]
- 48.Ising C, et al. AAV-mediated expression of anti-tau scFvs decreases tau accumulation in a mouse model of tauopathy. J Exp Med. 2017;214:1227–1238, and erratum (2017) 214:2163. doi: 10.1084/jem.20162125. [DOI] [PMC free article] [PubMed] [Google Scholar]
- 49.Paxinos G, Franklin K. The Mouse Brain in Stereotactic Coordinates. Academic; New York: 2008. [Google Scholar]


