Abstract
Standard three-dimensional Fourier transform (FT) NMR experiments of molecular systems often involve prolonged measurement times due to extensive sampling required along the indirect time domains to obtain adequate spectral resolution. In recent years, a wealth of alternative sampling methods has been proposed to ease this bottleneck. However, due to their algorithmic complexity, for a given sample and experiment it is often hard to determine the minimal sampling requirement, and hence the maximal achievable experimental speed up. Here we introduce an absolute minimal sampling (AMS) method that can be applied to common 3D NMR experiments. We show for the proteins ubiquitin and arginine kinase that for widely used experiments, such as 3D HNCO, accurate carbon frequencies can be obtained with a single time increment, while for others, such as 3D HN(CA)CO, all relevant information is obtained with as few as 6 increments amounting to a speed up of a factor 7 – 50.
Keywords: 3D NMR spectroscopy, Minimal sampling, non-linear least squares time-domain fitting
Graphical Abstract
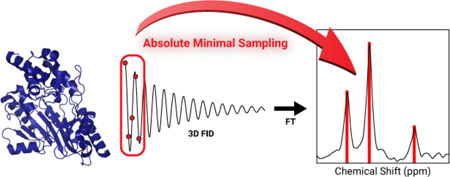
A minimal sampling approach is presented to extract accurate chemical shifts from high dimensional NMR experiments offering a dramatic reduction in experimental time as demonstrated for a large 42 kDa protein.
The rich information content of multidimensional NMR spectra is the reason for its wide spread use in chemical and biochemical research. The standard acquisition of NMR experiments in three (or higher) dimensions, however, is time intensive taking of the order of a day or longer. For example, 3D NMR experiments of uniformly 15N,13C-labeled protein samples are traditionally acquired by independently incrementing the evolution times t1 and t2 along the 13C and 15N dimensions with N1 and N2 complex points, respectively.[1–2] This leads to a total acquisition time that grows with N1 × N2, where N1 and N2 are typically set to 32 – 64 increments so that the spectral resolution after FT along the two indirect dimensions is sufficiently high (typically of the order of a few tens of Hz).
There has been a surge of new methods for shortening the measurement time by reducing the total number of increments, which was reviewed recently.[3] Most methods belong to one of two sampling schemes: in radial sampling, t1 and t2 are simultaneously incremented, which corresponds to the measurement of one (or several) tilted frequency planes,[4–5] whereas in non-uniform sampling (NUS), certain t1, t2 points are left out at random by preferentially retaining time points at shorter evolution times due to their on average higher signal-to-noise. The two types of sampling schemes have complementary benefits: in radial sampling a modified form of the standard fast Fourier transform method can be applied, but the reconstruction of the full 3D spectrum is prone to artifacts. NUS does not allow processing by standard Fourier transformation requiring the use of a regularization condition for reconstruction, such as the maximum entropy[6–7] or compressed sensing condition,[8–9] striking a balance between the consistency of the reconstructed spectrum with the experimental data and the achievable sparseness of the final spectrum. The two sampling schemes can also be combined for the high-grade reconstruction of multidimensional spectra.[10]
Another approach is time-domain fitting, which has been used originally in linear prediction (LP) where a truncated time-domain signal is extended in time so that it can be subjected to regular Fourier transformation.[11] Although this improves spectral resolution and minimizes truncation artifacts, it is typically limited to a two-fold reduction in measurement time per indirect dimension. More recently, other time-domain fitting methods have been proposed, such as the filter diagonalization method,[12–13] the CRAFT method for the compilation of tables with frequencies, linewidths, and amplitudes of signals in 1D and 2D NMR datasets,[14–15] and for a more accurate extraction of peak amplitudes from 2D HSQC spectra.[16] For all of these methods, the absolute minimal number of increments to attain the relevant spectral information is unknown.
In practice, the spectroscopic parameters of interest from high dimensional NMR experiments are often the chemical shifts of nuclei that belong to the same spin system, such as the nuclei of peptide bonds on the protein backbone. For some experiments, such information is available with minimal measurement time. For example, for a 3D HNCO spectrum[17] of a protein with a single carbonyl C’ resonance belonging to a selected 15N,1H frequency pair, the carbonyl resonance frequency ωC can be extracted from a single complex time point t1 >0[18]:
| (1) |
where
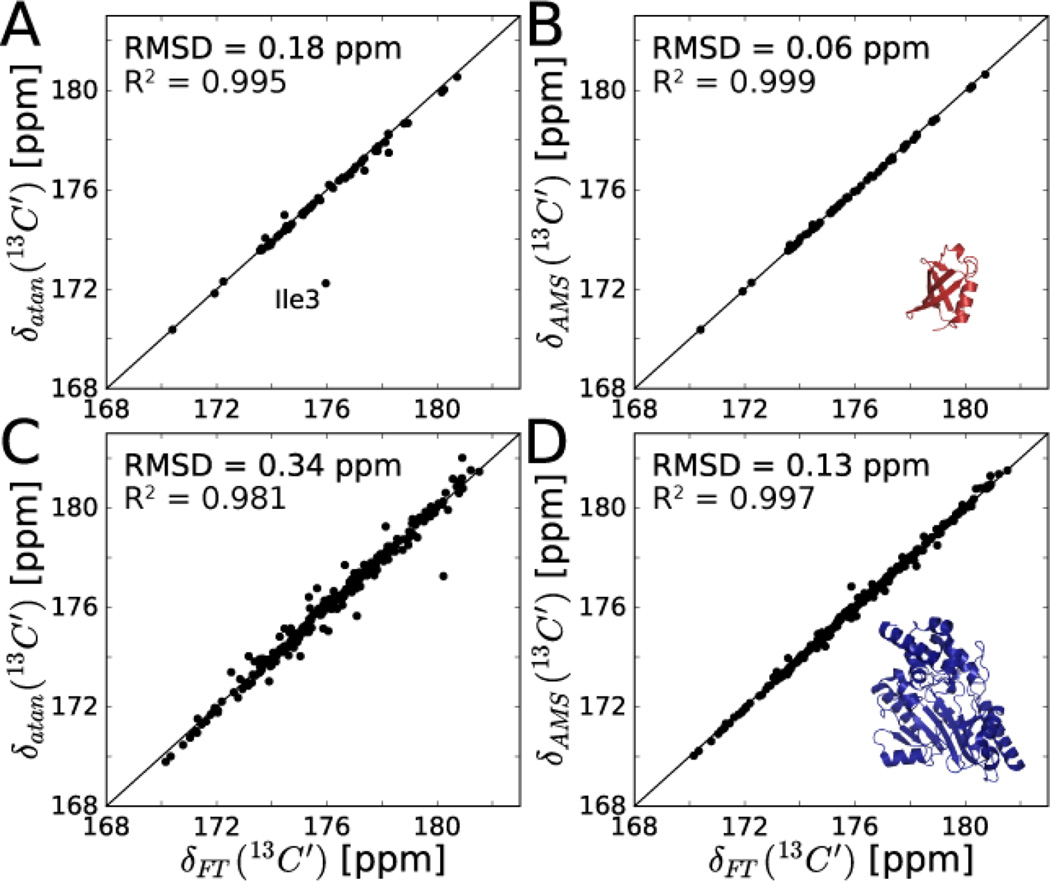
are the cosine and sine modulated experimental data points along the indirect time dimension t1 of the 15N,1H frequency pair of interest and arctan(y,x) is the two-argument variant of the arctangent function (also known as atan2) that is sensitive to the sign information of its arguments, whereby transverse relaxation effects A exp(−R2t1) with decay rate R2 cancels out leaving ωC as the only unknown. Application of Eq. (1) to the 2nd complex t1 increment along the C’ dimension of a HNCO experiment is an extension of the SPEED method[18] to 3D NMR data but without the need for a 13C carbonyl reference spectrum. Results for ubiquitin (8.5 kDa, 76 amino acids) and arginine kinase (AK, 42 kDa, 357 amino acids)[19] show overall good agreement with peak positions obtained from the 3D FT processed spectrum with a RMSD of 0.18 and 0.34 ppm, respectively (Figure 1A,C). For ubiquitin, Ile3 is an outlier because of severe peak overlap at its 15N,1H frequencies (Figure S1). It is worth noting that FT of a single time-domain point would fail to provide any useful frequency information.
Figure 1.
Accuracy of arctangent approach (A,C) and AMS (B,D) for carbonyl chemical shift determination for 13C,15N labeled ubiquitin (A,B) and arginine kinase (C,D) from 3D HNCO data sets. In A, the outlier (Ile3) was excluded from RMSD and R2 calculations. Carbonyl shifts in A,C were determined from Eq. (1) using just the 2nd complex t1 time point of the HNCO. AMS-derived shifts in B,D are the best fit result to Eq. (2) using the first 4* t1 points of the HNCO. Reference chemical shifts δFT (x-axes) were determined by peak-picking the conventionally FT processed 3D HNCO experiments acquired with 40* and 44* t1 points for ubiquitin and arginine kinase, respectively.
The accuracy of the experimental chemical shifts can be further improved by directly performing non-linear least squares time-domain fitting of the sum of cosine and sine functions, C(t1) and S(t1), to multiple t1 increments. This also allows the determination of multiple resonance frequencies that belong to the same 15N,1H pair:
| (2) |
where in the case of uniform sampling, t1 = nΔt1 (n=0,…, N−1), the sampling rate is the Nyquist frequency 1/Δt1 (spectral width). There are just 2 fit parameters per resonance k, namely the amplitude Ak and frequency ωC,k. For small N, i.e. short maximal evolution times, transverse (R2) relaxation is negligible in good approximation. For larger N and longer evolution times or larger proteins with rapid R2 relaxation, a uniform non-zero R2 value can help improve the fitting results. In principle, the smallest possible N is equal to the number of resonances (M) being fitted (i.e. N = M complex t1 increments), which is the absolute minimal sampling (AMS) limit. In practice, use of a slightly larger N>M improves the robustness and accuracy of the fitted frequencies and amplitudes.
Figure 1B,D shows the fits of AMS 3D HNCO data obtained using Eq. (2) for N = 4 t1 increments, which significantly improve the C’ chemical shift accuracy to 0.06 ppm (9 Hz) for ubiquitin and 0.13 ppm (26 Hz) for AK. This corresponds to a chemical shift accuracy comparable to the C’ natural linewidths (see Supporting Information). The experiment time for the AMS data of AK is only 2.5 hours as compared to 28 hours for the full 3D data set amounting to a speed-up of a factor 11.
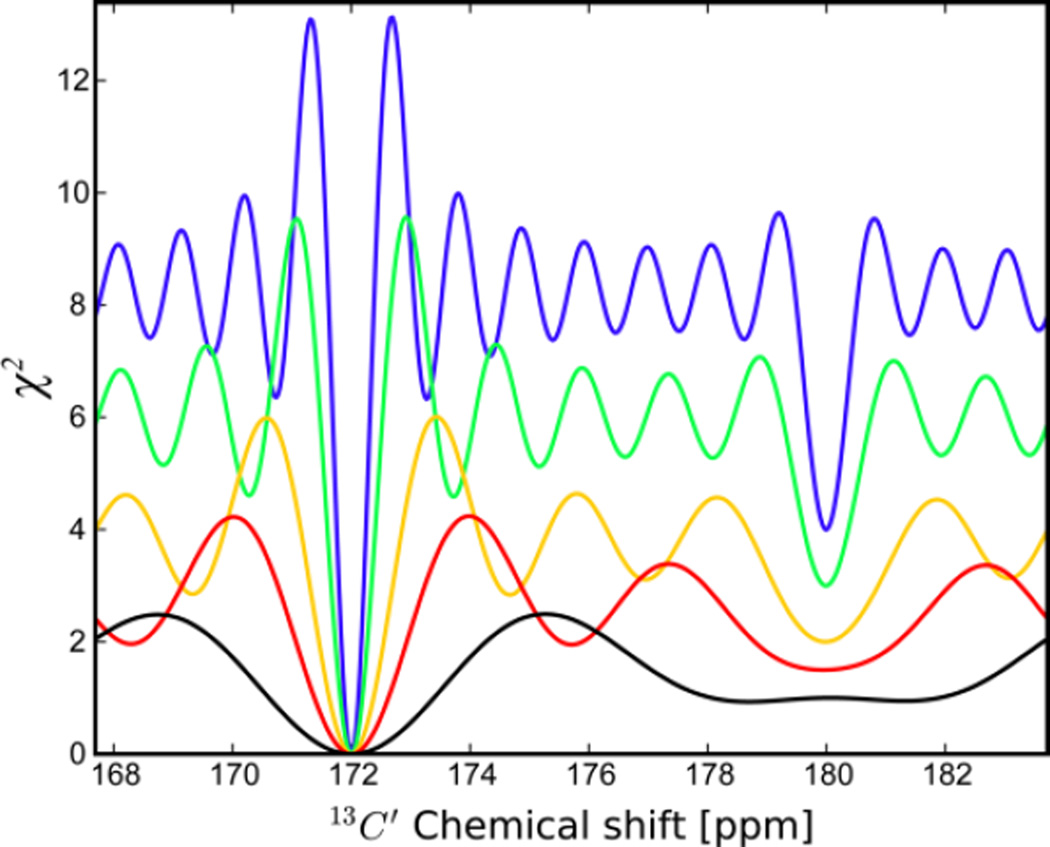
Surprisingly, in the presence of multiple resonances, the non-linear least squares fit allows the accurate and robust determination of the dominant frequency with little effect by the presence of a 2nd minor resonance. This is shown in Figure 2 where the goodness-of-fit parameter χ2 is plotted as function of the frequency offset and the number of sampling points N. The global χ2 minimum is at the correct position (172 ppm) with a 2nd local minimum found at the frequency of the minor resonance (180 ppm). With larger N, the minimum becomes narrower and better defined and, depending on the signal-to-noise, allows a more accurate fitting of the spectral parameters. The median signal-to-noise ratios of the first 15N,1H planes of the HNCO experiments of ubiquitin and AK were approximately 200:1 and 40:1, respectively.
Figure 2.
Goodness of fit χ2 profiles when fitting a single chemical shift to time-domain data of the sum of two distinct frequencies. Simulated data were generated with two frequencies at 172 and 180 ppm with relative populations of 0.75 and 0.25, respectively, which were fit to Eq. (2). The number of complex points used in the fits are 4* (black), 6* (red), 8* (yellow), 12* (green), and 16* (blue). Importantly, the location of the χ2 minimum of the dominant peak remains invariant independent of the number of points used in the fit.
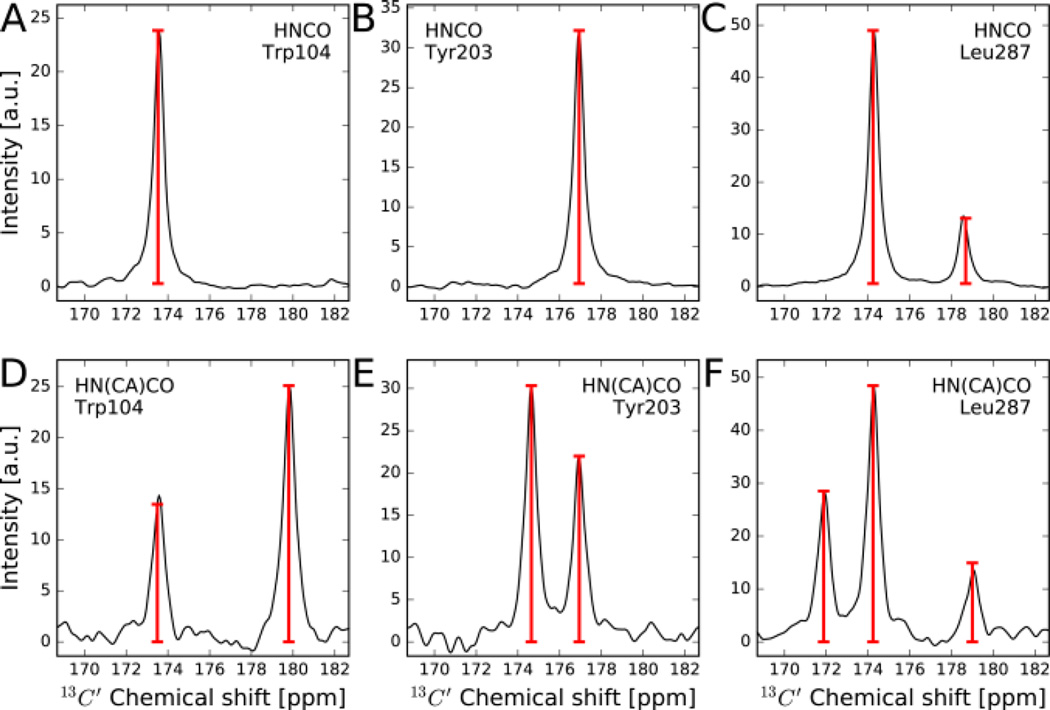
The AMS approach permits accurate determination of resonance positions and amplitudes also for 3D experiments where more than one 13C’ cross-peak is present for each backbone 15N,1H frequency pair as is the case in the HN(CA)CO experiment.[20] Figure 3 shows for selected residues of arginine kinase HN(CA)CO and HNCO cross sections of the full 3D FT spectra along with AMS fits (red bars). The results show that both the peak positions and their amplitudes match very well the FT results that required >7-fold longer measurement times. This applies also for HN(CA)CO traces with multiple resonances present (Figure 3D,E,F), despite a median signal-to-noise ratio of the first 15N,1H plane of only about 15:1. The comparison for all assigned residues of AK, which is given in the Supporting Information, demonstrates that the AMS approach produces peak lists with high accuracy and reliability in an optimal amount of time.
Figure 3.
Carbonyl FT traces and AMS results of HNCO and HN(CA)CO experiments measured for arginine kinase. In black are the traditional FT traces using 44* t1 points, while the red bars are the AMS-derived chemical shifts using the first 4* or 6* points of HNCO and HN(CA)CO, respectively. The heights of the red bars reflect fitted resonance amplitudes Ak (Eq. (2)).
The AMS approach directly fits resonance frequencies and their amplitudes from time-domain signals along an indirect dimension, such as the 13C dimension, without invoking a Fourier transformation. Hence, the performance of AMS is not bound to the uncertainty principle of FT. For example, for the HNCO of AK with N=4 the digital resolution of the Fourier spectrum along the C’ dimension is 706 Hz (¼ of the spectral width). Remarkably, the average error of the AMS fitted C’ frequencies is only 26 Hz or 3.7% of the digital resolution attesting to the effectiveness of this method. In most 3D NMR experiments the number of resonances along an axis is small, even for large proteins, which drastically limits the number of time points needed along the indirect dimension(s) of interest to typically well below 10. AMS is particularly beneficial for those multidimensional experiments that are less limited by sensitivity rather than by the time required to sample the indirect dimensions, which is the case for most resonance assignment experiments. As in CRAFT, the result of AMS is a set of frequencies with associated amplitudes rather than a traditional FT spectrum.
The goal of AMS is to obtain 3D cross-peak positions with the least possible number of increments and, hence, a minimal amount of time and resources. AMS does not require the use of any complex regularization, projection, or non-uniform reconstruction scheme and can be applied to any standard NMR pulse sequence. There are no computer hard drive and memory limitations for AMS, as the full, high-resolution spectrum is not explicitly reconstructed. It is possible to perform AMS fitting while the NMR experiment is still in progress. Once a desired goodness-of-fit for the time-domain signals along the dimension(s) of interest is sufficiently high, the pulse sequence could be automatically stopped, which can be useful, for example, when multiple 3D pulse sequences are queued on a spectrometer, possibly in combination with an automated sample changer to run a maximal number of experiments or samples in a minimal amount of time. Alternatively, for sample limited proteins, the emphasis can be shifted to signal averaging instead of resolution.
The AMS approach has been demonstrated here for the kind of 3D NMR experiments that are routinely used in many laboratories for protein backbone resonance assignments and which cumulatively use a significant fraction of the total measurement time on high-field NMR systems. For these types of experiments, the NMR time savings afforded by AMS compares favorably to the standard 3D FT approach as well as to alternative sampling methods.
Supplementary Material
Acknowledgments
This work was supported by the National Science Foundation (MCB-1360966) and the NIH (5R01GM077643 and 2R01GM066041).
References
- 1.Bax A, Grzesiek S. Acc. Chem. Res. 1993;26:131–138. [Google Scholar]
- 2.Sattler M, Schleucher J, Griesinger C. Prog. Nucl. Magn. Reson. Spectrosc. 1999;34:93–158. [Google Scholar]
- 3.Kazimierczuk K, Orekhov V. Magn. Reson. Chem. 2015;53:921–926. doi: 10.1002/mrc.4284. [DOI] [PubMed] [Google Scholar]
- 4.Kim S, Szyperski T. J. Am. Chem. Soc. 2003;125:1385–1393. doi: 10.1021/ja028197d. [DOI] [PubMed] [Google Scholar]
- 5.Kupče E, Freeman R. J. Am. Chem. Soc. 2003;125:13958–13959. doi: 10.1021/ja038297z. [DOI] [PubMed] [Google Scholar]
- 6.Hoch JC, Maciejewski MW, Mobli M, Schuyler AD, Stern AS. Acc. Chem. Res. 2014;47:708–717. doi: 10.1021/ar400244v. [DOI] [PMC free article] [PubMed] [Google Scholar]
- 7.Hyberts SG, Takeuchi K, Wagner G. J. Am. Chem. Soc. 2010;132:2145–2147. doi: 10.1021/ja908004w. [DOI] [PMC free article] [PubMed] [Google Scholar]
- 8.Kazimierczuk K, Orekhov VY. Angew. Chem. Int. Ed. 2011;50:5556–5559. doi: 10.1002/anie.201100370. [DOI] [PubMed] [Google Scholar]
- 9.Holland DJ, Bostock MJ, Gladden LF, Nietlispach D. Angew. Chem. Int. Ed. 2011;50:6548–6551. doi: 10.1002/anie.201100440. [DOI] [PubMed] [Google Scholar]
- 10.Hassanieh H, Mayzel M, Shi L, Katabi D, Orekhov VY. J. Biomol. NMR. 2015;63:9–19. doi: 10.1007/s10858-015-9952-5. [DOI] [PubMed] [Google Scholar]
- 11.Led JJ, Gesmar H. Chem. Rev. 1991;91:1413–1426. [Google Scholar]
- 12.Mandelshtam VA. Prog. Nucl. Magn. Reson. Spectrosc. 2001;38:159–196. [Google Scholar]
- 13.Chen J, Mandelshtam V, Shaka A. J. Magn. Reson. 2000;146:363–368. doi: 10.1006/jmre.2000.2155. [DOI] [PubMed] [Google Scholar]
- 14.Krishnamurthy K. Magn. Reson. Chem. 2013;51:821–829. doi: 10.1002/mrc.4022. [DOI] [PubMed] [Google Scholar]
- 15.Krishnamurthy K, Sefler AM, Russell DJ. Magn. Reson. Chem. 2016 doi: 10.1002/mrc.4449. [DOI] [PubMed] [Google Scholar]
- 16.Chylla RA, Hu K, Ellinger JJ, Markley JL. Anal. Chem. 2011;83:4871–4880. doi: 10.1021/ac200536b. [DOI] [PMC free article] [PubMed] [Google Scholar]
- 17.Kay LE, Ikura M, Tschudin R, Bax A. J. Magn. Reson. (1969) 1990;89:496–514. doi: 10.1016/j.jmr.2011.09.004. [DOI] [PubMed] [Google Scholar]
- 18.Kupče E, Freeman R. Magn. Reson. Chem. 2007;45:711–713. doi: 10.1002/mrc.1947. [DOI] [PubMed] [Google Scholar]
- 19.Niu X, Bruschweiler-Li L, Davulcu O, Skalicky JJ, Brüschweiler R, Chapman MS. J. Mol. Biol. 2011;405:479–496. doi: 10.1016/j.jmb.2010.11.007. [DOI] [PMC free article] [PubMed] [Google Scholar]
- 20.Clubb RT, Thanabal V, Wagner G. J. Magn. Reson. (1969) 1992;97:213–217. [Google Scholar]
Associated Data
This section collects any data citations, data availability statements, or supplementary materials included in this article.


