Abstract
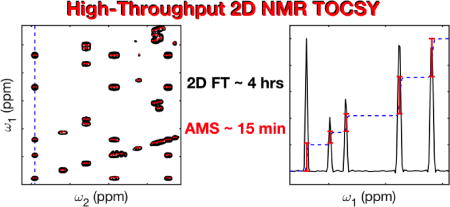
Modern applications of 2D NMR spectroscopy to diagnostic screening, metabolomics, quality control, and other high-throughput applications are often limited by the time-consuming sampling requirements along the indirect time domain t1. 2D Total Correlation Spectroscopy (TOCSY) provides unique spin-connectivity information for the analysis of a large number of compounds in complex mixtures, but standard methods typically require >100 t1-increments for an accurate spectral reconstruction, rendering these experiments ineffective for high-throughput applications. Here, we demonstrate for a complex metabolite mixture how absolute minimal sampling (AMS), based on direct fitting of resonance frequencies and amplitudes in the time domain, yields an accurate spectral reconstruction of TOCSY spectra using as few as 16 t1-points. This permits the rapid collection of homonuclear 2D NMR experiments at high resolution with measurement times that previously were the realm of 1D experiments only.
Keywords: Total correlation NMR spectroscopy, TOCSY, Absolute minimal sampling, AMS, Complex mixture analysis, Metabolomics
COMMUNICATION

Rapid collection of 2D NMR spectra using absolute minimal sampling
Traditionally, high-throughput solution NMR applications have relied almost entirely on 1H 1D NMR, since the NMR time required is typically only a few minutes per sample.[1] However, multi-dimensional NMR offers higher spectral resolution and crucial information about spin-spin interactions allowing the comprehensive analysis of complex mixtures, including those encountered in metabolomics.[2] Homonuclear 2D 1H-1H TOCSY experiments could be particularly useful for this task:[3] they have high 1H sensitivity, allow the identification of entire spin systems at long TOCSY mixing times (τm ≈ 100 ms), and at shorter mixing times (τm ≈ 20 ms) they provide next-neighbor proton connectivity information, similar to information of 2D 1H-1H COSY spectra. However, the standard protocol for the collection of these spectra requires prolonged measurement times, which has prevented their widespread use in high-throughput applications.
We recently demonstrated for 3D protein NMR how accurate spin resonance frequencies can be obtained along indirect frequency dimensions using the absolute minimal sampling (AMS) method.[4] AMS, which is a generalization of SPEED,[5] directly determines spectral parameters, in particular cross-peak positions and their amplitudes, in the time-domain using a non-linear least-squares fitting approach. It differs from CRAFT,[6–7] which uses complete time-domain data. Since certain heteronuclear 3D protein assignment experiments have only very few cross-peaks along any of the indirect dimensions, their frequencies and amplitudes could be extracted using merely 1 to 6 time increments. Homonuclear 2D TOCSY spectra of complex mixtures, by contrast, can have larger numbers of cross-peaks for a given diagonal peak depending on the size of the spin systems, the TOCSY mixing time, and the level of resonance overlap between different spin systems. It is demonstrated here how 2D AMS permits the accurate and reliable extraction of cross-peak frequencies and amplitudes using a surprisingly small number of t1 increments.
For 2D AMS applications, a 2D TOCSY time-domain signal s(t1,t2) is collected like any other data set for processing by regular 2D Fourier transform (FT) or non-uniform sampling (NUS) methods, while the number of t1 increments is kept minimal. The data is first processed along the direct t2-detection dimension in a standard manner (i.e. zero-filling, apodization, Fourier transform, phase correction) yielding the N1×N2 mixed time-frequency matrix Sexp(t1,ω2), where N1 is the number of complex points along t1 and N2 is the number of complex points along ω2. Next, for each frequency ω2, the corresponding trace Sexp(t1,ω2) along t1, sampled at N1 different time points, is represented by a superposition of M exponentially damped sinoids:
| (1) |
where the coefficients Ak correspond to the amplitudes of the complex sinusoids with frequencies ωk and transverse relaxation rates R2,k. These parameters are determined by a non-linear least squares fit that minimizes[4]
| (2) |
Resonance frequencies and amplitudes along ω1 can be quantitatively determined in this way without invoking a Fourier transform and without any regularization. The choice of the N1 increments along t1 can follow a uniform or non-uniform sampling scheme. The number of fitted resonances M is varied while monitoring the reduced χ2 until a plateau is reached. Each of the N2 traces along t1 is fitted independently of each other providing direct insights into the consistency and stability of the fits. The fitted frequencies ωk are allowed to vary within the spectral width SW = 1/Δt1 where Δt1 is the dwell time. Since the maximal evolution time t1,max is kept very short (<15 ms), transverse relaxation effects are minor.
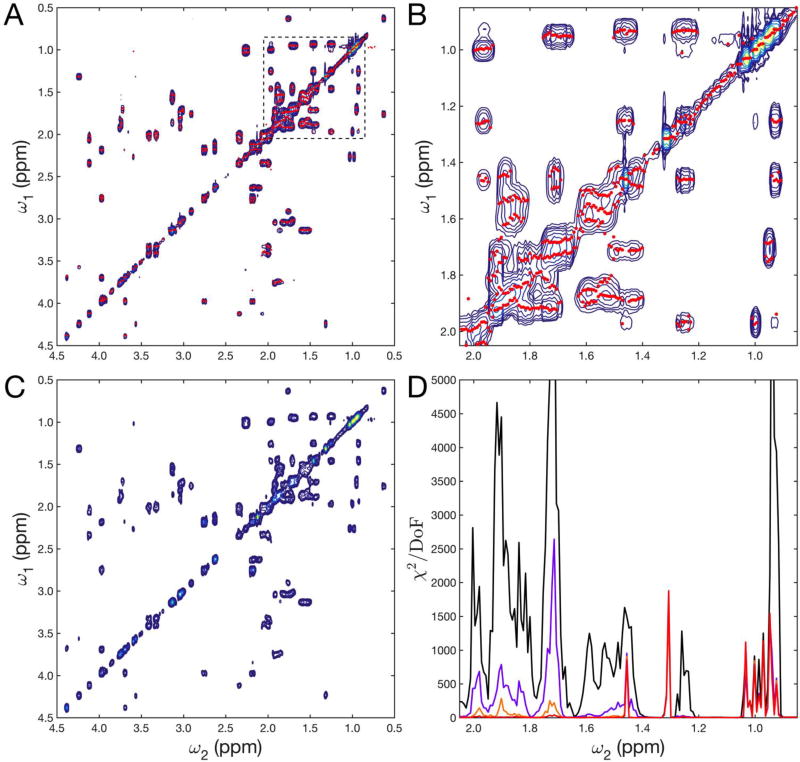
The 2D AMS method is demonstrated for a 2D 1H-1H TOCSY spectrum of a complex metabolite mixture with 14 different compounds in aqueous solution measured at 600 MHz proton frequency using a TXI cryoprobe. It contained the 13 common metabolites alanine, cadaverine, citrulline, isoleucine, lactic acid, leucine, lysine, methionine, ornithine, proline, shikimic acid, threonine, and valine as well as DSS (4,4-dimethyl-4-silapentane-1-sulfonic acid) for chemical shift referencing. The final concentration of each metabolite was 1 mM in 600 µL D2O with 20 mM phosphate buffer and 0.5 mM DSS. Figure 1A,B shows the reference 2D FT TOCSY spectrum (blue contours) measured with 256 complex t1 increments and a mixing time τm = 17.3 ms. The red dots superimposed on the spectrum correspond to the frequencies ωk obtained by 2D AMS with M=8 resonances (Eqs. (1),(2)) fitted independently for cross-sections of Sexp(t1, ω2) along t1 where ω2 was varied systematically across the whole 1H spectrum. A total of only 16 t1 increments were used, sampled at the following integer multiples n of Δt1 = 166.6 µs: n = 0, 1, 2, 3, 4, 6, 9, 13, 18, 24, 31, 39, 48, 58, 69, 81. This sampling scheme is a hybrid between uniform sampling (for the first 5 points) and triangular sampling (for the final 11 points with the gap between successive points increasing linearly). M=2, 4, 6, and 8 resonances were fitted per t1 column with the corresponding reduced χ2 profiles depicted in Figure 1D. For all t1 traces a plateau was reached at or before M=6 or 8 resonances. For few traces, the final reduced χ2 remained relatively high, which is indicative of the presence of t1 noise. This is most pronounced for very sharp resonances, including those of methyl groups around 1 ppm of isoleucine, leucine, and valine. However, this did not affect the accuracy of the fitted AMS frequencies (Figure 1B). Figure 1C shows the reconstructed 2D spectrum by convolution of each 2D AMS frequency pair (ωk, ω2) with a 2D Gaussian kernel function of amplitude Ak and standard deviation of 2 and 10 Hz in the ω2 and ω1 frequency dimension, respectively. The reconstructed 2D AMS spectrum represents a good match of the 2D FT reference spectrum, although it used only 6.25 % of the t1 increments.
Figure 1.
AMS analysis of homonuclear 2D 1H-1H TOCSY spectrum of 14-compound metabolite mixture with a short mixing time of 17.3 ms. A) 2D FT TOCSY spectrum (blue contours) using 256 complex t1 points and AMS results using only 16 complex points (red dots). The region enclosed in the dashed box is enlarged in B. C) Reconstruction of 2D spectrum from AMS results by 2D Gaussian convolution. D) Reduced χ2 of the region shown in B. Solid lines correspond to AMS results with M = 2 (black), 4 (purple), 6 (orange), and 8 (red) fitted frequencies.
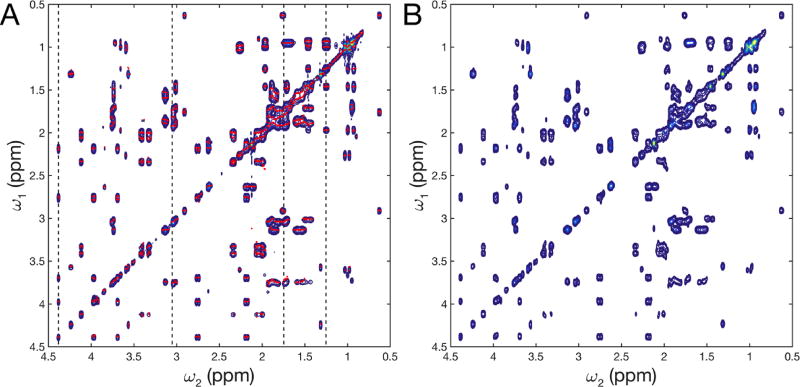
Next, the 2D AMS method was applied to the long-mixing time TOCSY experiment with τm = 97.8 ms of the same mixture, which displays a larger number of cross-peaks. The AMS results for 8 resonances per column, based on the same 16 t1 increments as for the short mixing time TOCSY, agree with the corresponding 2D FT reference spectrum remarkably well (Figure 2). AMS accurately reproduces the peak positions, including peaks that belong to closely spaced peak doublets along ω1. For several traces a significant improvement in χ2 is observed when fitting 8 instead of 6 resonances.
Figure 2.
AMS analysis of 2D 1H-1H TOCSY spectrum of a 14-compound metabolite mixture with a long mixing time of 97.8 ms. A) 2D FT TOCSY spectrum (blue contours) using 256 complex points and AMS results using only 16 complex points (red dots). B) Reconstruction of 2D spectrum from AMS results by 2D Gaussian convolution. Dotted lines in (A) indicate traces shown in Figure 3.
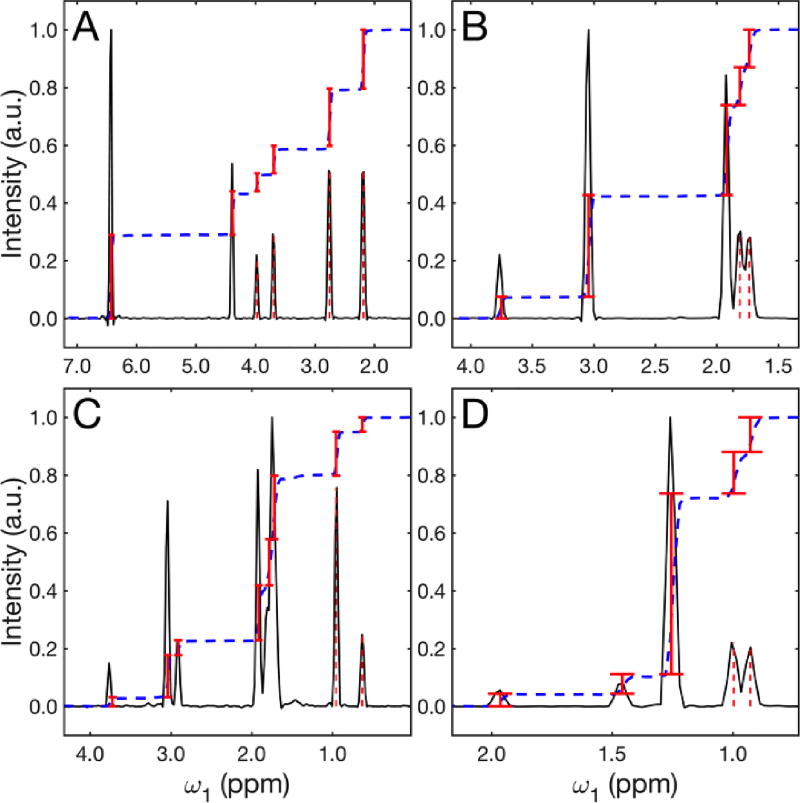
The accurate reproduction of cross-peak volumes is another important consideration for the evaluation of AMS. Figure 3 compares the 2D AMS amplitudes Ak of Eq. (1) with the cross-peak volumes of the 2D FT spectrum for four representative columns. The excellent agreement between the two demonstrates that AMS amplitudes accurately reflect the cross-peak volumes, which is consistent with FT theory. Our results suggests that 2D AMS TOCSY is suitable for quantitative analysis, including the quantitative comparison of the concentration of mixture compounds between different samples, which is highly relevant for metabolomics and other high-throughput applications. The AMS amplitudes are correctly recovered for a dynamic range of 40:1 or more, depending on the signal-to-noise ratios of the t1 traces.
Figure 3.
Quantitative comparison between AMS results and 2D FT cross-peak volumes of Figure 2A. Panels A–D belong to cross-sections taken at 4.38, 3.05, 1.76, and 1.25 ppm, respectively, of Figure 2A and AMS results are shown as red bars. The heights of the red bars correspond to AMS amplitudes Ak (Eq. (1)) and their positions to the AMS-derived frequencies ωk. The dashed blue line shows the cumulative sum of the FT spectrum showing excellent correspondence with the AMS results. The dashed red lines indicate the ω1 positions of the solid red bars.
Alternative methods exist for the reconstruction of 2D TOCSY spectra from a relatively small number of t1 increments. These include covariance NMR[8] or NUS reconstruction and compressed sensing techniques (reviewed recently[9]), which typically require dozens of increments for adequate spectral resolution. Using different NUS software, namely hmsIST[10] and SMILE,[11] the TOCSY spectrum was reconstructed for different sampling schemes using only 16 t1 increments (Figure S1). Both programs do not reproduce the spectral features as well as AMS, particularly in crowded regions and for weaker cross-peaks. The minimal number of increments for compressed sensing algorithms is oftentimes difficult to estimate in advance.[12] For AMS, on the other hand, the relationship between the number of fitting parameters and the required number of t1 points is straightforward obeying N1 ≥ M. Another alternative for the rapid acquisition of homonuclear 2D NMR experiments is single scan 2D NMR.[13–14] However, since the sensitivity scales inverse proportionally with the specified spectral resolution along the indirect dimension, applications are best suited for spectra with limited crowding.
High-throughput NMR applications of complex mixtures mostly rely on 1D 1H NMR spectra, which are sometimes enhanced by 2D J-resolved spectra.[15] Since these spectra do not report about spin connectivities, their information content is limited. 2D TOCSY-type spectra, on the other hand, provide direct access to such information, but suffer from prolonged measurement times when using standard 2D FT processing. 2D AMS takes an inherently different approach, bypassing FT along the indirect dimension in lieu of a direct non-linear least squares fit-based determination of a finite number of resonances without the need for regularization, which differs from compressed sensing[16–17] and maximum entropy reconstruction.[18] As demonstrated here for homonuclear 2D NMR spectra of considerable complexity, AMS permits the accurate extraction of both resonance frequencies and amplitudes using as few as 16 t1 increments representing at least a 16-fold speed-up over standard 2D FT. This makes 2D AMS TOCSY applicable to high-resolution high-throughput applications, which hitherto were the exclusive domain of 1D NMR.
Supplementary Material
Acknowledgments
This work was supported by the NIH (2R01GM066041). All spectra were collected at the CCIC NMR facility at the Ohio State University.
References
- 1.Beckonert O, Keun HC, Ebbels TM, Bundy J, Holmes E, Lindon JC, Nicholson JK. Nat. Protoc. 2007;2:2692–2703. doi: 10.1038/nprot.2007.376. [DOI] [PubMed] [Google Scholar]
- 2.Bingol K, Bruschweiler R. Anal. Chem. 2014;86:47–57. doi: 10.1021/ac403520j. [DOI] [PMC free article] [PubMed] [Google Scholar]
- 3.Braunschweiler L, Ernst RR. J. Magn. Reson. 1983;53:521–528. [Google Scholar]
- 4.Hansen AL, Bruschweiler R. Angew. Chem. Int. Ed. 2016;55:14169–14172. doi: 10.1002/anie.201608048. [DOI] [PMC free article] [PubMed] [Google Scholar]
- 5.Kupče E, Freeman R. Magn. Reson. Chem. 2007;45:711–713. doi: 10.1002/mrc.1931. [DOI] [PubMed] [Google Scholar]
- 6.Krishnamurthy K. Magn. Reson. Chem. 2013;51:821–829. doi: 10.1002/mrc.4022. [DOI] [PubMed] [Google Scholar]
- 7.Krishnamurthy K, Sefler AM, Russell DJ. Magn. Reson. Chem. 2016;55:224–232. doi: 10.1002/mrc.4449. [DOI] [PubMed] [Google Scholar]
- 8.Chen Y, Zhang F, Bermel W, Bruschweiler R. J. Am. Chem. Soc. 2006;128:15564–15565. doi: 10.1021/ja065522e. [DOI] [PubMed] [Google Scholar]
- 9.Kazimierczuk K, Orekhov V. Magn. Reson. Chem. 2015;53:921–926. doi: 10.1002/mrc.4284. [DOI] [PubMed] [Google Scholar]
- 10.Hyberts SG, Arthanari H, Robson SA, Wagner G. J. Magn. Reson. 2014;241:60–73. doi: 10.1016/j.jmr.2013.11.014. [DOI] [PMC free article] [PubMed] [Google Scholar]
- 11.Ying J, Delaglio F, Torchia DA, Bax A. J. Biomol. NMR. 2016 [Google Scholar]
- 12.Shchukina A, Kasprzak P, Dass R, Nowakowski M, Kazimierczuk K. J. Biomol. NMR. 2016 doi: 10.1007/s10858-016-0068-3. [DOI] [PMC free article] [PubMed] [Google Scholar]
- 13.Giraudeau P, Frydman L. Annu. Rev. Anal. Chem. 2014;7:129–161. doi: 10.1146/annurev-anchem-071213-020208. [DOI] [PMC free article] [PubMed] [Google Scholar]
- 14.Le Guennec A, Tea I, Antheaume I, Martineau E, Charrier B, Pathan M, Akoka S, Giraudeau P. Anal. Chem. 2012;84:10831–10837. doi: 10.1021/ac3033504. [DOI] [PubMed] [Google Scholar]
- 15.Ludwig C, Viant MR. Phytochem. Anal. 2010;21:22–32. doi: 10.1002/pca.1186. [DOI] [PubMed] [Google Scholar]
- 16.Kazimierczuk K, Orekhov VY. Angew. Chem. Int. Ed. 2011;50:5556–5559. doi: 10.1002/anie.201100370. [DOI] [PubMed] [Google Scholar]
- 17.Holland DJ, Bostock MJ, Gladden LF, Nietlispach D. Angew. Chem. Int. Ed. 2011;50:6548–6551. doi: 10.1002/anie.201100440. [DOI] [PubMed] [Google Scholar]
- 18.Hoch JC, Maciejewski MW, Mobli M, Schuyler AD, Stern AS. Acc. Chem. Res. 2014;47:708–717. doi: 10.1021/ar400244v. [DOI] [PMC free article] [PubMed] [Google Scholar]
Associated Data
This section collects any data citations, data availability statements, or supplementary materials included in this article.


