

SUMMARY
Processive elongation of RNA Polymerase II from a proximal promoter paused state is a rate-limiting event in human gene control. A small number of regulatory factors influence transcription elongation on a global scale. Prior research using small-molecule BET bromodomain inhibitors, such as JQ1, linked BRD4 to context-specific elongation at a limited number of genes associated with massive enhancer regions. Here, the mechanistic characterization of an optimized chemical degrader of BET bromodomain proteins, dBET6, led to the unexpected identification of BET proteins as master regulators of global transcription elongation. In contrast to the selective effect of bromodomain inhibition on transcription, BET degradation prompts a collapse of global elongation that phenocopies CDK9 inhibition. Notably, BRD4 loss does not directly affect CDK9 localization. These studies, performed in translational models of T cell leukemia, establish a mechanism-based rationale for the development of BET bromodomain degradation as cancer therapy.
In Brief
Winter et al. delineate fundamental differences in the molecular pharmacology of BET bromodomain inhibition and BET protein degradation. Comparative studies led to the identification of BET proteins as master regulators of transcription elongation. Acute BET protein degradation prompts a global collapse of productive elongation that is independent of CDK9 recruitment.
INTRODUCTION
Dysregulation of transcription is a causal event in human malignancies and provides a rationale to exploit non-oncogene addiction to the core transcription machinery (Bradner et al., 2017). Therapeutic approaches to target transcription are exemplified by inhibiting ligand-activated transcription factors (TFs), such as the androgen receptor (AR) and the estrogen receptor (ER). These factors are principal components of a core regulatory circuitry (CRC) essential for cell specification (Saint-André et al., 2016). Regrettably, most TFs lack a ligand-interacting domain or enzymatic function, challenging conventional approaches to therapeutic discovery. Thus, we have pursued the development of small-molecule inhibitors of chromatin-dependent transcriptional signaling. Using inhibitors of the bromodomain and extra-terminal domain (BET) family, we and others have suggested a contributory role for BRD4 in release of promoter-proximally paused RNA Polymerase II (Pol II) for productive transcription elongation (Anand et al., 2013; Lovén et al., 2013). Bromodomain-binding of JQ1 releases BRD4 from chromatin, predominantly at massive enhancer elements (such as super enhancers), resulting in diminution of selected target gene transcription (Lovén et al., 2013). BRD4 has been implicated in pause release by controlling the recruitment of the positive transcription elongation factor b (P-TEFb) (Jang et al., 2005). However, our understanding of BRD4 in the global regulation of productive transcription elongation by Pol II is incomplete, given the limited kinetic resolution of genetic perturbations and the super-enhancer centric effect of bromodomain inhibitors.
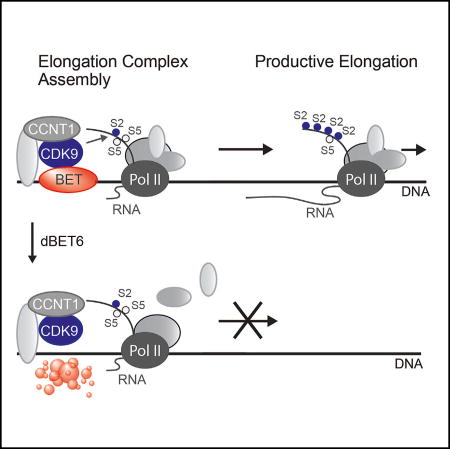
Transition of RNA Pol II from promoter-proximal pausing to productive elongation has emerged as a key rate-limiting step in the expression of almost all active genes (Adelman and Lis, 2012; Margaritis and Holstege, 2008). At the majority of active mammalian genes, RNA Pol II transcribes 20–100 nt before elongation is interrupted by a regulated pause in the promoter-proximal regions (Jonkers et al., 2014; Mayer et al., 2015; Rahl et al., 2010). P-TEFb regulates the release of promoter-proximal pausing genome-wide and consists of the kinase CDK9 and Cyclin T1 (Peterlin and Price, 2006). CDK9 phosphorylates serine 2 residues on the C-terminal repeat domain (CTD) of RNA Pol II, as well as negative transcription elongation factors (NELF and SPT5), leading to the release of RNA Pol II into productive transcription elongation (Adelman and Lis, 2012; Jonkers and Lis, 2015; Peterlin and Price, 2006).
Pharmacologic protein degradation is a powerful approach for probing and disrupting gene regulatory circuitries. Toward the development of a generalizable strategy for targeted protein degradation, we recently created bifunctional small molecules that engage both a target protein and an E3 ubiquitin ligase (cereblon; CRBN) (Winter et al., 2015). This allows potent and selective degradation of target proteins by enforcing proximity of the targeted protein and the E3 ligase, leading to ubiquitination and proteasomal degradation (Lu et al., 2015; Zengerle et al., 2015). A key advantage of targeted protein degradation over traditional inhibitors is the holistic nature of the elicited perturbation. Pharmacologic degradation acutely disrupts all biological functions associated with a target. The associated high kinetic resolution provides a main advantage over genetic perturbations when studying immediate consequences or essential genes. In our index study, we developed a small-molecule degrader of BET family proteins (dBET1). Curiously, degradation of BET bromodomains has a more profound anti-proliferative effect than bromodomain inhibition in models of acute myeloid leukemia (AML) in vivo and in vitro (Winter et al., 2015).
Using an optimized small-molecule degrader (dBET6), we now present mechanistic and translational data in models of T cell acute lymphoblastic leukemia (T-ALL) that explain the profound effect of BET degradation. Degradation of BRD4 allowed extending observations on bromodomain-independent functions. Surprisingly, we identified that acute loss of BRD4 is inconsequential for genome-wide recruitment of CDK9. However, we observed that BRD4 degradation elicits a transcriptional response characterized by a global disruption of productive transcription elongation and a collapse of the core regulatory circuitry, more resembling CDK9 inhibition than BET bromodomain displacement. Provocatively, the acute loss of BRD4 results in an assembly defect of a productive transcription elongation complex. Together, our results leverage fundamental differences in the molecular pharmacology of traditional inhibition and targeted protein degradation to re-define the role of BRD4 in global gene regulation.
RESULTS
Optimization of Improved BET Bromodomain Degraders
The potent anti-proliferative effect of the dBET1 chemical tool reported in AML was not consistently observed in all cell lines (Figure S1A). Inferring a lack of consistent, productive degradation, we undertook chemical optimization of dBET1. To assay dose-dependent effects on BRD4 degradation, we employed a dual luciferase assay (Lu et al., 2014) to study 13 putative BET degraders, comparing them to dBET1 and literature control inhibitors (JQ1, BI2536, UMB-32; Figure 1A) (Ciceri et al., 2014; McKeown et al., 2014). This led to the identification of dBET6 as highly potent degrader with retained cereblon dependence (Figure 1B). Improved potency observed in the dual luciferase reporter assay translated into improved efficacy in degrading endogenous BET family proteins (Figure 1C). dBET6 features highly increased cellular potency with evident degradation in the sub-nanomolar range. Comparatively, dBET1 effectively induced efficient degradation at 100 nM in agreement with previous results (Winter et al., 2015). As expected, BRD4 degradation is rescued by co-incubation with the proteasome inhibitor carfilzomib, the NAE1 inhibitor MLN4924, as well as via competition for BRD4 or CRBN binding with excess JQ1 or thalidomide, respectively (Figure 1D).
Figure 1. Identification and Characterization of dBET6 as a Second-Generation BET Degrader.

(A) Heatmap of BRD4-nluc fusion protein levels normalized to fluc control levels in either 293FTWT or 293FTCRBN−/− cells. Results of 10-point dose-response experiment (n = 4) after 4 hr of drug incubation are summarized as AUC (area under the curve).
(B) Chemical structure of dBET6.
(C) Immunoblot for BRD2, BRD3, BRD4, and Actin following 3 hr drug incubation.
(D) Chemical competition experiments. Immunoblot for BRD4 and Actin after 3 hr incubation of MV4;11 cells with 50 nM of dBET6 and co-incubation with carfilzomib (500 nM), MLN4924 (1 µM), JQ1 (10 µM), or thalidomide (10 µM).
(E) Vehicle-normalized BRD4 (BD1) displacement by AlphaScreen (means ± SD, triplicate analysis).
(F) dBET1-induced ternary complex formation of recombinant BRD4(1) and CRBN-DDB1 by AlphaScreen (means ± SD, triplicate analysis, normalized to DMSO).
(G) Isothermal dose-response fingerprint (CETSA) in intact MOLT4CRBN−/− cells for BRD4 at 47.5°C. Experiment was performed after 3 hr drug incubation (means ± SE, duplicate analysis).
(H) Heatmap of drug consequence on cellular viability as approximated by ATP luminescence measurement using CellTiter-Glo assay. Results of 10-point dose-response experiment (n = 4) after 72 hr drug incubation are summarized as AUC.
(I) Quantification of 5,774 proteins after treatment of MOLT4 cells with 100 nM dBET6 for 2 hr compared to vehicle (DMSO) treatment. Volcano plot displays fold-change in abundance versus observed p value (t test; n = 3).
(J) Rank-ordered predictors distinguishing drug impact of JQ1 and dBET6 as measured in (H).
dBET6: A Highly Cell-Permeable Degrader of BET Bromodomains
To understand the profound potency of dBET6, we studied the binding affinity to BRD4 and CRBN. BRD4 binding was measured by dose-ranging displacement of biotinylated-JQ1 from recombinant, human BRD4 bromodomain 1 (BRD4[1]) by a luminescent proximity assay (AlphaScreen; PerkinElmer). Binding potency of dBET6 and dBET1 was comparable and thus cannot explain the remarkable difference in cellular potency (Figure 1E and Table S1). Further, as measured by AlphaScreen, drug-induced proximity of recombinant human CRBN-DNA damage-binding protein 1 (CRBN-DDB1) and BRD4(1) occurs at a higher concentration for dBET6 than it does for dBET1, rendering it unlikely that the increased potency of dBET6 is due to structural advantages in heterodimerization (Figure 1F) (Winter et al., 2015). Next, we explored differences in cellular target engagement using cellular thermal shift assays (CETSA) (Martinez Molina et al., 2013). Based on the biophysical principle of ligand-induced thermal stabilization of target proteins, this assay allows measuring target engagement in living cells. Using CRBN-deficient cells, we established that dBET6 has significantly improved cellular BRD4 engagement over dBET1 (but not JQ1), suggestive of elevated membrane permeability, subsequently confirmed using standardized Caco-transwell assays (Figures 1G and S1B–S1D). Next, we assessed whether the improved pharmacologic properties would extend over a comprehensive panel of 39 cell lines representative of malignancies of diverse origins. We compared the cytotoxicity of dBET6 to dBET1, dBET5, dBET1R (a negative enantiomeric control incapable of binding to BET bromodomains), and two BET inhibitors, JQ1 and Y803, in various cancer cell lines. We found that dBET6 has a significantly improved activity profile (Figure 1H and Table S2). Importantly, we found that induction of BRD4 degradation was correlated with cellular toxicity (Figure S1E).
To exclude unanticipated off-target degradation events, we performed unbiased quantitative expression proteomics in T-ALL cells (MOLT4) (Huttlin et al., 2010) after 2 hr dBET6 treatment at 100 nM. Out of 5,773 quantified proteins only BET proteins were strongly depleted (Figure 1I and Table S3). In vitro profiling of dBET6 corroborated the BET-selective effect observed by proteomics (Figure S1F). Together, these data confirm the remarkable selectivity of chemically induced degradation and establish dBET6 as an optimized chemical probe of BET protein degradation. While dBET6 was potent in most cancer cell lines studied, we observed an asymmetric sensitivity of human T-ALL cell lines to the optimized BET degrader, prompting further mechanistic and translational investigation (Figures 1J and S1G).
Chemical Degradation of BRD4 as a Rationale for Treating T-ALL
T-ALL is an aggressive, pediatric and adult hematologic malignancy with recurrent alteration of gene regulatory factors and a dependency on the NOTCH1-MYC pathway as a common etiology (Van Vlierberghe and Ferrando, 2012). dBET6 proved potently efficacious, outperforming dBET1 and BET inhibitor controls in a set of 20 T-ALL lines (Figures 2A, 2B, S2A, and S2B and Table S4). Treatment with 100 nM dBET6 leads to degradation of BRD4 after 1 hr, prompting subsequent downregulation of c-MYC and induction of apoptosis. Conversely, treatment with equimolar concentrations of JQ1 does not lead to a significant downregulation of c-MYC and is insufficient to induce apoptosis (Figure S2C). Loss of CRBN renders dBET6 incapable of inducing BET protein degradation or cytotoxicity (Figures 2C, 2D, and S2D–S2F). BRD4 degradation by dBET6 occurs at lower concentrations than required for BRD4 inhibition, consistent with protein turnover without ligand turnover. Moreover, in short-term, ex vivo viability assays of 16 patient-derived T-ALL samples, dBET6 was substantively more active than JQ1 (Figures 2E and 2F and Table S5).
Figure 2. dBET6 Efficacy and CRBN Dependence in T-ALL.

(A) Heatmap as in Figure 1H for a panel of T-ALL cell lines.
(B) Representative dose response curves from (A).
(C) Immunoblot for BRD2, BRD3, BRD4, CRBN, and ACTIN after 3 hr drug treatment of either MOLT4WT or MOLT4CRBN−/− cells.
(D) Dose-proportional effect of JQ1 and dBET6 (72 hr) on MOLT4 cellular viability (WT or CRBN−/−) as approximated by ATP-dependent luminescence (means ± SD, n = 4).
(E) Heatmap of drug consequence on cellular viability in a comprehensive panel of primary T-ALL patient samples as approximated by ATP luminescence measurement using CellTiter-Glo assay. Results of 10-point dose-response experiment after 72 hr of drug incubation are summarized as AUC (n = 3).
(F) Representative dose response curves from (E).
(G) Bioluminescent imaging of mice transplanted with 2 × 10⁶ SUPT11 leukemia cells prior to treatment (day 1) or after 18 days of treatment with vehicle control, JQ1 (7.5 mg/kg BID), or dBET6 (7.5 mg/kg BID).
(H) Percentage of mCherry+ leukemic cells (means ± SEM) in flushed bone marrow from disseminated SUPT11 xenografts as measured by flow cytometry.
(I) Immunoblot analysis of BRD4 and Actin of flushed bone marrow after single treatment with JQ1, dBET6, or dBET1 at concentrations of 7.5 mg/kg.
(J) Kaplan-Meier plot of disseminated MOLT4 xenograft experiment treated for 14 days with either vehicle control (n = 9), JQ1 (20 mg/kg QD, n = 9), or dBET6 (7.5 mg/kg BID, n = 8).
Next, we compared the in vivo efficacy of JQ1 and dBET6 in a disseminated mouse model of T-ALL. SUPT11 cells were stably transduced to express luciferase and mCherry to allow monitoring of disease burden. After 2 weeks, mice with detectable engraftment were randomized into groups and treated either with vehicle control, JQ1 (7.5 mg/kg), or dBET6 (7.5 mg/kg) twice daily for a total of 18 days. Pharmacokinetic studies indicated adequate exposure to dBET6 (Figures S2G and S2H). Both compounds were well tolerated (Figure S4I). We quantified leukemic burden via measuring total body luminescence, which revealed a significant reduction upon dBET6 treatment (Figures 2G and S4J). This was confirmed for dBET6 via post-mortem analysis of leukemic burden in the bone marrow (Figure 2H). In vivo degradation of BRD4 in leukemic bone marrow was shown 3 hr post treatment via immunoblot (Figure 2I). Finally, we set out to explore if continuous treatment of dBET6 over a period of 14 days would lead to a survival benefit in an aggressive, disseminated model of T-ALL (MOLT4). Again, mice treated with dBET6 (7.5 mg/kg BID) exhibited a significant survival benefit compared to mice treated with vehicle control or JQ1 (20 mg/kg QD; Figure 2J).
dBET6 Collapses the Core Transcriptional Circuitry of T-ALL
The mechanistic basis for the increased potency of BET degradation is not understood. We therefore used integrative genomic measurements of chromatin structure and function to elucidate the molecular pharmacology of dBET6 at the level of enhancer-promoter signaling. First, RNA sequencing was performed 2 and 6 hr after treatment with JQ1 or dBET6. Synthetic mRNA-like spike-in controls allowed cell-count normalized measures of RNA abundance (Baker et al., 2005). JQ1 treatment significantly downregulated 1,046 and 2,099 mRNAs 2 and 6 hours post treatment (minimum of 2-fold change, p < 0.05; Figures 3A and 3B). Intriguingly, dBET6 treatment, at a concentration 10-fold lower, prompted a widespread impact on the transcriptional output with 5,029 and 11,473 significantly downregulated mRNAs, respectively (Figures 3A and 3B). This global disruption was also observed when treating a primary PDX sample (T-All-x-1) or naive CD4+/CD45RA+ T cells (Figures S3A and S3B).
Figure 3. Differential Transcriptional Consequence after BET Inhibition and Degradation.

(A) Heatmap of log2 fold changes in gene expression caused by treatment with 1 µM JQ1 or 100 nM dBET6 versus DMSO for 2 and 6 hr. Expression values were normalized to ERCC spike-ins.
(B) Expression levels of all genes ranked by their DMSO expression and their matched counterparts after 2 hr treatment with 1 µM JQ1 or 100 nM dBET6.
(C) Ranked plots of enhancers defined in MOLT4 T-ALL cells ranked by increasing BRD4 signal (units: rpm). Enhancers are defined as regions of BRD4 ChIP-seq binding not contained in promoters. Selected genes are indicated.
(D) Schematic depiction of methodology to infer core transcriptional circuitry from super enhancers.
(E) Boxplot quantification of log2 fold changes on (control) genes proximal to typical enhancers (TE) compared to genes proximal to super enhancers (SE) after 6 hr treatment with 1 µM JQ1 or 100 nM dBET6.
(F) Boxplot quantification of log2 fold changes on all (control) genes or on core regulatory circuitry genes after treatment as in (E). p values in (E) and (F) result from Welch’s two-tailed t test.
(G) Bidirectionally clustered (Pearson) heatmap displaying DMSO-normalized FPKM values of core regulatory circuitry members after treatment as in (A).
See also Figure S3.
To correlate mRNA changes with BRD4 occupancy, we set out to map active enhancers and the genome-wide localization of BRD4 in MOLT4 cells via chromatin immunoprecipitation coupled to highly parallel sequencing. Consistent with prior reports, we found that BRD4 binds chromatin in an asymmetric fashion to form enhancers with disproportional BRD4 load (super-enhancers or SEs), enriched for lineage-specific transcription factors (Figures 3C and S3C) (Whyte et al., 2013). Many of these factors (like MYC, MYB, and TCF7) feature well-established roles in the pathophysiology of T-ALL (Sanda et al., 2012). To explore the regulatory architecture between these TFs, we studied super-enhancers of all expressed TFs for TF binding motifs to model putative co-regulatory networks (schematic in Figure 3D) (Saint-André et al., 2016). This led to a highly interconnected network of co- and auto-regulated TFs characterized by an exceptionally high degree of interconnected regulation (Figure S3D). We postulated that perturbing BRD4 might disproportionally affect transcription of these genes. We hypothesized that they will be addicted to continuous transcription as TF genes are tightly regulated, and tend to feature short-lived mRNAs and proteins, rendering them specifically hypersensitive to global inhibition of transcription. We first compared the fold change of transcripts regulated by enhancers of typical size (TE) to transcripts regulated by super enhancers (SE). While we could recapitulate the SE-bias of JQ1, dBET6 treatment did not preferentially downregulate SE-associated genes (Figure 3E). Next, we compared the fold change of transcripts encoding members of T-ALL CRC genes to non-CRC control genes (Figure 3F). JQ1 downregulates CRC members significantly stronger than control genes, illustrating a bias of BET inhibition to disrupt SE associated transcription. However, the effect over all CRC members is bimodal and driven by a subset of strongly affected genes while others are largely unaffected (Figure 3G). In contrast, the effect of dBET6 on the CRC is much more pronounced (Figure 3F), affecting all CRC-defining TFs (Figure 3G). Notably, we did not observe a preferential CRC collapse in naive CD4+/CD45RA+ T cells using a previously established CRC (Figure S3E) (Saint-André et al., 2016). Interestingly, focusing on c-MYC as a known T-ALL dependency and highly interconnected CRC member, concentrations of JQ1 up to 50-fold higher could not recapitulate the disruptive effect of dBET6 (Figure S3F), arguing for a differential molecular pharmacology that can’t be mimicked by dose escalation. Similarly, we established that the well-documented transcriptional induction of the transcriptional repressor HEXIM1 after treatment with JQ1 is not recapitulated with dBET6 treatment (Figures S3G and S3H).
Next, we correlated global transcriptional consequences to quantitative, genome-wide dynamic loss of BRD4 after compound treatment. For quantitative comparisons, we adapted our recently published experimental strategy to spike-in mouse chromatin as an exogenous normalization strategy (Orlando et al., 2014). MOLT4 cells were treated for 2 hr (as above) to quantify immediate drug consequences. Consistent with prior reports, we observed that JQ1 displaces BRD4 from chromatin with a greater effect on SEs over TEs or transcriptional start sites (TSS) (Figures 4A–4C and 4D–4G for selected cases) (Lové n et al., 2013). In contrast, dBET6 treatment caused systematic depletion of BRD4 from all regulatory elements, notably at a concentration 10-fold lower. Compared to JQ1, the response elicited by dBET6 was extended, was more profound, and also eradicated promoter-bound BRD4 (Figures 4A–4C and 4D–4G for selected cases).
Figure 4. Quantitative Measurement of Drug Impact on Genome-wide BRD4 Load.

(A) Rank ordered heatmap of H3K27ac (gray) and BRD4 levels at transcriptional start sites (TSS) after treatment with 1 µM JQ1 (blue), 100 nM dBET6 (red), or DMSOas vehicle control (black). Each row shows ± 5 kb centered on BRD4 peak. Rows are ordered by max BRD4 in each region (ranking based on DMSO). ChIP-Rx signal (rrpm) is depicted by color-scaled intensities. The ChIP-Rx signal was normalized by spike-in controls.
(B) Same as in (A), but for enhancers.
(C) Boxplot quantification of differential drug effects on BRD4 binding at transcriptional start sites (TSS), all enhancers (ALL), typical enhancers (TE), and super enhancers (SE). p values result from Welch’s two-tailed t test (p < 2 × 10⁻¹⁶ for all indicated comparisons).
(D and E) Gene tracks of ChIP-seq signal for BRD4 after indicated compound treatment and H3K27ac at steady-state conditions at loci (MYC and SOX4 genes) driven by super enhancers. The y axis shows ChIP-seq signal (rpm/bp). The x axis depicts genomic position.
(F and G) Same as in (D) and (E), respectively, but exemplifying genes controlled by typical enhancers.
dBET6 Disrupts Global Productive Transcription Elongation
To ascertain the mechanism underlying global transcriptional inhibition by BET degradation, we assessed drug impact on RNA Pol II localization and post-translational modification. We employed human NET-seq to map drug impact on strand-specific RNA Pol II density by sequencing 30 ends of nascent RNAs emerging from transcribing RNA Pol II (Mayer et al., 2015). Chromatin fractionation was optimized for MOLT4 cells (Figure S4A), and NET-seq experiments were performed in biological duplicates (Figures S4B–S4D). To investigate drug impacts on promoter-proximal pausing of RNA Pol II, we calculated travel ratios (TR) for each gene with promoter-proximal signal in the DMSO sample. The TR reports on the read coverage ratio between a promoter-proximal region (−80 bp to +250 bp around the transcription start site) and the gene body and has previously also been employed in RNA Pol II ChIP-seq experiments (Rahl et al., 2010). An increase in the TR indicates an increase in promoter-proximal pausing and/or a decrease in productive transcription elongation of RNA Pol II. We found that, at this early 2 hr time point, BET bromodomain inhibition has only a mild global impact on pause release (Figures 5A, 5B, S4E, and S4F). In contrast, BET protein degradation prompted a universal increase in promoter-proximal pausing, indicative of a global disruption of transcription elongation (Figures 5A, 5C, S4E, and S4F). While JQ1 had only a mild effect on RNA Pol II pause release at a subset of CRC genes, dBET6 strongly impaired productive elongation of all members that we could quantify with sufficient read coverage (Figures 5B and 5C). Phosphorylation of serine 2 residues on the C-terminal domain (CTD) characterizes productively elongating RNA Pol II and is, among others, mediated by P-TEFb (Peterlin and Price, 2006). To further assess drug impact on this conversion, we performed ChIP-Rx sequencing experiments to map the differential genome-wide distribution of Ser2 phosphorylated RNA Pol II (RNA Pol II CTD Ser2-P) 2 hr after treatment of MOLT4 cells with either JQ1 or dBET6. Examination of individual CRC TFs indicated a strong concordance with the transcriptome results. JQ1 responsive genes, such as MYC, revealed a decrease in RNA Pol II CTD Ser2-P in the gene body after JQ1 treatment, but the disruption is significantly stronger following dBET6 treatment (Figure 5D). Moreover, RNA Pol II CTD Ser2-P signals at TF genes such as SOX4, where bromodomain inhibition failed to reduce mRNA levels, are largely unaffected by JQ1 (Figure 5E). In contrast, dBET6 treatment causes a pronounced disruption of Ser2-P, thus explaining the more pronounced impact of dBET6 on the leukemia core circuitry (Figure 5E). Quantifying Ser2-P signal from gene bodies of all actively transcribed genes, we identified a global decrease specifically for dBET6 treatment (Figure 5F). A pronounced disruption of productive transcription elongation was finally also confirmed in ChIP-Rx experiments for RPB1, the largest RNA Pol II subunit, further corroborating the human NET-seq data (Figure S4G). Notably, we also observed a reduction of Pol II at the TSS of active genes, indicative of an impairment of Pol II recruitment and initiation. However, loss of productively elongating Pol II was significantly stronger and much more pronounced, suggesting that while initiation defects contribute to overall disruption of transcriptional output, they are insufficient to fully explain the ensuing collapse in productive elongation (Figure S4H). Consistent with the NET-seq and total Pol II (RPB1) ChIP-Rx data, this suggests a global disruption of productive transcription elongation following BET degradation.
Figure 5. Disruption of Global Transcriptional Elongation by BET Degradation.

(A) Distributions of the percent of non-overlapping expressed genes passing selection filters in DMSO condition (n = 2,496; see STAR Methods) with a given traveling ratio. The distributions reflect the average of two biological NET-seq replicate measurements after 2 hr treatment with DMSO, JQ1 (1 µM), or dBET6 (100 nM).
(B) Comparison of RNA Pol II traveling ratios between DMSO and JQ1 treatment for genes as in (A). NET-seq reads of biological replicate measurements were combined.
(C) Comparison of RNA Pol II traveling ratios between DMSO and dBET6 treatment for genes as in (A). NET-seq reads of biological replicate measurements were combined.
(D and E) Individual gene tracks of ChIP-seq signal for RNA Pol II Ser2-P at loci of core regulatory circuitry members MYC (D) and SOX4 (E) after 2 hr treatment with JQ1 (1 µM) and dBET6 (100 nM). The y axis shows ChIP-RX seq signal (rrpm/bp). The x axis depicts genomic position.
(F) Boxplot quantification of drug impact on Ser-2 phosphorylated RNA Pol II signal in gene body of all active genes. p value from Welch’s two-tailed t test (p < 2 × 10⁻¹⁶).
See also Figure S4.
Disruption of Productive Elongation Occurs Independent of Genome-wide P-TEFb Recruitment
The effect on Ser2-P led us to assay changes in bulk levels of various CTD-phosphorylation patterns after drug exposure. As expected, JQ1 did not affect bulk RNA Pol II CTD phosphorylation on Ser2, Ser5, or Ser7. Consistent with our ChIP-Rx data, we observed a specific downregulation of Ser2 phosphorylation using dBET6 (Figure 6A). Chemical competition assays indicated that the effect of dBET6 could be outcompeted with excess of JQ1 (Figure 6B), suggesting a bromodomain-independent consequence of degradation. An inhibitory effect of JQ1, dBET1, or dBET6 on catalytic CDK9 activity was not observed (Figure S5A).
Figure 6. BET Degradation Attenuates P-TEFb Activity Independent of Recruitment.

(A) Immunoblot for Pol II and different CTD phosphorylations (S2, S5, S7) and Actin after treatment of MOLT4 cells for 3 hr with indicated drug concentrations.
(B) Immunoblot for RNA Pol II, CTD phosphorylations (Ser2, Ser5), BRD4, and Actin after treatment with dBET6 and/or JQ1 at the indicated concentrations for 4 hr.
(C) Heatmap of log2 fold changes in gene expression caused by treatment with 1 µM JQ1, 100 nM dBET6, or 250 nM NVP-2 versus DMSO for 6 hr. Expression values were normalized to ERCC spike-ins.
(D) Heatmap of CDK9 levels at TSS after treatment with 1 µM JQ1 (blue), 100 nM dBET6 (red), or DMSO as vehicle control (black). Each row shows ± 5 kb centered on TSS. ChIP-Rx signal (rrpm) is depicted by color-scaled intensities. The ChIP-Rx signal was normalized by spike-in controls.
(E) Gene tracks of ChIP-seq signal for CDK9 after indicated compound treatment at the PRCC gene. The y axis shows ChIP-seq signal (rpm/bp). The x axis depicts genomic position.
(F) Boxplot quantification of differential drug effects on CDK9 binding at active TSS. p values from Welch’s two-tailed t test (p < 2 × 10⁻¹⁶ for JQ1, p = 0.081 for dBET6).
(G) Same as in (F), but for active enhancers. p values from Welch’s two-tailed t test (p < 2 × 10⁻¹⁶ for JQ1, p = 1.3 × 10⁻⁸ for dBET6).
(H) Waterfall plot rank-ordered by drug-induced fold changes in BRD4 ChIP-Rx signal at active TSS, overlaid with respective change in CDK9 ChIP-Rx signal of the same locus (2 hr treatment).
(I) Heatmap representation of immunoblot signals of elongating Pol II (CTD Ser2-P) and various factors for chromatin and cytoplasmic fraction generated from dBET6 (100 nM) or JQ1 (1 µM) treated MOLT4 cells (2 hr) as well as for the DMSO control. Quantification by ImageJ 1.47v; original immunoblots are shown in Figures S5J and S5K.
To compare the transcriptomic effects of BET inhibition and degradation to functional P-TEFb inhibition, we treated MOLT4 cells with NVP-2, a potent and selective ATP-competitive inhibitor of CDK9 (Figures S5A and S5B and Table S6) (Barsanti et al., 2011). Interestingly, this revealed that the transcriptional changes after BET degradation correlate closer with ATP-competitive P-TEFb inhibition than BET bromodomain inhibition (Figures 6C and S5C). Moreover, the toxicity profile of dBET6 closely matches NVP-2, and to a lesser extent THZ-1 (CDK7/12/13), but is dissimilar from JQ1 (Figure S5D) (Kwiatkowski et al., 2014). Notably, the disproportional transcriptional impact of dBET6 on the CRC was recapitulated with NVP-2 (Figure S5E), while NVP-2 treatment had no impact on the subcellular distribution of BRD4 (Figure S5F).
Given the postulated role of BRD4 as a P-TEFb recruitment factor, we set out to explore if the transcriptional consequences of targeted BET degradation are due to differential genome-wide P-TEFb binding via CDK9 ChIP-Rx experiments after 2 hr of drug treatment. As expected, we observed highly correlative binding between BRD4 and CDK9 in steady-state (vehicle treated) conditions (Figure S5G). Unexpectedly, we did not observe a significant abrogation of CDK9 binding to active transcriptional start sites (Figures 6D–6F) or active enhancers (Figure 6G) after BET inhibition or BET degradation at this early time point. Further dissecting consequences of BET inhibition and degradation on CDK9 binding to SEs revealed a subtle trend of preferential signal loss that did not reach statistical significance (Figure S5H). This establishes that the immediate, global transcriptional consequences are independent of CDK9 recruitment defects. Conversely, we observed a subtle but significant increase in CDK9 binding at all active TSS (JQ1-treatment) and enhancers (JQ1 and dBET6; Figures 6F–6H, S5H, and S5I). Importantly, the loss of BRD4 at a given locus was not correlated with changes in CDK9 binding (Figures 6H and S5I).
To further characterize the molecular mechanisms that underlie the genome-wide decrease of transcription elongation, we hypothesized that BET degradation perturbs the assembly of the general Pol II transcription elongation complex. To address this hypothesis, we investigated the differential chromatin recruitment of integral subunits of the transcription elongation complex (Figures 6I, S5J, and S5K). We confirmed that BET degradation strongly reduces chromatin RNA Pol II CTD Ser2-P levels without affecting CDK9 or Cyclin T recruitment. Notably, these experiments uncovered a pronounced reduction of several chromatin-associated factors, including SPT5, a key regulator of transcriptional processivity of RNA Pol II (Hartzog et al., 1998; Klein et al., 2011; Martinez-Rucobo et al., 2011), MED1, an integral component of the Mediator complex, as well as of subunits of the NELF complex, and total RNA Pol II itself (Figures 6I and S5J–S5L). Consistent with ChIP-Rx data on RPB1 and RNA Pol II Ser2-P, immunoblot analysis indicates that chromatin engagement of hyperphosphorylated Pol II (IIO) is more sensitive to BET degradation than hypophosphorylated Pol II (IIA) (Figure S5L). Taken together, our data suggest that BRD4 is required for the assembly and maturation of a productive RNA Pol II transcription elongation complex but dispensable for direct P-TEFb recruitment.
DISCUSSION
Targeted protein degradation is experiencing somewhat of a renaissance as a therapeutic concept, buoyed in part by the facile and selective degradation of cellular proteins through E3 ligase recruitment by heterobifunctional small molecules (Winter et al., 2015). Still, significant challenges face the clinical translation of prototypical chemical probes, as drug-like properties are optimized for in vivo utility. Here, we report the synthesis and mechanistic characterization of a chemically optimized, highly potent, and broadly active degrader of BET family proteins (dBET6) that features pronounced efficacy in T cell acute lymphoblastic leukemia (T-ALL) in vitro and in vivo.
The marked increase in anti-cancer activity of BET degradation (dBET6) and BET bromodomain inhibition (JQ1) prompted a mechanistic reconsideration of BET co-activator function in transcription regulation, enabled by this chemical tool. We identified that dBET6 treatment leads to a widespread decrease in steady-state mRNA levels, but observed an incommensurate impact on expression of members of the core regulatory circuitry of leukemogenic TFs. The collapse of the core transcriptional machinery prompted by BET degradation precedes a robust apoptotic response, of apparent translational significance. We hypothesize that the hypersensitivity of T-ALL models stems from a strong dependency on continuous, uninterrupted transcription of a core regulatory circuitry of short-lived oncogenes and lineage factors. Indeed, an elevated dependency of T-ALL on the core transcriptional machinery has previously been reported, but the definitive assessment of a therapeutic window in human clinical investigation will require careful clinical investigation (Kwiatkowski et al., 2014).
Mechanistically, a combined approach of NET-seq and ChIP-Rx identified that targeted BET degradation disrupts productive transcriptional elongation on a global scale after only 2 hr of treatment. Notably, BET bromodomain inhibition has only a minor impact on global transcription elongation at this early time point. Unexpectedly, we found that acute degradation of BRD4 attenuates phosphorylation of the carboxy-terminal domain (CTD) serine 2 residues of RNA Pol II over the gene-body region. To our surprise, at this immediate time point, we did not observe significant abrogation of chromatin-engaged CDK9. We cannot rule out that the recruitment of CDK9 and Cyclin T1 will be affected subsequently, as a direct or indirect consequence. Indeed, previous studies have reported a SE-centric recruitment defect of CDK9 after 6 hr of continuous BET inhibitor treatment (Lové n et al., 2013), but secondary effects may influence P-TEFb recruitment at this late time point owing to effects on c-MYC and other transcriptional pathways (Rahl et al., 2010). In the present study, we unambiguously observe that immediate effects on CTD phosphorylation and global productive elongation are independent of changes in chromatin-bound CDK9 levels, upon loss of BET elongation factors.
The global loss of RNA Pol II CTD Ser2 phosphorylation over the gene-body regions of active genes upon BET degradation suggested that the maturation of the productive elongation complex is disturbed. We found that BET degradation led to chromatin displacement of different regulatory factors including SPT5, subunits of the NELF complex, and MED1.
Altogether, our data suggest that BET elongation factors orchestrate the formation of a functional elongation complex and productive transcription. In their absence, the transition of promoter-proximally paused RNA Pol II into productive transcription elongation is disrupted as indicated by the global decrease of RNA Pol II occupancy and of RNA Pol II CTD Ser2-P levels over the gene-body region. Interestingly, in recombinant enzymatic assays, BRD4 has also been described as a positive regulator of CDK9 kinase activity (Itzen et al., 2014), which could also factor into the observed block in transcription elongation following BRD4 degradation.
In contrast to BET degradation, BET inhibition had only a mild impact on Ser2-phosphorylation, elongation factor recruitment, and productive transcription elongation. This is most likely due to residual levels of chromatin-bound BRD4 after JQ1 treatment that might be sufficient to sustain the assembly of a functional transcription elongation complex and thus productive transcriptional elongation. Our study establishes protein degradation as a powerful approach to dissect gene regulatory factors at an unprecedented kinetic resolution that could not have been achieved by conventional genetic perturbation strategies. Further research efforts will be directed toward identifying the comprehensive changes to the chromatin-associated proteome following acute BRD4 loss and the functional involvement of SPT5 and Mediator in the observed block in transcription elongation. Moreover, future studies will address why CDK9 recruitment is not sufficient for promoter-proximal pause release in the absence of BET proteins, as well as possible resulting implications of BET degradation on higher-order chromatin structures, enhancer-promoter looping, and chromosomal neighborhoods.
This research establishes BET bromodomains, and BRD4 in particular, as master regulators of global transcription elongation via organizing the genome-wide assembly of a productive transcription elongation complex. Moreover, it establishes that BET degradation is mechanistically distinct from BET bromodomain inhibition in its ability to disrupt this essential gene regulatory mechanism.
STAR⋆METHODS
Detailed methods are provided in the online version of this paper and include the following:
KEY RESOURCES TABLE
CONTACT FOR REAGENT AND RESOURCE SHARING
-
EXPERIMENTAL MODEL AND SUBJECT DETAILS
Mice and Animal Housing
Cell lines
Patient derived cells
-
METHOD DETAILS
BRD4 AlphaScreen assay
BRD4-CRBN-DDB1 dimerization assay
BRD4 dual luciferase assay
Immunoblotting
CRISPR genome editing
Patient derived xenograft experiment
Pharmacokinetic studies
MOLT4 and SUPT11 xenograft experiment
CDK9/CycT1 inhibition assays
Protein expression and purification
Cellular thermal shift assay (CETSA)
Proteomics
FACS-based cell cycle and apoptosis analysis
RNA-sequencing with ERCC RNA spike-in mix
Chromatin Immunoprecipitation followed by highly parallel sequencing (ChIP-Seq)
Chromatin Immunoprecipitation with reference exogenous genome standards followed by highly parallel sequencing (ChIP-RX)
Library preparation for ChIP-Seq and ChIP-RX
ChIP-seq data processing
Native elongating transcript sequencing (NET-seq)
Chemical synthetic procedures
QUANTIFICATION AND STATISTICAL ANALYSIS
-
DATA AND SOFTWARE AVAILABILITY
Software
Data Resources
STAR⋆METHODS
CONTACT FOR REAGENT AND RESOURCE SHARING
Further information and requests for reagents may be directed to, and will be fulfilled by, the Lead Contact, James Bradner (james.bradner@novartis.com).
EXPERIMENTAL MODEL AND SUBJECT DETAILS
Mice and Animal Housing
Female NOD.Cg-PrkdcscidIl2rgtm1Wjl/SzJ (NSG) mice at 3-4 weeks age were purchased from The Jackson Laboratory. Mice were grouped by 5 animals in large plastic cages and were maintained under pathogen-free conditions. All animal experiments were performed with the approval of Dana-Farber Cancer Institute’s Institutional Animal Care and Use Committee (IACUC).
Cell lines
T-ALL cell lines (SKW3, HBPALL, CUTTL1, DU528, KOPTK1, P12ICHIKAWA, DND41, JURKAT, PF382, SUPT13, SUPT11, HSB2, MOLT4, CCRFCEM, PEER, ALLSIL, LOUCY, MOLT16, RPMI8402, TALL1) were provided by the laboratory of Prof. Thomas A. Look. Lymphoma cell lines (Ly7, Ly18, DHL4, Karpas620) were a kind gift of Prof. Margaret Shipp and AML cell lines (MV4;11, MOLM13, RS4;11, SEMK2, Mono Mac 1) were provided by the laboratory of Prof. Scott Armstrong. Breast Cancer lines (MDA-MB-436, SUM1315, SUM185, MDA-MB-231, T47D, HCC1315)) were a kind gift from Prof. Kornelia Polyak. Lung Cancer Cell lines (Calu 3, LouNH91, HCC95, H2122, NCI-H460, SBC5, LCLC103H, NCIH441, NCIH838) as well as cell lines from other origins than the ones outlined above (KPNYN, HCT116, MC116, CI1, G401, BT16, PxPC3, NMC-G1, SW1783, MKN45, SKMEL28) were obtained from the Broad Institute cell line database or purchased from ATCC. 293FT cells were purchased from Life Technologies, 293FTCRBN−/− were kindly provided by Prof. William Kaelin.
Patient derived cells
Primary human T-ALL samples were obtained from children with T-ALL enrolled on clinical trials of the Dana-Farber Cancer Institute or UMASS Memorial Hospital. ETP-ALL samples were provided by Michelle Hermiston and the COG. Samples were collected with informed consent and with approval of the Institutional Review Board. Detailed clinical information can be found in Table S5.
METHOD DETAILS
BRD4 AlphaScreen assay
AlphaScreen assays were performed with minimal modifications from the manufacturer’s protocol (PerkinElmer, USA). All reagents were diluted in 50 mM HEPES, 150 mM NaCl, 0.1% w/v BSA, 0.01% w/v Tween20, pH 7.5 and allowed to equilibrate to room temperature prior to addition to plates. After addition of Alpha beads to master solutions all subsequent steps were performed under low light conditions. A 2x solution of components with final concentrations of His-BRD4(1) (see protein expression section) at 40 nM, Ni-coated Acceptor Bead at 10 µg/mL, and 20 nM biotinylated-JQ1 (Anders et al., 2014) was added in 10 µL to 384-well plates (AlphaPlate-384, PerkinElmer, USA). Plates were spun down at 150x g, 100 nL of compound in DMSO from stock plates were added by pin transfer using a Janus Workstation (PerkinElmer, USA). The streptavidin-coated donor beads (10 µg/mL final) were added as with previous the solution in a 2x, 10 µL volume. Following this addition, plates were sealed with foil to prevent light exposure and evaporation. The plates were spun down again at 150xg. Plates were incubated at room temperature for 1 hr and then read on an Envision 2104 (PerkinElmer, USA) using the manufacturer’s protocol.
BRD4-CRBN-DDB1 dimerization assay
To detect CRBN-DDB1/BRD4 dimerization by dBET1 or dBET6, we adapted bead-based AlphaScreen technology. In brief, GST-BRD4[49-170] (Sigma Aldrich) and CRBN-DDB1 (see protein expression section) were diluted to 125 nM and 250 nM, respectively, in assay buffer (50 mM HEPES pH 7.4, 200 mM NaCl, 1 mM TCEP, and 0.1% BSA) and 20 uL of protein mixture was added to each well of a 384-well AlphaPlate (PerkinElmer). Compounds were then added at 100 nL per well from DMSO stock plates using a CyBi-Well vario pin tool. After 1 hr incubation at room temperature, Nickel Chelate AlphaLISA Acceptor and Glutathione AlphaLISA Donor beads (PerkinElmer) were diluted in assay buffer to a 2X concentration (20 ug/ul) and added at 20 uL per well. Plates were incubated for 1 hr at room temperature prior to luminescence detection on an Envision 2104 plate reader (PerkinElmer). For competition assays, GST-BRD4[49-170] and CRBN-DDB1 were diluted as above in the presence of 111 nM dBET1. Compound addition and subsequent detection was performed as described above.
BRD4 dual luciferase assay
293FTWT and 293FTCRBN−/− cells were stably transduced with lentiviral vector encoding for EF1a-IRES-BRD4-Nluc-HA-IRES-Fluc. Expression was verified by immunoblot for BRD4 and HA. Cells were seeded at 4000 cells per well (384 well format) in 20 ul and incubated overnight at 37°C. The next day, assay compounds were added and incubated for 4hr at 37°C followed by 1hr at room temperature. 25 ul of buffer 1 (Fluc-Buffer: 200 mM Tris, 15 mM MgSO4, 100 uM EDTA, 1mM DTT, 1mM ATP, 200 uM Coenzyme A, 400 uM D-Luciferin, 0.1% Triton X-100) were added, incubated for 15 min at room temperature and read for luminescence. Then, 25 ul of Buffer 2 (Nluc-stop and glow Buffer: 25 mM Na4PPi, 10 mM NaOAc, 15 mM EDTA, 500 mM NaSO4, 500 mM NaCl, 50 uM Phenyl-benzothiazole, 16 uM Coelenterazine) were added, incubated for 15 min at room temperature and read for luminescence. Nluc/Fluc ratios were for comparative measurements between compounds.
Immunoblotting
Cells were lysed using RIPA buffer supplemented with protease inhibitor cocktail (Roche) and 0.1% benzonase (Novagen) on ice for 15 min. The lysates were spun at 16000xg for 15 min on 4°C and protein concentration was determined using BCA assay (Pierce). The following primary antibodies were used in this study: BRD2, BRD3 and BRD4 (Bethyl Labs), MYC, Pol II, tubulin, actin and vinculin (Santa Cruz), CRBN (Proteintech), PARP, cleaved caspase 3 (Cell Signaling Technology), Hexim1 and BRD3 (Abcam). Antibodies recognizing phosphorylation states on the Pol II CTD were purchased from Active Motif (Ser2-P: 3E10, Ser5-P: 3E8, Ser7-P:4E12) Blots were imaged using fluorescence-labeled secondary antibodies (LI-COR) on the OdysseyCLxImager (LI-COR).
CRISPR genome editing
MOLT4 cells deficient for CRBN expression were generated by cloning two different sgRNA sequences (TAAACAGACATGGCCGGCGA, GTCCTGCTGATCTCCTTCGC) into the pSpCas9(BB)-2A-GFP (PX458) expression vector (Ran et al., 2013). MOLT4 cells were transiently transfected, incubated for 48 hr and then GFP positive cells were sorted into 96 well plates. Single cells were expanded and analyzed via immunoblotting for CRBN.
Patient derived xenograft experiment
Leukemic blasts were isolated from peripheral blood or bone marrow by Ficoll-Hypaque centrifugation and cryopreserved in FBS containing 10% DMSO and stored in liquid nitrogen. Fresh or frozen leukemic blasts were expanded in NSG mice by transplanting 0.5-5x10⁶ viable leukemic cells via intravenous injection. Primary human T-ALL samples were isolated from the spleen and bone marrow of NSG mice and were cultured at 37°C under 5% CO2 in the following media Alpha-MEM 1x + Glutamax-1 (GIBCO 32571-036), 10% FBS, 10% human AB serum (Sigma H4522-100ML), 1% L-glutamine,1% penicillin/streptomycin, 1x Insulin-Transferrin-Selenium (GIBCO 41100-045), 10ng/ml recombinant mouse IL-7 (Peprotech #217-17) and 10ng/ml recombinant human IL-2 (Peprotech #200-02). Viable primary T-ALL cells were plated in 3 replicates in black opaque flat bottom 96-well tissue culture plates at 100,000 cells per well for 3 days and treated with increasing concentrations of JQ1 or dBET6. Cell proliferation was measured using the CellTiter-Glo Luminescent Cell viability assay from Promega as described by the manufacturer and normalized to DMSO treated controls.
Pharmacokinetic studies
Pharmacokinetic studies were performed at ChemPartner (Shanghai). Briefly, Male CD-1 mice were injected with dBET6 at 10 mg/kg IP. IP dosing solution was prepared in 40% captisol in water. Blood and plasma were isolated at specific intervals post-administration (0, 0.083, 0.25, 0.5, 1, 2 and 4 hr) and tested for quantification of test article by LC/MS/MS (n = 3 mice/time point). Mean concentration-time profiles were used to calculate drug exposure in the plasma.
MOLT4 and SUPT11 xenograft experiment
MOLT4 human T-ALL cells (mCherry+ and Luciferase+) (Kimbrel et al., 2009) were intravenously injected into NSG mice (2x10⁶ cells/mouse). Luminescence was utilized to monitor engraftment (evident at day 6), at which point mice were randomized into three cohorts that received dBET6 (7.5 mg/kg BID, n = 8), JQ1 (20mg/kg QD, n = 9) or vehicle (captisol, n = 9) treatment for 14 days. Survival of all three cohorts was subsequently monitored using hind limb paralysis caused by high femoral leukemic burden as a defined endpoint. SUPT11 human T-ALL cells (mCherry+ and Luciferase+) were intravenously injected into NSG mice (2.5x10⁶ cells/mouse). Luminescence was used to monitor successful engraftment, occurring 10 days after injection. At this point, animals were randomized into three cohorts that received dBET6 (7.5 mg/kg BID, n = 7), JQ1 (7.5 mg/kg BID, n = 7) or vehicle (captisol, n = 7) treatment for 18 days. Treatment burden was assessed via total body luminescence imaging as well as by bone marrow infiltration by mCherry+ T-ALL cells. All in vivo data was generated using IACUC approved protocols and adhered to institutional standards.
CDK9/CycT1 inhibition assays
CDK9/CycT1 inhibition assays were performed using the commercially available ADAPTA assays from ThermoFisher, according to the manufacturer’s instructions. Briefly, CDK9/CycT1 (ThermoFisher) was diluted to 0.5 ug/mL into kinase buffer A (50 mM HEPES (pH 7.5), 10 mM MgCl2, 1 mM EGTA, and 0.01% Brij-35), and 5 uL was then plated into a 384 well plate (Corning 4512). 100 nL of DMSO containing varying concentrations of compound were pinned into each well. 5 uL of a substrate solution containing 0.1 mM CDK7/9-tide (ThermoFisher), 0.02 mM ATP in kinase buffer A was then added to each well. The plate was covered and incubated for 1 hr at room temperature. 5 uL of dilution buffer (30 mM EDTA, 6 nM AdaptaTM Eu-anti-ADP Antibody, 18 nM Alexa Fluor 647 ADP Tracer in TR-FRET dilution buffer) was added to each well. The plate was covered and incubated for 30 min at room temperature. The ratio of fluorescence at 665/615nM was then analyzed using an Envision plate reader.
Protein expression and purification
Human BRD4 residues 44-168 (His-BRD4(1)) in the pNIC28-Bsa4 vector (Addgene) for use in AlphaSceen assays was expressed and purified as previously described (Tanaka et al., 2016; Winter et al., 2015). Expression and purification of CRBN-DDB1 were performed as described previously in Fischer et al. (2014) using Sf9 cells (Invitrogen). pFastBac vectors encoding human CRBN (residues 1-442) and DDB1 (residues 1-1140) were a kind gift from Nicolas Thomä and Eric Fischer.
Cellular thermal shift assay (CETSA)
MOLT4 cells deficient in CRBN expression were treated with various concentrations of either dBET1 or dBET6 for 3 hr. Cells were collected by centrifugation, washed once with PBS and transferred into PCR tubes, spun down and incubated at 47.5°C for 3 min. After a subsequent incubation for 3 min on 25°C, cells were lysed by addition of 30 µL lysis buffer (50 mM Tris-HCl, 100 mM NaCl, 0.2% NP-40, 5% glycerol, 1.5 mM MgCl2, 25 mM NaF, 1 mM Na3VO4, 1 mM phenylmethylsulfonyl fluoride, 1 mM dithiothreitol (DTT) supplemented with protease inhibitor cocktail (Roche)) and three repeated freeze-thaw cycles using liquid nitrogen. Precipitated proteins were separated from the soluble fraction via centrifugation at 15000 g for 20 min at 4°C in 1.5ml microcentrifuge tubes. SDS loading buffer was added to the soluble fraction and samples were incubated at 95°C for 5 min prior to loading.
Proteomics
Sample preparation for quantitative mass spectrometry analysis
Samples were prepared as previously described in Weekes et al. (2014) with the following modification: All solutions are reported as final concentrations. Lysis buffer (8 M Urea, 1% SDS, 50 mM Tris pH 8.5, Protease and Phosphatase inhibitors from Roche) was added to the cell pellets to achieve a cell lysate with a protein concentration between 2-8 mg/mL. A micro-BCA assay (Pierce) was used to determine the final protein concentration in the cell lysate. Proteins were reduced and alkylated as previously described. Proteins were precipitated using methanol/chloroform. In brief, four volumes of methanol was added to the cell lysate, followed by one volume of chloroform, and finally three volumes of water. The mixture was vortexed and centrifuged to separate the chloroform phase from the aqueous phase. The precipitated protein was washed with one volume of ice-cold methanol. The washed precipitated protein was allowed to air dry. Precipitated protein was resuspended in 4 M Urea, 50 mM Tris pH 8.5. Proteins were first digested with LysC (1:50; enzyme:protein) for 12 hr at 25°C. The LysC digestion is diluted down to 1 M Urea, 50 mM Tris pH8.5 and then digested with trypsin (1:100; enzyme:protein) for another 8 hr at 25°C. Peptides were desalted using a C18 solid phase extraction cartridges as previously described. Dried peptides were resuspended in 200 mM EPPS, pH 8.0. Peptide quantification was performed using the micro-BCA assay (Pierce). The same amount of peptide from each condition was labeled with tandem mass tag (TMT) reagent (1:4; peptide:TMT label) (Pierce). The 10-plex labeling reactions were performed for 2 hr at 25°C. Modification of tyrosine residue with TMT was reversed by the addition of 5% hydroxyl amine for 15 min at 25°C. The reaction was quenched with 0.5% TFA and samples were combined at a 1:1:1:1:1:1:1:1:1:1 ratio. Combined samples were desalted and offline fractionated into 24 fractions as previously described.
Liquid chromatography-MS3 spectrometry (LC-MS/MS)
12 of the 24 peptide fraction from the basic reverse phase step (every other fraction) were analyzed with an LC-MS3 data collection strategy (McAlister et al., 2014) on an Orbitrap Fusion mass spectrometer (Thermo Fisher Scientific) equipped with a Proxeon Easy nLC 1000 for online sample handling and peptide separations. Approximately 5 µg of peptide resuspended in 5% formic acid + 5% acetonitrile was loaded onto a 100 µm inner diameter fused-silica micro capillary with a needle tip pulled to an internal diameter less than 5 µm. The column was packed in-house to a length of 35 cm with a C18 reverse phase resin (GP118 resin 1.8 µm, 120 Å, Sepax Technologies). The peptides were separated using a 120 min linear gradient from 3% to 25% buffer B (100% ACN + 0.125% formic acid) equilibrated with buffer A (3% ACN + 0.125% formic acid) at a flow rate of 600 nL/min across the column. The scan sequence for the Fusion Orbitrap began with an MS1 spectrum (Orbitrap analysis, resolution 120,000, 400–1400 m/z scan range, AGC target 2 × 10⁵, maximum injection time 100 ms, dynamic exclusion of 75 s). ‘Top N’’ (the top 10 precursors) was selected for MS2 analysis, which consisted of CID (quadrupole isolation set at 0.5 Da and ion trap analysis, AGC 4 × 10³, NCE 35, maximum injection time 150 ms). The top ten precursors from each MS2 scan were selected for MS3 analysis (synchronous precursor selection), in which precursors were fragmented by HCD prior to Orbitrap analysis (NCE 55, max AGC 5 × 10⁴, maximum injection time 150 ms, isolation window 2.5 Da, resolution 60,000.
LC-MS3 data analysis
A suite of in-house software tools were used to for .RAW file processing and controlling peptide and protein level false discovery rates, assembling proteins from peptides, and protein quantification from peptides as previously described. MS/MS spectra were searched against a Uniprot human database (February 2014) with both the forward and reverse sequences. Database search criteria are as follows: tryptic with two missed cleavages, a precursor mass tolerance of 50 ppm, fragment ion mass tolerance of 1.0 Da, static alkylation of cysteine (57.02146 Da), static TMT labeling of lysine residues and N-termini of peptides (229.162932 Da), and variable oxidation of methionine (15.99491 Da). TMT reporter ion intensities were measured using a 0.003 Da window around the theoretical m/z for each reporter ion in the MS3 scan. Peptide spectral matches with poor quality MS3 spectra were excluded from quantitation (< 200 summed signal-to-noise across 10 channels and < 0.5 precursor isolation specificity).
FACS-based cell cycle and apoptosis analysis
Analysis of apoptosis by flow cytometry
For each sample, cells were washed with 500 µL of PBS and spun down at 400xg for 5 min and media aspirated off. Cells were then resuspended in Annexin V binding buffer: 140 mM NaCl, 10 mM HEPES, 2.5 mM CaCl2, pH 7.4 and 500 µL of each sample transferred to 5mL polystyrene FACS tubes (Falcon Cat. No. 352054). Cells were spun down at 400xg for 5 min and buffer aspirated off. To each sample, 400 µL of Annexin V binding buffer with 250 ng/mL FITC-Annexin V and 500 ng/mL propidium iodide were added for staining. Cells were then sorted on a BD LSRFortessa and analyzed using FlowJo V10 software (Tree Star, Inc).
Analysis of cell cycle by flow cytometry
After treatment, cells were washed with PBS and then fixed overnight at −20°C in 70% ethanol. Cells were washed once more with PBS and then incubated at 37°C for 20 min in PI staining solution: 20 µg/ml propidium iodide (Life Technologies, P1304MP), 0.1% (v/v) Triton X-100 in PBS, supplemented with 200 µg/mL RNase A (Roche, 10109169001). Flow cytometry analyses were performed on a LSRFortessa X-20 flow cytometer (BD Biosciences) and all data analyzed with FlowJo software (v10, Tree Star).
RNA-sequencing with ERCC RNA spike-in mix
All samples were prepared in biological triplicates. 5x10⁵ Cells were treated for 2 or 6 hr with either 1 µM JQ1, 100 nM dBET6 or DMSO at equal concentration as vehicle control. Total RNA was isolated using the mirVana RNA isolation kit and ERCC spike in controls (Life Technologies) were added to cell count normalized organic RNA extracts at the earliest point in the RNA isolation protocol. To reduce residual DNA contaminations, RNA extracts were treated with RNAase-free DNase I (Ambion). Library prep was conducted using TruSeq Stranded mRNA Library Prep Kit. Fasq files were aligned to hg19 using HiStat with default parameters. Transcript abundance was calculated using cuffquant module of Cufflinks (Trapnell et al., 2010). FPKM values were calculated and normalized using Cuffnorm. We considered genes that had a p < 0.05 and at least a two-fold change to be significantly altered between treatments. Cutoff value for expressed genes was an FPKM value equal or higher to 1.
Chromatin Immunoprecipitation followed by highly parallel sequencing (ChIP-Seq)
ChIP-Seq was performed as described in Rahl et al. (2010) with minor modifications. In brief, approximately 1x10⁸ cells were cross-linked with 1.1% formaldehyde (10 X crosslink solution contains: 11% formaldehyde, 50 mM HEPES pH 7.3, 100 mM NaCl, 1 mM EDTA pH 8.0, 0.5 mM EGTA pH 8.0) followed by 3 washes with PBS. Nuclei are isolated as described previously in Rahl et al. (2010) and sonication is performed on ice for a total of 3 min (1 s on, 4 s off) to enrich for a fragment size between 200 and 700 bp. Sonicated lysates were cleared by centrifugation at 20,000 g for 10 min and incubated overnight on a spinning wheel at 4°C with magnetic beads prebound with antibody (H3K27ac, Abcam). Beads were washed three times with sonication buffer, one time with sonication buffer with 500 mM NaCl added, one time with LiCl wash buffer (20 mM Tris pH 8.0, 1 mM EDTA, 250 mM LiCl, 0.5% NP-40, 0.5% Na-deoxycholate) and once with TE. DNA was eluted in elution buffer (50 mM Tris-HCl pH 8, 10 mM EDTA, and 1% SDS). Cross-links were reversed overnight at 65°C. RNA and protein were digested with 0.2 mg/mL RNase A for 2 hr followed by 0.2 mg/mL Proteinase K for 1 hr. DNA was purified with phenol chloroform extraction and ethanol precipitation. Libraries for Illumina sequencing were prepared using ThruPLEX DNA-seq Kit (Rubicon) using 50 ng of immunoprecipitated DNA as starting point. Libraries were quantified by qPCR using the KAPA Biosystems library quantification kit and sequenced on a Illumina NextSeq 500 (single end 75 bp reads).
Chromatin Immunoprecipitation with reference exogenous genome standards followed by highly parallel sequencing (ChIP-RX)
For each ChIP-RX-seq experiment, a ratio between 5:1 and 10:1 of human:mouse (Baf3) cells was used, corresponding to 1x10e8-1.5x10e8 MOLT4 cells and 15-30x10e6 Baf3 cells per chromatin immunoprecipitation. In brief MOLT4 cells were treated with either 1 µM JQ1, 100 nM dBET6 or DMSO at equal concentration as vehicle control. Treated human (MOLT4) cells as well as untreated murine Baf3 cells (spike-in controls) were cross-linked with Formaldehyde for 10 min at room temperature. Nuclei were isolated as described in Rahl et al. (2010), starting from a 5:1 mixture of fixed cells (MOLT4:Baf3) and subsequently treated like a regular ChIP-seq experiment (see above) in terms of sample preparation. The following antibodies have been used for ChIP-Rx experiments (BRD4: Bethyl labs, Pol II S2-P: Active Motif, CDK9, RPB1: Santa Cruz Biotechnology). Importantly, in order to have statistical power to assigning a given read to either mm9 or hg19, paired-end reads (75bp) or single-end 150 bp reads have been used (Illumina NextSeq 500). Data demultiplexing and scaling has been performed as previously described for Drosophila chromatin spike-in normalized experiments but adapted to the mouse genome (Orlando et al., 2014).
Library preparation for ChIP-Seq and ChIP-RX
Libraries for sequencing were prepared using the Rubicon Thruplex DNA-seq/FD library preparation kit. An input of 50 ng of DNA or less were used and following ligation libraries were amplified per manufacturer’s instructions. Amplified libraries were then size-selected using AMPure beads (Agencourt AMPure XP) per manufacturers instruction. Further size selection was performed using a 2%gel cassette in the Pippin Prep (SAGE Sciences) set to capture fragments between 200 – 700 base pairs. Libraries were multiplexed at equimolar ratios and run together on a NextSeq.
ChIP-seq data processing
Sequence alignment
All datasets were aligned using Bowtie2 (version 2.2.1) to build version NCBI37/HG19 (Langmead et al., 2009). Alignments were performed using all default parameters except for –N 1. These criteria preserved only reads that mapped uniquely to the genome with one or fewer mismatches.
Calculating read density
We calculated the normalized read density of a ChIP-Seq dataset in any genomic region using the Bamliquidator (version 1.0) read density calculator (https://github.com/BradnerLab/pipeline/wiki/bamliquidator). Briefly, ChIP-Seq reads aligning to the region were extended by 200bp and the density of reads per base pair (bp) was calculated. For ChIP-seq, the density of reads in each region was normalized to the total number of million mapped reads producing read density in units of reads per million mapped reads per bp (rpm/bp). For ChIP-Rx (as described below), the density of reads in each region was normalized to the total number of reads originating from the reference exogenous genome (reference adjusted reads per million, rrpm) producing units of rrpm per base pair (rrpm/bp).
Identifying enriched regions
We used the MACS version 1.4.1 (Model based analysis of ChIP-Seq) 67 peak finding algorithm to identify regions of ChIP-Seq enrichment over background (Zhang et al., 2008). A p value threshold of enrichment of 1e-9 was used for all datasets.
Mapping typical enhancers and super-enhancers using H3K27ac enhancer definitions
H3K27ac super-enhancers (SEs) and typical enhancers (TEs) were mapped using the ROSE2 software package described in Brown et al. (2014) and available at https://github.com/BradnerLab/pipeline/ (ROSE2_main.py). Default parameters, including exclusion of TSS-proximal signal (within 2.5 kb), were used and a stitching parameter was determined that consolidated proximal peaks while optimizing the enriched fraction of stitched peaks (as per default settings of ROSE2 software package).
Creating heatmap and meta representations of ChIP-Seq occupancy
Heatmaps and meta plots of ChIP-Seq occupancy for various factors were created as in Lin et al. (2012) for active promoters and enhancers as defined above. Each row plots the ± 5 kb region flanking the TSS (for promoters) or the enhancer center and is divided into 200 bins of 50 bp each. For ranked heatmaps, rows are ordered in all samples by the descending rank order of BRD4 average occupancy in the control treated sample. Underlying metas represent the average signal for all rows in each bin.
Scaling cell count normalized ChIP-Rx datasets
Scale factors (million mapped reads of reference exogenous genome) for each ChIP-Rx dataset were calculated as in Orlando et al. (2014) with the exception that mouse genomic reads were calculated instead of Drosophila genomic reads. Briefly, ChIP-Rx datasets, which were produced from equal cell number inputs, were scaled by scale factors to create y axis arbitrary units (reference-adjusted reads per million, rrpm) to normalize difference in occupancy per cell.
Creating meta-gene representations of ChIP-Seq occupancy
Meta-gene representations of relevant factor density were determined by first binning gene sets into three regions: i) the upstream promoter - from 3kb upstream of the TSS to the TSS (60 bins of 50 bp each), ii) the gene body - from the TSS to the gene end (200 bins), iii) the transcription termination region (TTR) - from the gene end to +3kb downstream (60 binds of 50bp each). Average ChIP-Seq density in each bin was calculated and plotted, combining the three regions the same plot.
Traveling ratio analysis of RNA Pol II
For traveling ratio analysis of total RNA Pol II ChIP-Rx, the ratio of Pol II signal in the promoter (+/− 300 bp of TSS) compared to the gene body (region extending from 300 bp downstream of the TSS to 3 kb downstream of the gene end) was calculated and the empirical cumulative distribution function was plotted for each sample.
Defining enhancer core regulatory transcription factor circuitry
T-ALL core regulatory circuitry analysis was performed as described previously in Lin et al. (2016) using BRD4 mapping of MOLT4-specific super-enhancer regions.
Native elongating transcript sequencing (NET-seq)
dBET6 and JQ1 treatments for NET-seq analysis
MOLT-4 cells were grown in RPMI Medium 1640 containing 10% FBS, 100 U/ml penicillin and 100 µg/ml streptomycin. 1.5 × 10⁷ cells were treated with 100 nM dBET6 or 1 µM JQ1 for 2 hr. dBET6 and JQ1 are solubilized in DMSO. To assess potential effects of DMSO on gene transcription, DMSO only treated cells were processed as a control in parallel. Following the treatments, 1.5 × 10⁷ cells were applied to cell fractionation as described below.
Cell fractionation, RNA preparation and sequencing library construction for NET-seq
The cell fractionation was performed as described previously with modifications (Mayer et al., 2015). 1.5 × 10⁷ MOLT-4 cells are washed with 500 µl of pre-cooled 1x PBS, resuspended in 150 µl Cytoplasmic lysis buffer (0.15% (v/v) NP-40, 10 mM Tris-HCl (pH 7.0), 150 mM NaCl, 25 µM α-amanitin (Sigma), 50 U SUPERase.In (Life Technologies), 1x Protease inhibitor mix (cOmplete, Roche)) and incubated on ice for 5 min. The cell lysate is layered over 400 µl of Sucrose buffer (10 mM Tris-HCl (pH 7.0), 150 mM NaCl, 25% (w/v) sucrose, 25 µM α-amanitin, 50 U SUPERase.In, 1x Protease inhibitor mix) and centrifuged at 16,000 g for 10 min at 4°C. The nuclei pellet is resuspended in 500 µl Nuclei wash buffer (0.1% (v/v) Triton X-100, 1 mM EDTA, in 1x PBS, 25 µM α-amanitin, 50 U SUPERase.In, 1x Protease inhibitor mix) and centrifuged at 1,150 g for 1 min at 4°C. Washed nuclei are resuspended in 200 µl Glycerol buffer (20 mM Tris-HCl (pH 8.0), 75 mM NaCl, 0.5 mM EDTA, 50% (v/v) glycerol, 0.85 mM DTT, 25 µM α-amanitin, 50 U SUPERase.In, 1x Protease inhibitor mix). Next, 200 µl of Nuclei lysis buffer (1% (v/v) NP-40, 20 mM HEPES pH 7.5, 300 mM NaCl, 1M Urea, 0.2 mM EDTA, 1 mM DTT, 25 µM α-amanitin, 50 U SUPERase.In, 1x Protease inhibitor mix) are added, mixed by pulsed vortexing and incubated on ice for 2 min. The lysate is centrifuged at 18,500 g for 2 min at 4°C. The chromatin pellet is resuspended in 50 µl Chromatin resuspension solution (25 µM α-amanitin, 50 Units SUPERase.In, 1x Protease inhibitor mix in 1x PBS) before RNA preparation. RNA preparation and NET-seq library construction was conducted as originally described (Mayer et al., 2015).
Processing and alignment of NET-seq reads
NET-seq data was processed and the sequencing reads were aligned to the human reference genome as described in detail before (Mayer et al., 2015; Rahl et al., 2010) and found at: https://github.com/BradnerLab/netseq. Briefly, the six 5′ end nucleotides of the sequencing reads that correspond to the random molecular barcode are removed using a custom python script. The sequencing reads are aligned to the human reference genome (hg19) using the STAR aligner and reads that arise from mispriming events during the reverse transcription step of the NET-seq library preparation are removed (Dobin et al., 2013). Next, the 5′ end of the sequencing read that corresponds to the 3′ end of the original nascent RNA is recorded with a custom python script applying the HTSeq package (Anders et al., 2015). Finally, sequencing reads due to PCR duplication and splicing intermediates are removed.
Pol II traveling ratio calculations
Calculating the traveling ratio of RNA Pol II from NET-seq data was performed as described previously with modifications (Mayer et al., 2015). The Pol II traveling ratio is determined by dividing the RPKM (reads per kb per million uniquely aligned reads) in the region −80 to +250 bp around transcription start sites by the RPKM in the region +250 bp to the polyadenylation site. The analysis was performed for non-overlapping and well-expressed Pol II transcribed protein-coding genes. Well-expressed Pol II transcribed genes are defined as genes with > 10 reads in the region −500 to +2500 bp around transcription start sites.
Chemical synthetic procedures
2-(2,6-dioxopiperidin-3-yl)-4-hydroxyisoindoline-1,3-dione
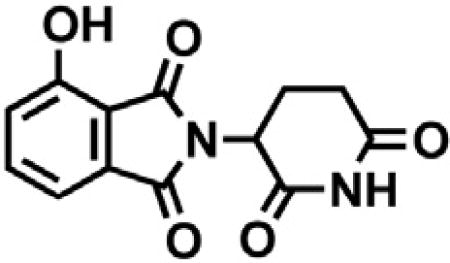
3-Hydroxyphthalic anhydride (1.641 g, 10 mmol, 1 eq) and 3-aminopiperidine-2,6-dione hydrochloride (1.646 g, 10 mmol, 1 eq) were dissolved in pyridine (40 mL, 0.25 M) and heated to 110°C. After 14 hr, the mixture was cooled to room temperature and concentrated under reduced pressure. Purification by column chromatography (ISCO, 24 g silica column, 0%–10% MeOH/DCM) gave the desired product as a tan solid (2.424 g, 8.84 mmol, 88%). 1H NMR (400 MHz, DMSO-d6) δ 11.08 (s, 2H), 7.65 (dd, J = 8.4, 7.2 Hz, 1H), 7.36 – 7.28 (m, 1H), 7.25 (dd, J = 8.4, 0.6 Hz, 1H), 5.07 (dd, J = 12.8, 5.4 Hz, 1H), 2.88 (ddd, J = 17.3, 14.0, 5.4 Hz, 1H), 2.63 – 2.50 (m, 2H), 2.08 – 1.95 (m, 1H).
tert-butyl 2-((2-(2,6-dioxopiperidin-3-yl)-1,3-dioxoisoindolin-4-yl)oxy)acetate
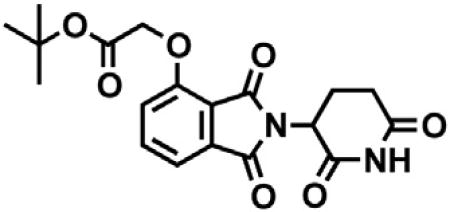
2-(2,6-dioxopiperidin-3-yl)-4-hydroxyisoindoline-1,3-dione (1.568 g, 5.71 mmol, 1 eq) was dissolved in DMF (57 mL, 0.1 M) at room temperature. Potassium carbonate (1.19 g, 8.58 mmol, 1.5 eq) and tert-butyl bromoacetate (0.843 mL, 5.71 mmol, 1 eq) were then added. After 2 hr, the mixture was diluted with EtOAc and washed once with water then twice with brine. The organic layer was dried over sodium sulfate, filtered and concentrated under reduced pressure. Purification by column chromatography (ISCO, 24 g silica column, 0%–100%EtOAc/hexanes, 21 min gradient) gave the desired product as a cream colored solid (2.06 g, 5.30 mmol, 93%). 1H NMR (500 MHz, Chloroform-d) δ 7.94 (s, 1H), 7.67 (dd, J = 8.4, 7.3 Hz, 1H), 7.52 (d, J = 6.8 Hz, 1H), 7.11 (d, J = 8.3 Hz, 1H), 4.97 (dd, J = 12.3, 5.3 Hz, 1H), 4.79 (s, 2H), 2.95 – 2.89 (m, 1H), 2.85 – 2.71 (m, 2H), 2.14 (dtd, J = 10.2, 5.0, 2.7 Hz, 1H), 1.48 (s, 9H). LCMS 389.33 (M+H).
2-((2-(2,6-dioxopiperidin-3-yl)-1,3-dioxoisoindolin-4-yl)oxy)acetic acid
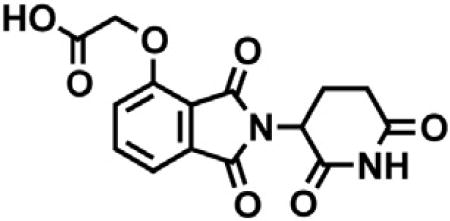
tert-butyl 2-((2-(2,6-dioxopiperidin-3-yl)-1,3-dioxoisoindolin-4-yl)oxy)acetate (2.06 g, 5.30 mmol, 1 eq) was dissolved in TFA (53 mL, 0.1M) at room temperature. After 4 hr, the solution was diluted with DCM and concentrated under reduced pressure. The resultant cream colored solid (1.484 g, 4.47 mmol, 84%) was deemed sufficiently pure and carried onto the next step without further purification. 1H NMR (500 MHz, DMSO-d6) δ 11.11 (s, 1H), 7.79 (dd, J = 8.4, 7.4 Hz, 1H), 7.48 (d, J = 7.2 Hz, 1H), 7.39 (d, J = 8.6 Hz, 1H), 5.10 (dd, J = 12.8, 5.4 Hz, 1H), 4.99 (s, 2H), 2.93 – 2.89 (m, 1H), 2.63 – 2.51 (m, 2H), 2.04 (ddd, J = 10.5, 5.4, 3.1 Hz, 1H). LCMS 333.25 (M+H).
tert-butyl (8-(2-((2-(2,6-dioxopiperidin-3-yl)-1,3-dioxoisoindolin-4-yl)oxy)acetamido)octyl)carbamate
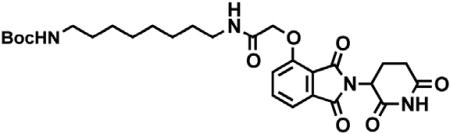
Boc-1,8-diaminooctane (2.10 g, 8.59 mmol, 1.1 eq) was dissolved in DMF (86 mL). In a separate flask, 2-((2-(2,6-dioxopiperidin-3-yl)-1,3-dioxoisoindolin-4-yl)oxy)acetic acid (2.60 g, 7.81 mmol, 1 eq) was dissolved in DMF (78 mL). The solution of Boc-1,8-diaminooctane in DMF was then added, followed by DIPEA (4.08 mL, 23.4 mmol. 3 eq) and HATU (2.97 g, 7.81 mmol, 1 eq). The mixture was stirred for 19 hr at room temperature, then diluted with EtOAc (600 mL). The organic layer was washed sequentially with 200 mL of half saturated sodium chloride, 200 mL 10% citric acid (aq.), 200 mL of half saturated sodium chloride, 200 mL of saturated sodium bicarbonate (aq.), 200 mL water and twice with 200 mL brine. The organic layer was dried over sodium sulfate, filtered and concentrated under reduced pressure. Purification by column chromatography (ISCO, 40 g column, 0%–5% MeOH/DCM, 35 min gradient) gave the desired product as a white solid (3.53 g, 6.32 mmol, 81%). 1H NMR (500 MHz, Chloroform-d) δ 8.49 (s, 1H), 7.74 (dd, J = 8.3, 7.4 Hz, 1H), 7.55 (d, J = 7.2 Hz, 1H), 7.39 (t, J = 5.3 Hz, 1H), 7.19 (d, J = 8.4 Hz, 1H), 4.97 (dd, J = 12.4, 5.3 Hz, 1H), 4.63 (d, J = 2.2 Hz, 2H), 4.59 (d, J = 10.0 Hz, 1H), 3.36 (q, J = 6.9 Hz, 2H), 3.12 – 3.03 (m, 2H), 2.95 – 2.72 (m, 3H), 2.16 (ddt, J = 10.3, 5.2, 2.7 Hz, 1H), 1.59 (p, J = 7.1 Hz, 2H), 1.37 (d, J = 67.6 Hz, 19H). LCMS 559.47 (M+H).
N-(8-aminooctyl)-2-((2-(2,6-dioxopiperidin-3-yl)-1,3-dioxoisoindolin-4-yl)oxy)acetamide trifluoroacetate
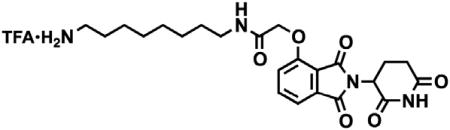
tert-butyl (8-(2-((2-(2,6-dioxopiperidin-3-yl)-1,3-dioxoisoindolin-4-yl)oxy)acetamido)octyl)carbamate (3.53 g, 6.32 mmol, 1 eq) was dissolved in TFA (63 mL, 0.1M) and heated to 50°C. After 1 hr, the mixture was cooled to room temperature, diluted with MeOH and concentrated under reduced pressure. The crude material was triturated with diethyl ether and dried under vacuum to give a white solid (2.93 g, 5.12 mmol, 81%). 1H NMR (500 MHz, Methanol-d4) δ 7.82 (dd, J = 8.4, 7.4 Hz, 1H), 7.55 (d, J = 7.2 Hz, 1H), 7.44 (d, J = 8.4 Hz, 1H), 5.14 (dd, J = 12.5, 5.5 Hz, 1H), 4.76 (s, 2H), 3.33 (dd, J = 6.8, 1.8 Hz, 1H), 3.30 (s, 1H), 2.94 – 2.85 (m, 3H), 2.80 – 2.69 (m, 2H), 2.19 – 2.11 (m, 1H), 1.60 (dq, J = 24.8, 7.0 Hz, 4H), 1.37 (s, 8H). LCMS 459.45 (M+H).
dBET6
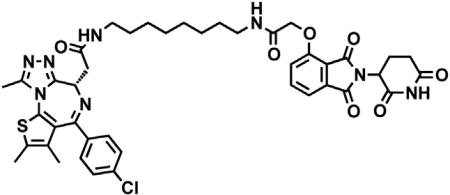
(S)-2-(4-(4-chlorophenyl)-2,3,9-trimethyl-6H-thieno[3,2-f][1,2,4]triazolo[4,3-a][1,4]diazepin-6-yl)acetic acid (JQ-acid) (0.894 g, 2.23 mmol, 1 eq) and N-(8-aminooctyl)-2-((2-(2,6-dioxopiperidin-3-yl)-1,3-dioxoisoindolin-4-yl)oxy)acetamide trifluoroacetate (1.277 g) were dissolved in DMF (22.3 mL, 0.1M) at room temperature. DIPEA (1.17 mL, 6.69 mmol, 3 eq) was added, followed by HATU (0.848 g, 2.23 mmol, 1 eq). The mixture was stirred for 23 hr, and then diluted with EtOAc. The organic layer was washed with saturated sodium bicarbonate, water and three times with brine. The organic layer was then dried under sodium sulfate, filtered and concentrated under reduced pressure. Purification by column chromatography (ISCO, 40 g column, 4%–10% MeOH/DCM, 35 min gradient) gave dBET6 as a cream colored solid (1.573 g, 1.87 mmol, 84%). 1H NMR (500 MHz, Methanol-d4) δ 7.80 (dd, J = 8.3, 7.5 Hz, 1H), 7.53 (d, J = 7.3 Hz, 1H), 7.46 – 7.37 (m, 5H), 5.11 (ddd, J = 12.6, 8.2, 5.5 Hz, 1H), 4.75 (s, 2H), 4.63 (dd, J = 9.0, 5.2 Hz, 1H), 3.41 (ddd, J = 14.9, 9.0, 2.2 Hz, 1H), 3.30 – 3.14 (m, 5H), 2.86 (ddt, J = 19.8, 14.6, 5.2 Hz, 1H), 2.78 – 2.66 (m, 5H), 2.44 (s, 3H), 2.13 (ddq, J = 15.3, 7.7, 4.8, 3.8 Hz, 1H), 1.69 (s, 3H), 1.61 – 1.51 (m, 4H), 1.35 (s, 8H). 13C NMR (126 MHz, MeOD) δ 174.49, 172.65, 171.30, 169.80, 168.28, 167.74, 166.18, 157.03, 156.24, 152.18, 138.19, 138.08, 137.97, 134.92, 133.52, 133.23, 132.02, 131.99, 131.33, 129.76, 121.65, 119.30, 117.94, 69.36, 55.27, 50.57, 40.49, 40.13, 38.84, 32.19, 30.49, 30.34, 30.31, 30.22, 27.92, 27.82, 23.64, 14.42, 12.92, 11.60. LCMS 841.48 (M+H).
dBET1 and dBET1(R) were synthesized as previously described in Winter et al. (2015).
tert-butyl (2-(2-chloroacetamido)ethyl)carbamate

tert-butyl (2-aminoethyl)carbamate (0.40 mL, 2.5 mmol, 1 eq) was dissolved in THF (25 mL, 0.1 M) and DIPEA (0.44 mL, 2.5 mmol, 1 eq) at 0°C. Chloroacetyl chloride (0.21 mL, 2.75 mmol, 1.1 eq) was added and the mixture was allowed to warm to room temperature. After 22 hr, the mixture was diluted with EtOAc and washed with saturated sodium bicarbonate, water and brine. The organic layer was dried with sodium sulfate, filtered and concentrated under reduced pressure to give a white solid (0.66 g, quantitative yield) that carried forward to the next step without further purification. 1H NMR (400 MHz, Chloroform-d) δ 7.16 (s, 1H), 4.83 (s, 1H), 4.04 (s, 2H), 3.42 (q, J = 5.4 Hz, 2H), 3.32 (q, J = 5.6 Hz, 2H), 1.45 (s, 9H). LCMS 237.30 (M+H).
dimethyl 3-(2-((2-((tert-butoxycarbonyl)amino)ethyl)amino)-2-oxoethoxy)phthalate
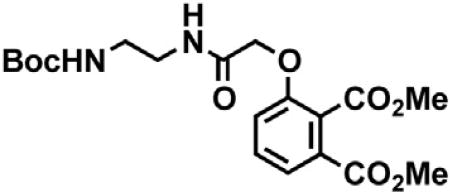
tert-butyl (2-(2-chloroacetamido)ethyl)carbamate (0.66 g, 1 eq) was dissolved in MeCN (17 mL, 0.15 M). Dimethyl 3-hydroxyphthalate (0.578 g, 2.75 mmol, 1.1 eq) and cesium carbonate (2.24 g, 6.88 mmol, 2.75 eq) were then added. The flask was fitted with a reflux condenser and heated to 80°C for 32 hr. The mixture was then cooled to room temperature, diluted with EtOAc and washed three times with water. The organic layer was dried over sodium sulfate, filtered and concentrated under reduced pressure. Purification by column chromatography (ISCO, 4g silica column, 0%–15% MeOH/DCM over a 15 min gradient) gave a yellow solid (0.394 g, 0.960 mmol, 38% over 2 steps). 1H NMR (400 MHz, Chloroform-d) δ 7.65 – 7.56 (m, 1H), 7.50 – 7.41 (m, 1H), 7.27 (s, 1H), 7.11 (dd, J = 8.4, 4.1 Hz, 2H), 5.17 (s, 1H), 4.57 (d, J = 6.3 Hz, 2H), 3.94 (s, 2H), 3.88 (s, 2H), 3.40 (p, J = 5.8 Hz, 4H), 3.32 – 3.19 (m, 4H), 1.39 (d, J = 5.7 Hz, 13H). LCMS 411.45 (M+H).
diaminoethyl-acetyl-O-thalidomide trifluoroacetate
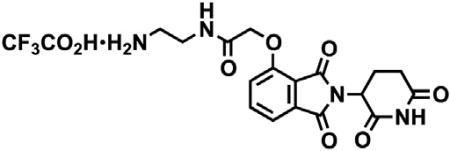
Dimethyl 3-(2-((2-((tert-butoxycarbonyl)amino)ethyl)amino)-2-oxoethoxy)phthalate (0.39 g, 0.970 mmol, 1 eq) was dissolved in EtOH (9.7 mL, 0.1 M). Aqueous 3M NaOH (0.97 mL, 2.91 mmol, 3 eq) was added and the mixture was heated to 80°C for 3 hr. The mixture was cooled to room temperature, diluted with 50 mL DCM, 5m L 1 M HCl and 20 mL water. The layers were separated and the organic layer was washed with 20 mL water. The combined aqueous layers were then extracted 3 times with 50 mL chloroform. The combined organic layers were dried over sodium sulfate, filtered and concentrated under reduced pressure to give a yellow solid (0.226 g) that was carried forward without further purification. LCMS 383.36.
The resultant yellow solid (0.226 g) and 3-aminopiperidine-2,6-dione hydrochloride (0.102 g, 0.6197 mmol, 1 eq) were dissolved in pyridine (6.2 mL, 0.1 M) and heated to 110°C for 16 hr. The mixture was cooled to room temperature and concentrated under reduced pressure to give tert-butyl (2-(2-((2-(2,6-dioxopiperidin-3-yl)-1,3-dioxoisoindolin-4-yl)oxy)acetamido)ethyl)carbamate as a poorly soluble black tar (0.663 g), which was carried forward without purification (due to poor solubility). LCMS 475.42 (M+H).
The crude tert-butyl (2-(2-((2-(2,6-dioxopiperidin-3-yl)-1,3-dioxoisoindolin-4-yl)oxy)acetamido)ethyl)carbamate was dissolved in TFA (10 mL) and heated to 50°C for 3.5 hr, then concentrated under reduced pressure. Purification by preparative HPLC gave a red oil (176.7 mg, 0.362 mmol, 37% over 3 steps). 1H NMR (400 MHz, Methanol-d4) δ 7.85 – 7.76 (m, 1H), 7.57 – 7.50 (m, 1H), 7.48 – 7.41 (m, 1H), 5.13 (dd, J = 12.6, 5.5 Hz, 1H), 4.81 (s, 2H), 3.62 (td, J = 5.6, 1.8 Hz, 2H), 3.14 (t, J = 5.8 Hz, 2H), 2.97 (s, 1H), 2.80 – 2.66 (m, 2H), 2.15 (dddd, J = 10.1, 8.0, 5.8, 2.8 Hz, 1H). LCMS 375.30 (M+H for free base).
Compound 1
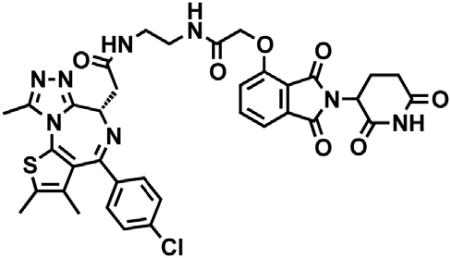
A 0.1 M solution of N-(2-aminoethyl)-2-((2-(2,6-dioxopiperidin-3-yl)-1,3-dioxoisoindolin-4-yl)oxy)acetamide trifluoroacetate in DMF (0.475 mL, 0.0475 mmol, 1.2 eq) was added to JQ-acid (15.86 mg, 0.0396 mmol, 1 eq) at room temperature. DIPEA (20.7 µl, 0.1188 mmol, 3 eq) and HATU (16.5 mg, 0.0435 mmol, 1.1 eq) were then added and the mixture was stirred for 24 hr, then purified by preparative HPLC to give a yellow solid (22.14 mg, 0.0292 mmol, 74%). 1H NMR (400 MHz, Methanol-d4) δ 7.82 – 7.75 (m, 1H), 7.52 – 7.32 (m, 6H), 5.04 (dd, J = 11.6, 5.5 Hz, 1H), 4.76 (d, J = 3.2 Hz, 2H), 4.66 (d, J = 6.6 Hz, 1H), 3.58 – 3.35 (m, 6H), 2.78 – 2.58 (m, 6H), 2.48 – 2.41 (m, 3H), 2.11 – 2.02 (m, 1H), 1.70 (d, J = 11.8 Hz, 3H). LCMS 757.41 (M+H).
tert-butyl (6-(2-chloroacetamido)hexyl)carbamate

tert-butyl (6-aminohexyl)carbamate (0.224 mL, 1.0 mmol, 1 eq) was dissolved in THF (10 mL, 0.1 M). DIPEA (0.17 mL, 1.0 mmol, 1 eq) was added and the mixture was cooled to 0°C. Chloroacetyl chloride (88 µl, 1.1 mmol, 1.1 eq) was added and the mixture was warmed to room temperature and stirred for 18 hr. The mixture was then diluted with EtOAc and washed with saturated sodium bicarbonate, water and brine. The organic layer was dried over sodium sulfate, filtered and concentrated under reduced pressure to give a white solid (0.2691 g, 0.919 mmol, 92%). 1H NMR (400 MHz, Chloroform-d) δ 6.60 (s, 1H), 4.51 (s, 1H), 4.05 (s, 2H), 3.30 (q, J = 6.9 Hz, 2H), 3.11 (d, J = 6.7 Hz, 2H), 1.57 – 1.46 (m, 4H), 1.44 (s, 9H), 1.38 – 1.32 (m, 4H). LCMS 293.39 (M+H).
dimethyl 3-(2-((6-((tert-butoxycarbonyl)amino)hexyl)amino)-2-oxoethoxy)phthalate
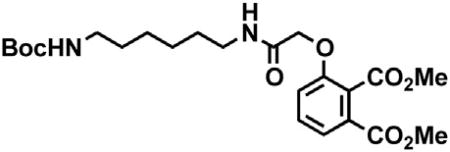
tert-butyl (6-(2-chloroacetamido)hexyl)carbamate (0.2691 g, 0.919 mmol, 1 eq) was dissolved in MeCN (9.2 mL, 0.1 M). Dimethyl 3-hydroxyphthalate (0.212 g, 1.01 mmol, 1.1 eq) and cesium carbonate (0.823 g, 2.53 mmol, 2.75 eq) were added. The flask was fitted with a reflux condenser and heated to 80°C for 14 hr. The mixture was cooled to room temperature and diluted with EtOAc, washed three times with water and back extracted once with EtOAc. The combined organic layers were dried over sodium sulfate, filtered and concentrated under reduced pressure. The crude material was purified by column chromatography (ISCO, 12 g silica column, 0%–15% MeOH/DCM 15 min gradient) to give a yellow oil (0.304 g, 0.651 mmol, 71%). 1H NMR (400 MHz, Chloroform-d) δ 7.66 – 7.58 (m, 1H), 7.44 (td, J = 8.2, 1.6 Hz, 1H), 7.15 – 7.08 (m, 1H), 6.96 (s, 1H), 4.56 (s, 2H), 3.92 (t, J = 1.6 Hz, 3H), 3.88 (t, J = 1.6 Hz, 3H), 3.27 (q, J = 6.9 Hz, 2H), 3.10 – 3.00 (m, 2H), 1.41 (s, 13H), 1.33 – 1.22 (m, 4H). LCMS 467.49.
diaminohexyl-acetyl-O-thalidomide trifluoroacetate
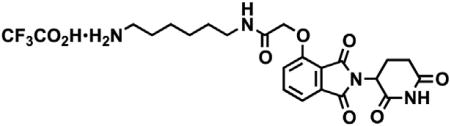
Dimethyl 3-(2-((6-((tert-butoxycarbonyl)amino)hexyl)amino)-2-oxoethoxy)phthalate (0.304 g, 0.651 mmol, 1 eq) was dissolved in EtOH (6.5 mL, 0.1 M). Aqueous 3M NaOH (0.65 mL, 1.953 mmol, 3 eq) was added and the mixture was heated to 80°C for 18 hr. The mixture was cooled to room temperature and diluted with 50 mL DCM and 10 mL 0.5 M HCl. The layers were separated and the organic layer was washed with 20 mL water. The combined aqueous layers were then extracted 3 times with chloroform. The combined organic layers were dried over sodium sulfate, filtered and concentrated under reduced pressure to give a yellow foam (0.290 g) that was carried forward without further purification. LCMS 439.47.
The resultant yellow solid (0.290 g) and 3-aminopiperidine-2,6-dione hydrochloride (0.113 g, 0.69 mmol, 1 eq) were dissolved in pyridine (6.9 mL, 0.1 M) and heated to 110°C for 17 hr. The mixture was cooled to room temperature and concentrated under reduced pressure to give tert-butyl (6-(2-((2-(2,6-dioxopiperidin-3-yl)-1,3-dioxoisoindolin-4-yl)oxy)acetamido)hexyl)carbamate as a black solid (0.4216 g), which was carried forward without purification (due to poor solubility). LCMS 531.41 (M+H).
The crude tert-butyl (6-(2-((2-(2,6-dioxopiperidin-3-yl)-1,3-dioxoisoindolin-4-yl)oxy)acetamido)hexyl)carbamate (0.4216 g) was dissolved in TFA (10 mL) and heated to 50°C for 2 hr. The mixture was concentrated under reduced pressure, then concentrated under reduced pressure. Purification by preparative HPLC gave a brown solid (379.2 mg). 1H NMR (400 MHz, Methanol-d4) δ 7.79 (dd, J = 8.4, 7.4 Hz, 1H), 7.52 (d, J = 7.2 Hz, 1H), 7.42 (d, J = 8.4 Hz, 1H), 5.13 (dd, J = 12.6, 5.5 Hz, 1H), 4.75 (s, 2H), 3.32 (t, J = 7.6 Hz, 2H), 2.96 – 2.89 (m, 2H), 2.89 – 2.65 (m, 3H), 2.16 (ddt, J = 10.4, 5.4, 2.9 Hz, 1H), 1.63 (dp, J = 20.6, 7.1 Hz, 4H), 1.51 – 1.34 (m, 4H). LCMS 431.37 (M+H).
dBET5
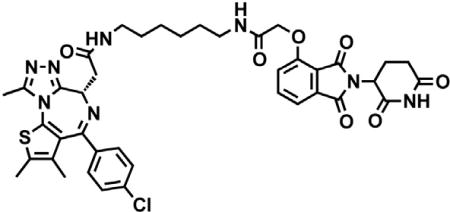
A 0.1 M solution of N-(6-aminohexyl)-2-((2-(2,6-dioxopiperidin-3-yl)-1,3-dioxoisoindolin-4-yl)oxy)acetamide trifluoroacetate in DMF (0.247 mL, 0.0247 mmol, 1 eq) was added to JQ-acid (9.9 mg, 0.0247 mmol, 1 eq) at room temperature. DIPEA (12.9 µl, 0.0741 mmol, 3 eq) and HATU (9.4 mg, 0.0247 mmol, 1 eq) were then added. The mixture was stirred for 21 hr, then diluted with MeOH and concentrated under reduced pressure. The crude material was purified by preparative HPLC to give a yellow solid (13.56 mg, 0.0167 mmol, 67%). 1H NMR (400 MHz, Methanol-d4) δ 7.82 – 7.78 (m, 1H), 7.53 (dd, J = 7.3, 2.0 Hz, 1H), 7.49 – 7.37 (m, 5H), 5.10 (dt, J = 12.4, 5.3 Hz, 1H), 4.76 (s, 2H), 4.70 (dd, J = 8.7, 5.5 Hz, 1H), 3.48 – 3.33 (m, 3H), 3.25 (dt, J = 12.3, 6.0 Hz, 3H), 2.87 – 2.79 (m, 1H), 2.77 – 2.68 (m, 5H), 2.48 – 2.42 (m, 3H), 2.14 – 2.09 (m, 1H), 1.69 (d, J = 4.8 Hz, 3H), 1.58 (s, 4H), 1.42 (d, J = 5.2 Hz, 4H). LCMS 813.38.
tert-butyl (1-chloro-2-oxo-7,10,13-trioxa-3-azahexadecan-16-yl)carbamate

tert-butyl (3-(2-(2-(3-aminopropoxy)ethoxy)ethoxy)propyl)carbamate (1.0 g, 3.12 mmol, 1 eq) was dissolved in THF (31 mL, 0.1 M). DIPEA (0.543 mL, 3.12 mmol, 1 eq) was added and the solution was cooled to 0°C. Chloroacetyl chloride (0.273 mL, 3.43 mmol, 1.1 eq) was added and the mixture was warmed slowly to room temperature. After 24 hr, the mixture was diluted with EtOAc and washed with saturated sodium bicarbonate, water then brine. The organic layer was dried over sodium sulfate, filtered and condensed to give a yellow oil (1.416 g) that was carried forward without further purification. 1H NMR (400 MHz, Chloroform-d) δ 7.24 (s, 1H), 5.00 (s, 1H), 3.98 – 3.89 (m, 2H), 3.54 (dddt, J = 17.0, 11.2, 5.9, 2.2 Hz, 10H), 3.47 – 3.40 (m, 2H), 3.37 – 3.31 (m, 2H), 3.17 – 3.07 (m, 2H), 1.79 – 1.70 (m, 2H), 1.67 (p, J = 6.1 Hz, 2H), 1.35 (s, 9H). LCMS 397.37 (M+H).
dimethyl 3-((2,2-dimethyl-4,20-dioxo-3,9,12,15-tetraoxa-5,19-diazahenicosan-21-yl)oxy)phthalatee
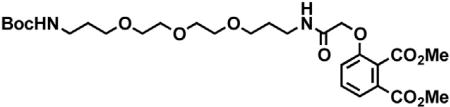
tert-butyl (1-chloro-2-oxo-7,10,13-trioxa-3-azahexadecan-16-yl)carbamate (1.41 g, 3.12 mmol, 1 eq) was dissolved in MeCN (32 mL, 0.1 M). Dimethyl 3-hydroxyphthalate (0.721 g, 3.43 mmol, 1.1 eq) and cesium carbonate (2.80 g, 8.58 mmol, 2.75 eq) were added. The flask was fitted with a reflux condenser and heated to 80°C for 19 hr. The mixture was cooled to room temperature and diluted water and extracted once with chloroform and twice with EtOAc. The combined organic layers were dried over sodium sulfate, filtered and concentrated under reduced pressure. The crude material was purified by column chromatography (ISCO, 24 g silica column, 0%–15% MeOH/DCM 22 min gradient) to give a yellow oil (1.5892 g, 2.78 mmol, 89% over two steps). 1H NMR (400 MHz, Chloroform-d) δ 7.52 (d, J = 7.8 Hz, 1H), 7.35 (t, J = 8.1 Hz, 1H), 7.04 (d, J = 8.3 Hz, 1H), 7.00 (t, J = 5.3 Hz, 1H), 5.06 (s, 1H), 4.46 (s, 2H), 3.83 (s, 3H), 3.78 (s, 3H), 3.47 (ddd, J = 14.9, 5.5, 2.8 Hz, 8H), 3.39 (dt, J = 9.4, 6.0 Hz, 4H), 3.29 (q, J = 6.5 Hz, 2H), 3.09 (d, J = 6.0 Hz, 2H), 1.70 (p, J = 6.5 Hz, 2H), 1.63 (p, J = 6.3 Hz, 2H), 1.31 (s, 9H). LCMS 571.47 (M+H).
N-(3-(2-(2-(3-aminopropoxy)ethoxy)ethoxy)propyl)-2-((2-(2,6-dioxopiperidin-3-yl)-1,3-dioxoisoindolin-4-yl)oxy) acetamide trifluoroacetate
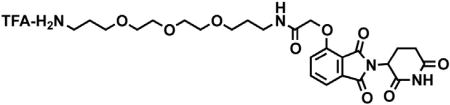
Dimethyl 3-((2,2-dimethyl-4,20-dioxo-3,9,12,15-tetraoxa-5,19-diazahenicosan-21-yl)oxy)phthalate (1.589 g, 2.78 mmol, 1 eq) was dissolved in EtOH (14 mL, 0.2 M). Aqueous 3M NaOH (2.8 mL, 8.34 mmol, 3 eq) was added and the mixture was heated to 80°C for 22 hr. The mixture was then cooled to room temperature, diluted with 50 mL DCM and 20 mL 0.5 M HCl. The layers were separated and the organic layer was washed with 25 mL water. The aqueous layers were combined and extracted three times with 50 mL chloroform. The combined organic layers were dried over sodium sulfate, filtered and condensed to give 1.53 g of material that was carried forward without further purification. LCMS 553.44.
The resultant material (1.53 g) and 3-aminopiperidine-2,6-dione hydrochloride (0.480 g, 2.92 mmol, 1 eq) were dissolved in pyridine (11.7 mL, 0.25 M) and heated to 110°C for 17 hr. The mixture was cooled to room temperature and concentrated under reduced pressure to give crude tert-butyl (1-((2-(2,6-dioxopiperidin-3-yl)-1,3-dioxoisoindolin-4-yl)oxy)-2-oxo-7,10,13-trioxa-3-azahexadecan-16-yl)carbamate as a black sludge (3.1491 g) that was carried forward without further purification. LCMS 635.47.
The crude tert-butyl (1-((2-(2,6-dioxopiperidin-3-yl)-1,3-dioxoisoindolin-4-yl)oxy)-2-oxo-7,10,13-trioxa-3-azahexadecan-16-yl) carbamate (3.15 g) was dissolved in TFA (20 mL) and heated to 50°C for 2.5 hr. The mixture was cooled to room temperature, diluted with MeOH and concentrated under reduced pressure. The material was purified by preparative HPLC to give N-(3-(2-(2-(3-aminopropoxy) ethoxy)ethoxy)propyl)-2-((2-(2,6-dioxopiperidin-3-yl)-1,3-dioxoisoindolin-4-yl)oxy)acetamide trifluoroacetate (1.2438 g, 1.9598 mmol, 71% over 3 steps) as a dark red oil. 1H NMR (400 MHz, Methanol-d4) δ 7.77 (dd, J = 8.3, 7.5 Hz, 1H), 7.49 (d, J = 7.3 Hz, 1H), 7.40 (d, J = 8.5 Hz, 1H), 5.12 (dd, J = 12.8, 5.5 Hz, 1H), 4.75 (s, 2H), 3.68 – 3.51 (m, 12H), 3.40 (t, J = 6.8 Hz, 2H), 3.10 (t, J= 6.4 Hz, 2H), 2.94 – 2.68 (m, 3H), 2.16 (dtd, J = 12.6, 5.4, 2.5 Hz, 1H), 1.92 (p, J = 6.1 Hz, 2H), 1.86 – 1.77 (m, 2H).LCMS536.41 (M+H).
Compound 2
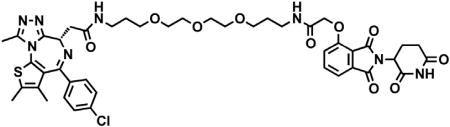
A 0.1 M solution of N-(3-(2-(2-(3-aminopropoxy)ethoxy)ethoxy)propyl)-2-((2-(2,6-dioxopiperidin-3-yl)-1,3-dioxoisoindolin-4-yl)oxy) acetamide trifluoroacetate in DMF (0.321 mL, 0.0321 mmol, 1 eq) was added to JQ-acid (12.87 mg, 0.0321 mmol, 1 eq) at room temperature. DIPEA (16.8 µl, 0.0963 mmol, 3 eq) and HATU (12.2 mg, 0.0321 mmol, 1 eq) were added and the mixture was stirred for 24 hr, diluted with MeOH, and concentrated under reduced pressure. The crude material was purified by preparative HPLC to give a yellow oil. (16.11 mg, 0.0176 mmol, 55%). 1H NMR (400 MHz, Methanol-d4) δ 7.79 (dd, J = 8.4, 7.4 Hz, 1H), 7.52 (d, J = 7.2 Hz, 1H), 7.49 – 7.36 (m, 5H), 5.10 (dd, J = 12.5, 5.5 Hz, 1H), 4.78 – 4.67 (m, 3H), 3.66 – 3.50 (m, 12H), 3.48 – 3.32 (m, 6H), 2.91 – 2.81 (m, 1H), 2.78 – 2.64 (m, 5H), 2.52 – 2.43 (m, 3H), 2.18 – 2.08 (m, 1H), 1.81 (p, J = 6.3 Hz, 4H), 1.73 – 1.67 (m, 3H). LCMS 918.45 (M+H).
tert-butyl (2-(2-(2-(2-((2-(2,6-dioxopiperidin-3-yl)-1,3-dioxoisoindolin-4-yl)oxy)acetamido)ethoxy)ethoxy)ethyl) carbamate
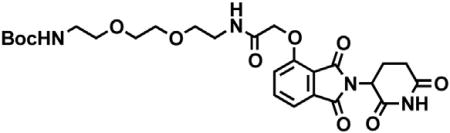
2-((2-(2,6-dioxopiperidin-3-yl)-1,3-dioxoisoindolin-4-yl)oxy)acetic acid (200 mg, 0.602 mmol, 1 eq) was dissolved in DMF (6.0 mL, 0.1M). HATU (228.9 mg, 0.602 mmol, 1 eq), DIPEA (0.315 mL, 1.81 mmol, 3 eq) and N-Boc-2,20-(ethylenedioxy)diethylamine (0.143 mL, 0.602 mmol, 1 eq) were added sequentially. After 6 hr, additional HATU (114 mg, 0.30 mmol, 0.5 eq) were added to ensure completeness of reaction. After an additional 24 hr, the mixture was diluted with EtOAc, and washed with saturated sodium bicarbonate, water and twice with brine. The combined organic layer was dried over sodium sulfate, filtered and concentrated under reduced pressure. Purification by column chromatography (ISCO, 12 g silica column, 0%–15% MeOH/DCM, 15 min gradient) gave the desired product as a yellow oil (0.25 g, 0.44 mmol, 74%). 1H NMR (400 MHz, Methanol-d4) δ 7.82 – 7.75 (m, 1H), 7.51 (d, J = 7.4 Hz, 1H), 7.41 (d, J = 8.5 Hz, 1H), 5.13 (dd, J = 12.4, 5.5 Hz, 1H), 4.76 (s, 2H), 3.66 – 3.58 (m, 6H), 3.53 – 3.45 (m, 4H), 3.19 (t, J = 5.6 Hz, 2H), 2.95 – 2.83 (m, 1H), 2.80 – 2.67 (m, 2H), 2.19 – 2.12 (m, 1H), 1.41 (s, 9H). LCMS 563.34 (M+H).
N-(2-(2-(2-aminoethoxy)ethoxy)ethyl)-2-((2-(2,6-dioxopiperidin-3-yl)-1,3-dioxoisoindolin-4-yl)oxy)acetamide trifluoroacetate
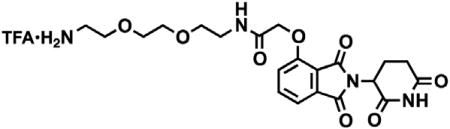
tert-butyl (2-(2-(2-(2-((2-(2,6-dioxopiperidin-3-yl)-1,3-dioxoisoindolin-4-yl)oxy)acetamido)ethoxy)ethoxy)ethyl)carbamate (0.25 g, 0.44 mmol, 1 eq) was dissolved in TFA (4.5 mL) and heated to 50°C. After 3 hr, the mixture was cooled to room temperature, diluted with MeOH, and concentrated under reduced pressure. Purification by preparative HPLC gave the desired product as a tan solid (0.197 g, 0.342 mmol, 77%). 1H NMR (400 MHz, Methanol-d4) δ 7.81 (ddd, J = 8.4, 7.4, 1.1 Hz, 1H), 7.55 – 7.50 (m, 1H), 7.43 (d, J = 8.5 Hz, 1H), 5.13 (dd, J = 12.7, 5.5 Hz, 1H), 4.78 (s, 2H), 3.74 – 3.66 (m, 6H), 3.64 (t, J = 5.4 Hz, 2H), 3.52 (t, J = 5.3 Hz, 2H), 3.14 – 3.08 (m, 2H), 2.89 (ddd, J = 17.5, 13.9, 5.2 Hz, 1H), 2.80 – 2.66 (m, 2H), 2.16 (dtd, J = 13.0, 5.7, 2.7 Hz, 1H). LCMS 463.36 (M+H).
Compound 3
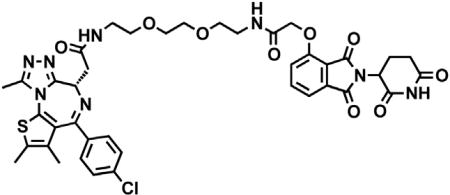
A 0.1 M solution of N-(2-(2-(2-aminoethoxy)ethoxy)ethyl)-2-((2-(2,6-dioxopiperidin-3-yl)-1,3-dioxoisoindolin-4-yl)oxy)acetamide trifluoroacetate in DMF (0.324 mL, 0.0324 mmol, 1 eq) was added to JQ-acid (13.0 mg, 0.324 mmol, 1 eq). DIPEA 16.9 µl, 0.0972 mmol, 3 eq) and HATU (12.3 mg, 0.0324 mmol, 1 eq) were then added and the mixture was stirred for 18 hr at room temperature. The mixture was then diluted with EtOAc and washed with saturated sodium bicarbonate, water and brine. The organic layer was then dried over sodium sulfate, filtered and concentrated under reduced pressure. Purification by column chromatography (ISCO, 4 g silica column, 0%–10% MeOH/DCM, 25 min gradient) gave the desired product as an off-white solid (20.0 mg, 0.0236 mmol, 73%). 1H NMR (400 MHz, Methanol-d4) δ 7.77 – 7.72 (m, 1H), 7.49 (d, J = 7.4 Hz, 1H), 7.45 – 7.35 (m, 5H), 5.09 (ddd, J = 12.3, 5.4, 3.7 Hz, 1H), 4.76 (s, 2H), 4.60 (dd, J = 8.9, 5.3 Hz, 1H), 3.68 – 3.62 (m, 6H), 3.59 (t, J = 5.6 Hz, 2H), 3.54 – 3.48 (m, 2H), 3.47 – 3.35 (m, 4H), 2.84 (ddd, J = 19.4, 9.9, 4.6 Hz, 1H), 2.77 – 2.69 (m, 2H), 2.68 (d, J = 1.8 Hz, 3H), 2.43 (s, 3H), 2.12 (dt, J = 9.8, 5.3 Hz, 1H), 1.68 (s, 3H). LCMS 845.39 (M+H).
tert-butyl (3-(3-(2-((2-(2,6-dioxopiperidin-3-yl)-1,3-dioxoisoindolin-4-yl)oxy)acetamido)propoxy)propyl)carbamate
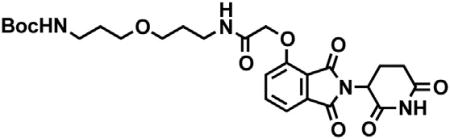
tert-butyl (3-(3-aminopropoxy)propyl)carbamate (134.5 mg, 0.579 mmol, 1 eq) was dissolved in DMF (5.79 ml, 0.05 M) then added to 2-((2-(2,6-dioxopiperidin-3-yl)-1,3-dioxoisoindolin-4-yl)oxy)acetic acid (192.38 mg, 0.579 mmol, 1 eq). DIPEA (0.28 ml, 1.74 mmol, 3 eq) and HATU (153.61 mg, 0.579 mmol, 1 eq) were added and the mixture was stirred for 18 hr at room temperature. The mixture was then diluted with EtOAc and washed with saturated sodium bicarbonate, water then brine. The organic layer was dried over sodium sulfate, filtered and condensed to give a yellow oil (157.1 mg). The crude material was purified by column chromatography (ISCO, 12 g silica column, 0 to 15% MeOH/DCM 25 min gradient) to give a yellow oil (121.3 mg, 0.222 mmol, 38.27%). 1H NMR (400 MHz, Methanol-d4) δ 7.78 (dd, J = 8.4, 7.4 Hz, 1H), 7.50 (d, J = 7.3 Hz, 1H), 7.41 (d, J = 8.5 Hz, 1H), 5.13 (dd, J = 12.4, 5.5 Hz, 1H), 4.75 (s, 2H), 3.53 – 3.37 (m, 6H), 3.14 – 3.07 (m, 2H), 2.94 – 2.88 (m, 1H), 2.79 – 2.68 (m, 2H), 2.16 (ddd, J = 12.8, 6.6, 2.7 Hz, 1H), 1.81 (p, J = 6.4 Hz, 2H), 1.73 – 1.65 (m, 2H), 1.40 (s, 9H). LCMS 547.6 (M+H).
N-(3-(3-aminopropoxy)propyl)-2-((2-(2,6-dioxopuperidin-3-yl)-1,3-dioxoisoindolin-4-yl)oxy)acetamide trifluoroacetate salt
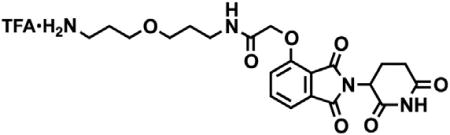
TFA (2.22ml, 0.1 M) was added to tert-butyl (3-(3-(2-((2-(2,6-dioxopiperidin-3-yl)-1,3-dioxoisoindolin-4-yl)oxy)acetamido)propoxy) propyl)carbamate (121.3 mg, 0.222 mmol, 1 eq) and the mixture was stirred at 50°C for 2 hr. The mixture was then dissolved in MeOH and concentrated under reduced pressure to give a brown oil (114.1 mg) that was carried forward without further purification. 1H NMR (400 MHz, Methanol-d4) δ 7.81 – 7.74 (m, 1H), 7.50 (d, J = 7.3 Hz, 1H), 7.41 (d, J = 8.5 Hz, 1H), 5.12 (dd, J = 12.7, 5.5 Hz, 1H), 4.76 (s, 2H), 3.57 – 3.52 (m, 2H), 3.48 (t, J = 5.9 Hz, 2H), 3.40 (t, J = 6.6 Hz, 2H), 3.06 (t, J = 6.5 Hz, 2H), 2.87 (ddd, J = 14.1, 10.1, 7.0 Hz, 1H), 2.79 – 2.65 (m, 2H), 2.15 (dtd, J = 12.8, 5.5, 2.6 Hz, 1H), 1.92 (dt, J = 11.7, 5.9 Hz, 2H), 1.81 (p, J = 6.3 Hz, 2H). LCMS 447.2 (M+H).
Compound 4
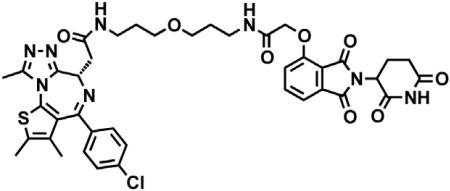
A 0.1 M solution of N-(3-(3-aminopropoxy)propyl)-2-((2-(2,6-dioxopiperidin-3-yl)-1,3-dioxoisoindolin-4-yl)oxy)acetamide trifluoroacetate in DMF (0.215 mL, 0.0215 mmol, 1 eq) was added to JQ-acid (8.6 mg, 0.0215 mmol, 1 eq) at room temperature. DIPEA (11.2 µl, 0.0644 mmol, 3 eq) and HATU (8.2 mg, 0.0215 mmol, 1 eq) were added. After 19 hr, the mixture was diluted with EtOAc and washed with saturated sodium bicarbonate, water and brine. The combined organic layer was dried over sodium sulfate, filtered and concentrated under reduced pressure. Purification by column chromatography (ISCO, 4 g silica column, 0%–15% MeOH/DCM, 25 min gradient) gave the desired product as a cream colored solid (10.6 mg, 0.0127 mmol, 59%). 1H NMR (500 MHz, Methanol-d4) δ 7.79 – 7.74 (m, 1H), 7.50 (d, J = 8.1 Hz, 1H), 7.46 – 7.36 (m, 5H), 5.11 (ddd, J = 12.4, 5.5, 1.7 Hz, 1H), 4.73 (s, 2H), 4.62 (ddd, J = 8.7, 5.4, 1.4 Hz, 1H), 3.50 (q, J = 6.3 Hz, 4H), 3.43 (t, J = 6.5 Hz, 2H), 3.41 – 3.32 (m, 3H), 3.29 – 3.24 (m, 1H), 2.85 (ddd, J = 18.3, 14.6, 4.2 Hz, 1H), 2.77 – 2.65 (m, 5H), 2.43 (s, 3H), 2.17 – 2.09 (m, 1H), 1.80 (h, J = 6.4 Hz, 4H), 1.68 (s, 3H). LCMS 829.32 (M+H).
tert-butyl (4-((2-((2-(2,6-dioxopiperidin-3-yl)-1,3-dioxoisoindolin-4-yl)oxy)acetamido)methyl)benzyl)carbamate
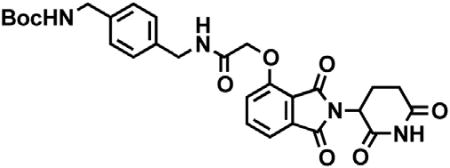
tert-butyl (4-(aminomethyl)benzyl)carbamate (183.14 mg, 0.755 mmol, 1 eq) was dissolved in DMF(15.1 ml, 0.05 M) and added to 2-((2-(2,6-dioxopiperidin-3-yl)-1,3-dioxoisoindolin-4-yl)oxy)acetic acid (250.90 mg, 0.755 mmol, 1 eq). DIPEA (0.374 ml, 2.265 mmol, 3 eq) and HATU (296.67 mg, 0.755 mmol, 1 eq) were added and the mixture was stirred for 20 hr at room temperature. The mixture was then diluted with EtOAc and washed with saturated sodium bicarbonate, water then brine. The organic layer was dried over sodium sulfate, filtered and condensed to give a light brown oil. The crude material was purified by column chromatography (ISCO, 12 g silica column, 0 to 15% MeOH/DCM 25 min gradient) to give a light brown oil (373.1 mg, 0.678 mmol, 89.8%). 1H NMR(500 MHz, DMSO-d6) δ 11.10 (s, 2H), 8.48 (t, J = 5.8 Hz, 1H), 7.80 (dd, J = 8.4, 7.3 Hz, 1H), 7.49 (d, J = 7.2 Hz, 1H), 7.40 (d, J = 8.6 Hz, 1H), 7.26 – 7.08 (m, 4H), 5.11 (dd, J = 12.9, 5.4 Hz, 1H), 4.86 (s, 2H), 4.33 (d, J = 3.9 Hz, 2H), 4.09 (d, J = 5.3 Hz, 2H), 2.65 – 2.51 (m, 3H), 2.07 – 1.99 (m, 1H), 1.38 (s, 9H). LCMS 551.5 (M+H).
N-(4-(aminomethyl)benzyl)-2-((2-(2,6-dioxopiperidin-3-yl)-1,3-dioxoisoindolin-4-yl)oxy)acetamide trifluoracetate salt
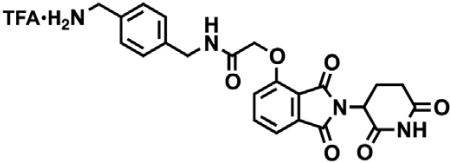
TFA (6.77 ml, 0.1 M) was added to tert-butyl (4-((2-((2-(2,6-dioxopiperidin-3-yl)-1,3-dioxoisoindolin-4-yl)oxy)acetamido)methyl) benzyl)carbamate (373.1 mg, 0.677 mmol, 1 eq) and the mixture was stirred at 50°C for 1.5 hr. The mixture was then dissolved in MeOH and concentrated under reduced pressure to give a brown oil (270.29 mg) that was carried forward without further purification. 1H NMR(500 MHz, DMSO-d6) δ 11.11 (s, 1H), 8.55 (t, J = 6.2 Hz, 1H), 8.07 (s, 3H), 7.81 (dd, J = 8.5, 7.3 Hz, 1H), 7.51 (d, J = 7.2 Hz, 1H), 7.40 (dd, J = 14.9, 8.3 Hz, 3H), 7.31 (d, J = 8.2 Hz, 2H), 5.11 (dd, J = 12.9, 5.4 Hz, 1H), 4.87 (s, 2H), 4.37 (d, J = 6.1 Hz, 2H), 4.01 (q, J = 5.8 Hz, 2H), 2.66 – 2.51 (m, 3H), 2.07 – 1.99 (m, 1H). LCMS 451.3 (M+H).
Compound 5
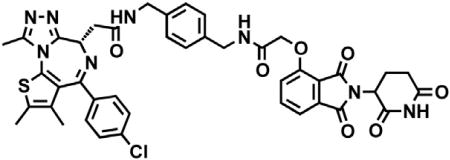
A 0.1 M solution of N-(4-(aminomethyl)benzyl)-2-((2-(2,6-dioxopiperidin-3-yl)-1,3-dioxoisoindolin-4-yl)oxy)acetamide trifluoroacetate in DMF (0.237 mL, 0.0237 mmol, 1 eq) was added to JQ-acid (9.5 mg, 0.0237 mmol, 1 eq) at room temperature. After 23 hr, the mixture was diluted with EtOAc and washed with saturated sodium bicarbonate, water and brine. The organic layer was dried over sodium sulfate, filtered and concentrated under reduced pressure. Purification by column chromatography (ISCO, 4 g silica column, 0%–10% MeOH/DCM, 25 min gradient) gave the desired product as a cream colored solid (11.8 mg, 0.0142 mmol, 60%). 1H NMR (500 MHz, Methanol-d4) δ 7.80 – 7.75 (m, 1H), 7.51 (dd, J = 7.3, 1.5 Hz, 1H), 7.41 (d, J = 8.4 Hz, 1H), 7.36 (d, J = 2.2 Hz, 4H), 7.34 – 7.28 (m, 4H), 5.10 – 5.00 (m, 1H), 4.82 (s, 2H), 4.67 – 4.64 (m, 1H), 4.61 – 4.42 (m, 4H), 4.34 (dd, J = 14.9, 12.8 Hz, 1H), 3.49 (ddd, J = 14.8, 9.5, 5.2 Hz, 1H), 2.83 – 2.75 (m, 1H), 2.73 – 2.61 (m, 5H), 2.44 – 2.39 (m, 3H), 2.06 (ddq, J = 9.8, 4.7, 2.6 Hz, 1H), 1.66 (d, J = 4.2 Hz, 3H). LCMS 832.92 (M+H).
(R)-ethyl 4-((8-cyclopentyl-7-ethyl-5-methyl-6-oxo-5,6,7,8-tetrahydropteridin-2-yl)amino)-3-methoxybenzoate
(R)-2-chloro-8-cyclopentyl-7-ethyl-5-methyl-7,8-dihydropteridin-6(5H)-one (44.2 mg, 0.15 mmol, 1 eq), ethyl 4-amino-3-methoxybenzoate (35.1 mg, 0.18 mmol, 1.2 eq), Pd2dba3 (6.9 mg, 0.0075 mmol, 5 mol %), XPhos (10.7 mg, 0.0225 mmol, 15 mol %) and potassium carbonate (82.9 mg, 0.60 mmol, 4 eq) were dissolved in tBuOH (1.5 mL, 0.1 M) and heated to 100°C. After 21 hr, the mixture was cooled to room temperature, filtered through celite, washed with DCM and concentrated under reduced pressure. Purification by column chromatography (ISCO, 4 g silica column, 0%–100% EtOAc/hexanes over an 18 min gradient) gave a yellow oil (52.3 mg, 0.115 mmol, 77%). 1H NMR (400 MHz, Chloroform-d) δ 8.57 (d, J = 8.5 Hz, 1H), 7.69 (td, J = 6.2, 2.9 Hz, 2H), 7.54 (d, J = 1.8 Hz, 1H), 4.52 (t, J = 7.9 Hz, 1H), 4.37 (q, J = 7.1 Hz, 2H), 4.23 (dd, J = 7.9, 3.7 Hz, 1H), 3.97 (s, 3H), 3.33 (s, 3H), 2.20 – 2.12 (m, 1H), 2.03 – 1.97 (m, 1H), 1.86 (ddd, J = 13.9, 7.6, 3.6 Hz, 4H), 1.78 – 1.65 (m, 4H), 1.40 (t, J = 7.1 Hz, 3H), 0.88 (t, J = 7.5 Hz, 3H). LCMS 454.32 (M+H).
(R)-4-((8-cyclopentyl-7-ethyl-5-methyl-6-oxo-5,6,7,8-tetrahydropteridin-2-yl)amino)-3-methoxybenzoic acid
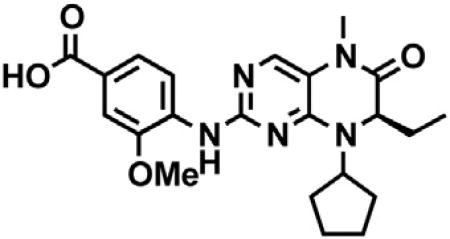
(R)-ethyl 4-((8-cyclopentyl-7-ethyl-5-methyl-6-oxo-5,6,7,8-tetrahydropteridin-2-yl)amino)-3-methoxybenzoate (73.8 mg, 0.163 mmol, 1 eq) and LiOH (11.7 mg, 0.489 mmol, 3 eq) were dissolved in MeOH (0.82 mL) THF (1.63 mL) and water (0.82 mL). After 20 hr, an additional 0.82 mL of water was added and the mixture was stirred for an additional 24 hr before being purified by preparative HPLC to give a cream colored solid (53 mg, 0.125 mmol, 76%). 1H NMR(400 MHz, Methanol-d4) δ 7.97 (d, J = 8.4 Hz, 1H), 7.67 (dd, J = 8.3, 1.6 Hz, 1H), 7.64 – 7.59(m, 2H), 4.38(dd, J = 7.0,3.2 Hz, 1H), 4.36– 4.29 (m, 1H), 3.94(s, 3H), 3.30 (s, 3H), 2.13– 1.98(m, 2H), 1.95– 1.87(m, 2H),1.87 – 1.76 (m, 2H), 1.73 – 1.57 (m, 4H), 0.86 (t, J = 7.5 Hz, 3H). LCMS 426.45 (M+H).
Compound 6
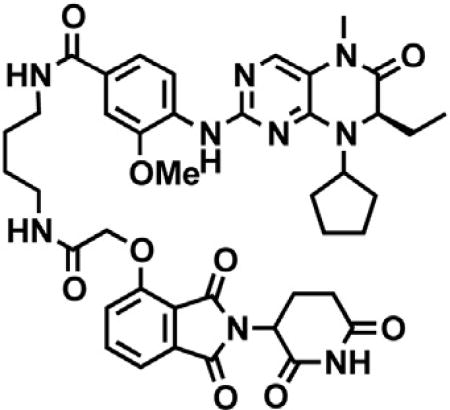
A 0.1 M solution of N-(4-aminobutyl)-2-((2-(2,6-dioxopiperidin-3-yl)-1,3-dioxoisoindolin-4-yl)oxy)acetamide trifluoroacetate in DMF (0.183 mL, 0.0183 mmol 1.2 eq) was added to (R)-4-((8-cyclopentyl-7-ethyl-5-methyl-6-oxo-5,6,7,8-tetrahydropteridin-2-yl) amino)-3-methoxybenzoic acid (6.48 mg, 0.0152 mmol, 1 eq) at room temperature. DIPEA (7.9 µl, 0.0456 mmol, 3 eq) and HATU (6.4 mg, 0.0168 mmol, 1.1 eq) were added and the mixture was stirred for 23 hr, before being purified by preparative HPLC to give a yellow solid (9.44 mg, 0.0102 mmol, 67%). 1H NMR (400 MHz, Methanol-d4) δ 7.84 – 7.77 (m, 2H), 7.58 (d, J = 1.8 Hz, 2H), 7.53 – 7.46 (m, 2H), 7.42 (d, J = 8.4 Hz, 1H), 5.11 – 5.05 (m, 1H), 4.76 (s, 2H), 4.48 (dd, J = 6.5, 3.1 Hz, 1H), 4.33 – 4.24 (m, 1H), 3.95 (s, 3H), 3.49 – 3.35 (m, 4H), 3.29 (s, 3H), 2.80 (td, J = 10.2, 4.5 Hz, 1H), 2.75 – 2.65 (m, 2H), 2.17 – 1.85 (m, 7H), 1.78 – 1.51 (m, 8H), 0.85 (t, J = 7.5 Hz, 3H). LCMS 810.60 (M+H).
Compound 7
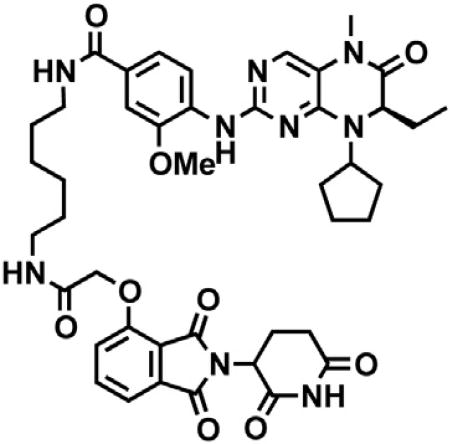
A 0.1 M solution N-(6-aminohexyl)-2-((2-(2,6-dioxopiperidin-3-yl)-1,3-dioxoisoindolin-4-yl)oxy)acetamide trifluoroacetate in DMF (0.186 mL, 0.0186 mmol 1 eq) was added to (R)-4-((8-cyclopentyl-7-ethyl-5-methyl-6-oxo-5,6,7,8-tetrahydropteridin-2-yl)amino)-3-methoxybenzoic acid (7.9 mg, 0.0186 mmol, 1 eq) at room temperature. DIPEA (9.7 µl, 0.0557 mmol, 3 eq) and HATU (7.1 mg, 0.0186 mmol, 1 eq) were added and the mixture was stirred for 19 hr, before being purified by preparative HPLC to give the desired trifluoracetate salt as a yellow solid(13.62 mg, 0.0143 mmol, 77%). 1H NMR (400 MHz, Methanol-d4) δ 7.80 (t, J = 8.3 Hz, 2H), 7.61 – 7.57 (m, 2H), 7.55 – 7.49 (m, 2H), 7.42 (d, J = 8.4 Hz, 1H), 5.13 (dd, J = 12.6, 5.5 Hz, 1H), 4.75 (s, 2H), 4.48 (dd, J = 6.5, 3.2 Hz, 1H), 4.33 – 4.24 (m, 1H), 3.97 (s, 3H), 3.40 (t, J = 7.1 Hz, 2H), 3.34 (d, J = 6.7 Hz, 2H), 3.30 (s, 3H), 2.89 – 2.82 (m, 1H), 2.77 – 2.66 (m, 2H), 2.17 – 2.11 (m, 1H), 2.08 – 2.02 (m, 2H), 1.91 (dt, J = 14.4, 7.1 Hz, 4H), 1.61 (dt, J = 13.4, 6.6 Hz, 8H), 1.49 – 1.37 (m, 4H), 0.86 (t, J = 7.5 Hz, 3H). LCMS 838.60 (M+H).
Compound 8
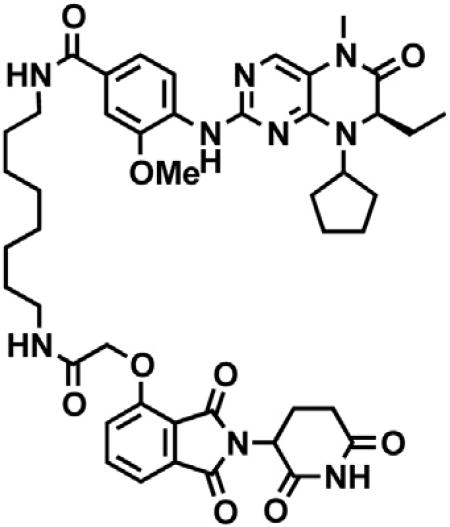
A 0.1 M solution N-(8-aminooctyl)-2-((2-(2,6-dioxopiperidin-3-yl)-1,3-dioxoisoindolin-4-yl)oxy)acetamide trifluoroacetate in DMF (0.186 mL, 0.0186 mmol 1 eq) was added to (R)-4-((8-cyclopentyl-7-ethyl-5-methyl-6-oxo-5,6,7,8-tetrahydropteridin-2-yl)amino)-3-methoxybenzoic acid (7.9 mg, 0.0186 mmol, 1 eq) at room temperature. DIPEA (9.7 µl, 0.0557 mmol, 3 eq) and HATU (7.1 mg, 0.0186 mmol, 1 eq) were added and the mixture was stirred for 16 hr, before being purified by preparative HPLC to give the desired trifluoracetate salt as an off-white solid (7.15 mg, 0.007296 mmol, 39%). 1H NMR (400 MHz, Methanol-d4) δ 7.83 – 7.77 (m, 2H), 7.61 – 7.56 (m, 2H), 7.55 – 7.50 (m, 2H), 7.42 (d, J = 8.5 Hz, 1H), 5.13 (dd, J = 12.6, 5.5 Hz, 1H), 4.75 (s, 2H), 4.49 (dd, J = 6.6, 3.3 Hz, 1H), 4.33 – 4.24 (m, 1H), 3.97 (s, 3H), 3.39 (t, J = 7.1 Hz, 2H), 3.34 – 3.32 (m, 2H), 3.30 (s, 3H), 2.90 – 2.83 (m, 1H), 2.78 – 2.70 (m, 2H), 2.18 – 2.12 (m, 1H), 2.07 – 1.87 (m, 6H), 1.71 – 1.51 (m, 8H), 1.37 (s, 8H), 0.86 (t, J = 7.5 Hz, 3H). LCMS 866.56 (M+H).
Compound 9
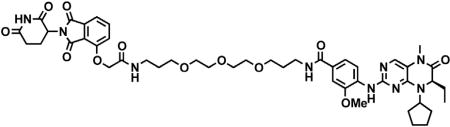
A 0.1 M solution N-(3-(2-(2-(3-aminopropoxy)ethoxy)ethoxy)propyl)-2-((2-(2,6-dioxopiperidin-3-yl)-1,3-dioxoisoindolin-4-yl)oxy) acetamide trifluoroacetate in DMF (0.172 mL, 0.0172 mmol 1 eq) was added to (R)-4-((8-cyclopentyl-7-ethyl-5-methyl-6-oxo-5,6,7,8-tetrahydropteridin-2-yl)amino)-3-methoxybenzoic acid (7.3 mg, 0.0172 mmol, 1 eq) at room temperature. DIPEA (9.0 µl, 0.0515 mmol, 3 eq) and HATU (6.5 mg, 0.0172 mmol, 1 eq) were added and the mixture was stirred for 23 hr, before being purified by preparative HPLC to give the desired trifluoracetate salt as an off-white oil (10.7 mg, 0.0101 mmol, 59%). 1H NMR (400 MHz, Methanol-d4) δ 7.78 (d, J = 8.3 Hz, 1H), 7.75 (dd, J = 8.4, 7.4 Hz, 1H), 7.56 – 7.51 (m, 2H), 7.49 – 7.44 (m, 2H), 7.36 (d, J = 8.4 Hz, 1H), 5.08 (dd, J = 12.4, 5.4 Hz, 1H), 4.69 (s, 2H), 4.44 (dd, J = 6.7, 3.2 Hz, 1H), 4.30 – 4.21 (m, 1H), 3.92 (s, 3H), 3.64 – 3.39 (m, 14H), 3.35 (t, J = 6.7 Hz, 2H), 3.25 (s, 3H), 2.85 – 2.78 (m, 1H), 2.75 – 2.64 (m, 2H), 2.14 – 1.92 (m, 5H), 1.89 – 1.80 (m, 4H), 1.76 (p, J = 6.5 Hz, 2H), 1.65 – 1.48 (m, 4H), 0.81 (t, J = 7.5 Hz, 3H). LCMS 942.62 (M+H).
ethyl 2-((2-(4-bromophenyl)imidazo[1,2-a]pyrazin-3-yl)amino)acetate
Aminopyrazine (190.2 mg, 2.0 mmol, 1 eq) and bromobenzaldehyde (555.1 mg, 3.0 mmol, 1.5 eq) were dissolved in MeOH (4 mL, 0.5M). Ethyl 2-isocyanoacetate (0.251 mL, 2.30 mmol, 1.15 eq) was added, followed by a 1 M solution of perchloric acid in MeOH (0.4 mL, 0.2 eq). The mixture was stirred at room temperature for 72 hr and diluted with EtOAc, then washed with saturated sodium bicarbonate, water and brine. The organic layer was dried over sodium sulfate, filtered and concentrated under reduced pressure. Purification by column chromatography (ISCO, 12 g silica column, 30%–100% EtOAc/hexanes, 12 min gradient) gave the product as a yellow solid (0.58 g, 1.55 mmol, 77%). 1H NMR(400 MHz, Chloroform-d) δ 8.93 (d, J = 1.2 Hz, 1H), 8.13 (dd, J = 4.6, 1.5 Hz, 1H), 7.90 (d, J = 8.5 Hz, 2H), 7.82 (d, J = 4.6 Hz, 1H), 7.52 (d, J = 8.5 Hz, 2H), 4.15 (q, J = 7.1 Hz, 2H), 3.92 (s, 1H), 3.76 (s, 2H), 1.21 (t, J = 7.2 Hz, 3H). LCMS 375.35 (M+H).
ethyl 2-((2-(4-(3,5-dimethylisoxazol-4-yl)phenyl)imidazo[1,2-a]pyrazin-3-yl)amino)acetate
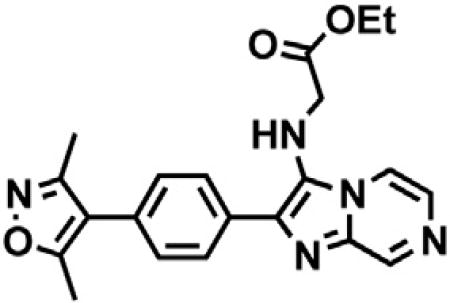
Ethyl 2-((2-(4-bromophenyl)imidazo[1,2-a]pyrazin-3-yl)amino)acetate (0.58 g, 1.55 mmol, 1 eq), potassium 3,5-dimethylisoxazole-4-trifluoroborate (0.378 g, 1.86 mmol, 1.2 eq), palladium acetate (10.4 mg, 0.0465 mmol, 3 mol%), RuPhos (43.4 mg, 0.0930 mmol, 6 mol %) and sodium carbonate (0.329 g, 3.10 mmol, 2 eq) were dissolved in EtOH (7.8 mL, 0.2M) and heated to 90°C. After 17 hr, the mixture was filtered through a silica plug and concentrated under reduced pressure. Purification by column chromatography (ISCO, 12 g silica column, 0%–100% EtOAc/hexanes, 24 min gradient) gave the desired product as a brown oil (174.6 mg, 0.446 mmol, 29%). 1H NMR (400 MHz, Chloroform-d) δ 8.92 (d, J = 1.3 Hz, 1H), 8.18 (dd, J = 4.6, 1.4 Hz, 1H), 8.11 (d, J = 8.3 Hz, 2H), 7.79 (d, J = 4.6 Hz, 1H), 7.30 (d, J = 8.4 Hz, 2H), 4.14 (q, J = 7.0 Hz, 2H), 3.84 (d, J = 5.7 Hz, 2H), 2.38 (s, 3H), 2.25 (s, 3H), 1.18 (t, J = 7.2 Hz, 3H). LCMS 392.03 (M+H).
2-((2-(4-(3,5-dimethylisoxazol-4-yl)phenyl)imidazo[1,2-a]pyrazin-3-yl)amino)acetic acid
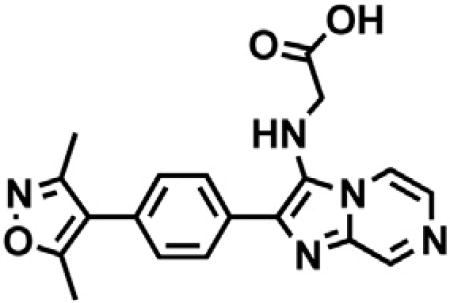
Ethyl 2-((2-(4-(3,5-dimethylisoxazol-4-yl)phenyl)imidazo[1,2-a]pyrazin-3-yl)amino)acetate (174.6 mg, 0.446 mmol, 1 eq) was dissolved in THF (2.2 mL, 0.2 M) and water (1.1 mL, 0.4 M). LiOH (16.0 mg, 0.669 mmol, 1.5 eq) was added and the mixture was stirred for 22 hr at room temperature. The mixture was then diluted with MeOH and purified by preparative HPLC to give the desired product as a dark yellow solid (123.5 mg, 0.340 mmol, 76%). 1H NMR (400 MHz, Methanol-d4) δ 9.10 (s, 1H), 8.70 (d, J = 5.4 Hz, 1H), 8.15 (d, J = 8.1 Hz, 2H), 7.97 – 7.91 (m, 1H), 7.56 (d, J = 8.2 Hz, 2H), 4.00 (s, 2H), 2.48 (s, 3H), 2.32 (s, 3H). LCMS 364.24 (M+H).
Compound 10
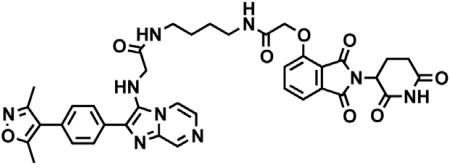
A 0.1 M solution of N-(4-aminobutyl)-2-((2-(2,6-dioxopiperidin-3-yl)-1,3-dioxoisoindolin-4-yl)oxy)acetamide trifluoroacetate in DMF (0.501 mL, 0.0501 mmol 1 eq) was added to 2-((2-(4-(3,5-dimethylisoxazol-4-yl)phenyl)imidazo[1,2-a]pyrazin-3-yl)amino)acetic acid (18.22 mg, 0.0501 mmol, 1 eq) at room temperature. DIPEA (26.3 µl, 0.150 mmol, 3 eq) and HATU (19.0 mg, 0.0501 mmol, 1 eq) were added and the mixture was stirred for 21 hr, before being purified by preparative HPLC to give HPLC to give the desired trifluoracetate salt as a dark yellow oil (29.66 mg, 0.0344 mmol, 69%). 1H NMR (400 MHz, Methanol-d4) δ 9.09 (s, 1H), 8.65 (d, J = 5.2 Hz, 1H), 8.14 – 8.06 (m, 2H), 7.94 – 7.88 (m, 1H), 7.80 – 7.74 (m, 1H), 7.59 – 7.47 (m, 3H), 7.40 (dd, J = 8.4, 4.7 Hz, 1H), 5.11 – 5.06 (m, 1H), 4.71 (s, 2H), 3.90 (s, 2H), 3.27 – 3.20 (m, 2H), 3.12 (t, J = 6.4 Hz, 2H), 2.89 – 2.79 (m, 1H), 2.76 – 2.62 (m, 2H), 2.45 (s, 3H), 2.29 (s, 3H), 2.10 (ddq, J = 10.2, 5.3, 2.7 Hz, 1H), 1.49 – 1.45 (m, 2H), 1.37 (dd, J = 6.7, 3.6 Hz, 2H). LCMS 748.39 (M+H).
Compound 11
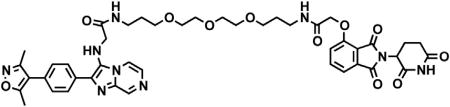
A 0.1 M solution N-(3-(2-(2-(3-aminopropoxy)ethoxy)ethoxy)propyl)-2-((2-(2,6-dioxopiperidin-3-yl)-1,3-dioxoisoindolin-4-yl)oxy) acetamide trifluoroacetate in DMF (0.510 mL, 0.0510 mmol 1 eq) was added to 2-((2-(4-(3,5-dimethylisoxazol-4-yl)phenyl)imidazo [1,2-a]pyrazin-3-yl)amino)acetic acid (18.52 mg, 0.0510 mmol, 1 eq) at room temperature. DIPEA (26.6 µl, 0.153 mmol, 3 eq) and HATU (19.4 mg, 0.0510 mmol, 1 eq) were added and the mixture was stirred for 22 hr, before being purified by preparative HPLC to give HPLC to give the desired trifluoracetate salt as a dark yellow oil (32.63 mg, 0.0328 mmol, 64%). 1H NMR (400 MHz, Methanol-d4) δ 9.09 (s, 1H), 8.66 (d, J = 5.4 Hz, 1H), 8.17 – 8.08 (m, 2H), 7.92 (d, J = 5.6 Hz, 1H), 7.77 (dd, J = 8.4, 7.4 Hz, 1H), 7.60 – 7.47 (m, 3H), 7.39 (d, J = 8.4 Hz, 1H), 5.09 (dd, J = 12.4, 5.5 Hz, 1H), 4.71 (s, 2H), 3.91 (s, 2H), 3.61 – 3.46 (m, 10H), 3.38 (dt, J = 16.0, 6.4 Hz, 4H), 3.18 (t, J = 6.8 Hz, 2H), 2.89 – 2.81 (m, 1H), 2.78 – 2.66 (m, 2H), 2.47 (s, 3H), 2.31 (s, 3H), 2.16 – 2.08 (m, 1H), 1.79 (dt, J = 12.8, 6.5 Hz, 2H), 1.64 (p, J = 6.5 Hz, 2H). LCMS 880.46 (M+H).
QUANTIFICATION AND STATISTICAL ANALYSIS
Statistical information including n, mean and statistical significance values are indicated in the text or the figure legends. Error bars in the experiments represent standard deviation (SD) of the mean values from either independent experiments or independent samples. All statistical analyses were performed using GraphPad Prism, and the detailed information about statistical methods is specified in figures/tables. Statistics considering genome-, epigenome-, and transcriptome-wide measurements and comparisons are conducted in R using Welch’s t test. In boxplot depictions of these data, boxes represent the first to third quartiles, lines represent the median of the data, and whiskers extend to 1.5X the interquartile range.
DATA AND SOFTWARE AVAILABILITY
Software
Computational code used in analysis can be obtained at the following repositories. Calculating read density Bamliquidator: https://github.com/BradnerLab/pipeline/wiki/bamliquidator. Identifying enhancers and super-enhancers: https://github.com/BradnerLab/pipeline/ - ROSE2_main.py. Defining transcriptional core regulatory circuitry: https://pypi.python.org/pypi/coltron.
Data Resources
The accession number for the RNA-, NET-, and ChIP-seq data reported in this paper is GEO: GSE79290.
Supplementary Material
KEY RESOURCES TABLE
| REAGENT or RESOURCE | SOURCE | IDENTIFIER |
|---|---|---|
| Antibodies | ||
|
| ||
| Rabbit polyclonal anti-BRD2 | Bethyl Labs | Cat#A302-582A; RRID: AB_2034828 |
|
| ||
| Rabbit polyclonal anti-BRD3 | Bethyl Labs | Cat#A302-368A; RRID: AB_1907251 |
|
| ||
| Rabbit polyclonal anti-BRD4 | Bethyl Labs | Cat#A301-985A50; RRID: AB_2631449 |
|
| ||
| Rabbit polyclonal anti-c-MYC (N-262) | Santa Cruz | Cat#sc-764; RRID: AB_631276 |
|
| ||
| Rabbit polyclonal anti-Pol II (N-20) | Santa Cruz | Cat#sc-899; RRID: AB_632359 |
|
| ||
| Mouse monoclonal anti-tubulin | Santa Cruz | Cat#sc-8035; RRID: AB_628408 |
|
| ||
| Mouse monoclonal anti-actin | Santa Cruz | Cat#sc-8432; RRID: AB_626630 |
|
| ||
| Mouse monoclonal anti-vinculin | Santa Cruz | Cat#sc-25336; RRID: AB_628438 |
|
| ||
| Rabbit polyclonal anti-CRBN | Proteintech | Cat#11435-1-AP; RRID: AB_2085739 |
|
| ||
| Rabbit polyclonal anti-PARP | Cell Signaling Technology | Cat#9542S; RRID: AB_2160739 |
|
| ||
| Rabbit polyclonal anti-cleaved caspase 3 (Asp175) | Cell Signaling Technology | Cat#9661S; RRID: AB_2341188 |
|
| ||
| Rabbit polyclonal anti-Hexim1 | Abcam | Cat#ab25388; RRID: AB_2233058 |
|
| ||
| Mouse monoclonal anti-BRD3 | Abcam | Cat#ab56342; RRID: AB_940633 |
|
| ||
| Rat monoclonal anti-Pol II CTD Ser2-P: 3E10 | Active Motif | Cat#61083 |
|
| ||
| Rat monoclonal anti-Pol II CTD Ser5-P: 3E8 | Active Motif | Cat#61085 |
|
| ||
| Rat monoclonal anti-Pol II CTD Ser7-P:4E12 | Active Motif | Cat#61087 |
|
| ||
| Rabbit polyclonal anti-H3K27ac | Abcam | Cat#ab4729; RRID: AB_2118291 |
|
| ||
| Mouse monoclonal anti-SPT5 (D5) | Santa Cruz | Cat#sc-133217; RRID: AB_2196394 |
|
| ||
| IgG control | Abcam | Cat#ab1218 |
|
| ||
| Goat polyclonal anti-Rabbit IgG (H + L) | LI-COR | Cat#925-32211; RRID: AB_2651127 |
|
| ||
| Goat polyclonal anti-Mouse IgG (H + L) | LI-COR | Cat#926-68070; RRID: AB_10956588 |
|
| ||
| Biological Samples | ||
|
| ||
| Primary human T-ALL samples | Dana-Farber Cancer Institute or UMASS Memorial Hospital | N/A |
|
| ||
| ETP-ALL samples | Michelle Hermiston and the Children’s Oncology Group | N/A |
|
| ||
| Chemicals, Peptides, and Recombinant Proteins | ||
|
| ||
| Protease inhibitor cocktail | ThermoFisher Scientific | Cat#PI78429 |
|
| ||
| Benzonase nuclease | EMD Millipore | Cat#70664 |
|
| ||
| SUPERase.In | ThermoFisher Scientific | Cat#AM2696 |
|
| ||
| α-amanitin | Sigma | Cat#A2263 |
|
| ||
| Recombinant mouse IL-7 | Peprotech | Cat#217-17 |
|
| ||
| Recombinant mouse IL-2 | Peprotech | Cat#200-02 |
|
| ||
| BRD4 (49-170) GST tag human | Sigma Aldrich | Cat#SRP0459 |
|
| ||
| CRBN-DDB1 | In this paper | N/A |
|
| ||
| CDK9/cyclin T1 | ThermoFisher Scientific | Cat#PV4131 |
|
| ||
| CDK7/9tide | ThermoFisher Scientific | Cat#PV5090 |
|
| ||
| Critical Commercial Assays | ||
|
| ||
| BCA Protein Assay Kit | ThermoFisher Scientific | Cat#23227 |
|
| ||
| Micro BCA Protein Assay Kit | ThermoFisher Scientific | Cat#23235 |
|
| ||
| CellTiter-Glo Luminescent Cell Viability Assay | Promega | Cat#G7571 |
|
| ||
| AlphaScreen Histidine Detection Kit | Perkin Elmer | Cat#6760619R |
|
| ||
| mirVana RNA isolation kit and ERCC spike in controls | ThermoFisher Scientific | Cat#AM1560 |
|
| ||
| TruSeq Stranded mRNA Library Prep Kit | Illumina | Cat#RS-122-2101 |
|
| ||
| ThruPLEX DNA-seq Kit | Rubicon Genomics | Cat#400427 |
|
| ||
| Library quantification kit | KAPA Biosystems | Cat#KK4873 |
|
| ||
| ADAPTA Universal Kinase Assay Kit | ThermoFisher Scientific | Cat#PV5099 |
|
| ||
| Deposited Data | ||
|
| ||
| RNA-, NET-, and ChIP-Sequencing Data | NCBI Gene Expression Omnibus | GEO: GSE79290 |
|
| ||
| Experimental Models: Cell Lines | ||
|
| ||
| T-ALL cell lines (SKW3, HBPALL, CUTTL1, DU528, KOPTK1, P12ICHIKAWA, DND41, JURKAT, PF382, SUPT13, SUPT11, HSB2, MOLT4, CCRFCEM, PEER, ALLSIL, LOUCY, MOLT16, RPMI8402, TALL1), MOLT4-luc, and SUPT11-luc cells were generated by lentiviral transduction of wild-type cells with pLenti-Ubc-Luc-F2A-mCherry-T2A-Puro vector outlined below | Laboratory of A. Thomas Look (DFCI) | N/A |
|
| ||
| Lymphoma cell lines (Ly7, Ly18, DHL4, Karpas620) | Laboratory of Margaret Shipp (DFCI) | N/A |
|
| ||
| AML cell lines (MV4;11, MOLM13, RS4;11, SEMK2, Mono Mac 1) | Laboratory of Scott Armstrong (DFCI) | N/A |
|
| ||
| Breast cancer cell lines (MDA-MB-436, SUM1315, SUM185, MDA-MB-231, T47D, HCC1315) | Laboratory of Kornelia Polyak (DFCI) | N/A |
|
| ||
| Lung cancer cell lines (LouNH91, HCC95, SBC5, LCLC-103H) | Broad Institute | N/A |
|
| ||
| Additional cancer cell lines (KPNYN, CI1, BT16, PxPC3, NMC-G1, MKN45) | Broad Institute | N/A |
|
| ||
| Calu 3 | ATCC | Cat#HTB-55 |
|
| ||
| NCI-H2122 | ATCC | Cat#CRL-5985 |
|
| ||
| NCI-H460 | ATCC | Cat#HTB-177 |
|
| ||
| NCI-H441 | ATCC | Cat#CRM-HTB-174 |
|
| ||
| NCI-H838 | ATCC | Cat#CRL-5844 |
|
| ||
| HCT116 | ATCC | Cat#CCL-247 |
|
| ||
| MC116 | ATCC | Cat#CRL-1649 |
|
| ||
| G401 | ATCC | Cat#CRL-1441 |
|
| ||
| SW 1783 | ATCC | Cat#HTB-13 |
|
| ||
| SKMEL28 | ATCC | Cat#HTB-72 |
|
| ||
| 293FT | ThermoFisher Scientific | Cat#R70007 |
|
| ||
| 293FTCRBN−/− | Laboratory of William Kaelin (DFCI) | N/A |
|
| ||
| Experimental Models: Organisms/Strains | ||
|
| ||
| Mouse: NSG: NOD.Cg-PrkdcscidIl2rgtm1Wjl/SzJ | The Jackson Laboratory | Cat#005557 |
|
| ||
| Recombinant DNA | ||
|
| ||
| pSpCas9(BB)-2A-GFP (PX458) | Ran et al., 2013 | Addgene Plasmid #48138 |
|
| ||
| pLenti-Ubc-Luc-F2A-mCherry-T2A-Puro | Kimbrel et al., 2009 | N/A |
|
| ||
| pLL3.7-EF1a-IRES-Gateway-nluc-2xHA-IRES2-fluc-hCL1-P2A-Puro | Laboratory of William Kaelin (DFCI) | N/A |
|
| ||
| pNIC28-Bsa4-His-BRD4(1) | Winter et al., 2015 | N/A |
|
| ||
| pFastBac-His6-CRBN | Fischer et al., 2014 | N/A |
|
| ||
| pFastBac-His6-DDB1 | Fischer et al., 2014 | N/A |
|
| ||
| Sequence-Based Reagents | ||
|
| ||
| CRBN sgRNA: TAAACAGACATGGCCGGCGA | Integrated DNA Technologies | N/A |
|
| ||
| CRBN sgRNA: GTCCTGCTGATCTCCTTCGC | Integrated DNA Technologies | N/A |
|
| ||
| Software and Algorithms | ||
|
| ||
| ImageJ | National Institutes of Health | https://imagej.nih.gov/ij/ |
|
| ||
| Flow Jo_v10 | FlowJo, LLC | https://www.flowjo.com/ |
|
| ||
| Bowtie2 2.2.1: Sequence alignment | Langmead et al., 2009 | http://bowtie-bio.sourceforge.net/bowtie2/index.shtml |
|
| ||
| Cufflinks 2.2.1 | Trapnell et al., 2010 | http://cole-trapnell-lab.github.io/cufflinks/ |
|
| ||
| HTSeq | Anders et al., 2015 | http://www-huber.embl.de/users/anders/HTSeq/doc/overview.html |
|
| ||
| Bamliquidator 1.0: Calculating read density | Lin et al., 2016 | https://github.com/BradnerLab/pipeline/wiki/bamliquidator |
|
| ||
| ROSE2: Identifying enhancers and super-enhancers | Brown et al., 2014 | https://github.com/BradnerLab/pipeline/ |
| (ROSE2_main.py) | ||
|
| ||
| COLTRON 1.0.2: Defining transcriptional core regulatory circuitry | Lin et al., 2016 | https://pypi.python.org/pypi/coltron |
|
| ||
| MACS 1.4.1: identify regions of ChIP-Seq enrichment over background | Zhang et al., 2008 | N/A |
|
| ||
| NET-seq | Mayer et al., 2015 | https://github.com/BradnerLab/netseq |
| Rahl et al., 2010 | ||
Highlights.
Competitive BET bromodomain inhibition differs from BET protein degradation
BET proteins are master regulators of productive transcription elongation
BET protein degradation is inconsequential for CDK9 recruitment
BET degradation provokes an assembly defect of a transcription elongation complex
Acknowledgments
We thank G. Lu and Professor William Kaelin for sharing the pLL3.7-EF1a-IRES-Gateway-nluc-2xHA-IRES2-fluc-hCL1-P2A-Puro lentiviral expression construct as well as Tinghu Zhang for synthesizing NVP-2. Quantitative proteomics studies were performed at the Thermo Fisher Scientific Center for Proteomics at Harvard Medical School. We thank Jennifer Perry for reading and editing this manuscript. This research was supported by generous philanthropic gifts from Marc Cohen and Alain Cohen and the William Lawrence and Blanche Hughes Foundation, as well as NIH grants (R01-HG007173 and R01-GM117333 to L.S.C. and R01-CA176745 and P01-CA109901 to J.E.B.). G.E.W. was supported by an EMBO long-term fellowship (ALTF 39-2013). D.L.B. is a Merck Fellow of the Damon Runyon Cancer Research Foundation (DRG-2196-14). A.M. was supported by Long-Term Postdoctoral Fellowships of the Human Frontier Science Program (LT000314/2013-L) and EMBO (ALTF858-2012). J.d.I. was supported by the Swiss National Science Foundation Postdoc Mobility Fellowship. J.E.R. was supported by an American Cancer Society Post-doctoral fellowship (125087-PF-13-247-01-LIB). D.L.B. and J.P. are now employees of Novartis. R.Z. is now an employee of C4 Therapeutics. N.S.G. is a Scientific Founder and member of the Scientific Advisory Board of C4 Therapeutics. J.E.B. is a Scientific Founder of Syros Pharmaceuticals, SHAPE Pharmaceuticals, Acetylon Pharmaceuticals, Tensha Therapeutics (now Roche), and C4 Therapeutics and is the inventor of IP licensed to these entities. J.E.B. is now an executive and shareholder in Novartis AG.
Footnotes
Data Resources
SUPPLEMENTAL INFORMATION
Supplemental Information includes five figures and six tables and can be found with this article online at http://dx.doi.org/10.1016/j.molcel.2017.06.004.
AUTHOR CONTRIBUTIONS
G.E.W. designed and performed experiments, analyzed data and wrote the manuscript. A.M. conducted NET-seq and fractionation experiments, co-immunoprecipitations, analyzed data, and wrote the manuscript. D.L.B. designed and synthesized small molecules. M.A.E. performed Pol II ChIP-Rx experiments and bioinformatic analysis. J.E.R. performed ex vivo PDX testing and analyzed data. S.V. ran dual luciferase assays, viability assays, and immunoblots. J.M.R. analyzed RNA-seq and ChIP-Rx datasets. J.d.I. performed bioinformatics analysis of human NET-seq data. A.S. performed in vivo work. C.J.O. tested compounds in T-ALL cell line panel. J.M.R. ran BRD4(BD1) binding assays and performed FACS analysis. R.Z. performed cellular viability assays. T.G.S. performed cellular viability assays and FACS analysis. J.P. ran CRBN/DDB1-BRD4(BD1) recombinant dimerization assay. K.L. performed bioinformatic analysis. C.M.O. performed cellular viability assays. S.D. assisted with chemical synthesis. S.B. performed coIPs and immunoblots. C.Y.L. guided analysis of ChIP-Rx data. N.S.G. and M.A.K. designed experiments and edited the manuscript. L.S.C. and J.E.B. planned and designed experiments, wrote the manuscript, and had overall responsibility over the study.
References
- Adelman K, Lis JT. Promoter-proximal pausing of RNA polymerase II: emerging roles in metazoans. Nat. Rev. Genet. 2012;13:720–731. doi: 10.1038/nrg3293. [DOI] [PMC free article] [PubMed] [Google Scholar]
- Anand P, Brown JD, Lin CY, Qi J, Zhang R, Artero PC, Alaiti MA, Bullard J, Alazem K, Margulies KB, et al. BET bromodomains mediate transcriptional pause release in heart failure. Cell. 2013;154:569–582. doi: 10.1016/j.cell.2013.07.013. [DOI] [PMC free article] [PubMed] [Google Scholar]
- Anders L, Guenther MG, Qi J, Fan ZP, Marineau JJ, Rahl PB, Lovén J, Sigova AA, Smith WB, Lee TI, et al. Genome-wide localization of small molecules. Nat. Biotechnol. 2014;32:92–96. doi: 10.1038/nbt.2776. [DOI] [PMC free article] [PubMed] [Google Scholar]
- Anders S, Pyl PT, Huber W. HTSeq–a Python framework to work with high-throughput sequencing data. Bioinformatics. 2015;31:166–169. doi: 10.1093/bioinformatics/btu638. [DOI] [PMC free article] [PubMed] [Google Scholar]
- Baker SC, Bauer SR, Beyer RP, Brenton JD, Bromley B, Burrill J, Causton H, Conley MP, Elespuru R, Fero M, et al. External RNA Controls Consortium. The External RNA Controls Consortium: a progress report. Nat. Methods. 2005;2:731–734. doi: 10.1038/nmeth1005-731. [DOI] [PubMed] [Google Scholar]
- Barsanti PA, Hu C, Jin J, Keyes R, Kucejko R, Lin X, Pan Y, Pfister KB, Sendzik M, Sutton J. Pyridine and pyrazine derivatives as protein kinase modulators (Google Patents) 2011 [Google Scholar]
- Bradner JE, Hnisz D, Young RA. Transcriptional Addiction in Cancer. Cell. 2017;168:629–643. doi: 10.1016/j.cell.2016.12.013. [DOI] [PMC free article] [PubMed] [Google Scholar]
- Brown JD, Lin CY, Duan Q, Griffin G, Federation AJ, Paranal RM, Bair S, Newton G, Lichtman AH, Kung AL, et al. NF-κB directs dynamic super enhancer formation in inflammation and atherogenesis. Mol. Cell. 2014;56:219–231. doi: 10.1016/j.molcel.2014.08.024. [DOI] [PMC free article] [PubMed] [Google Scholar]
- Ciceri P, Müller S, O’Mahony A, Fedorov O, Filippakopoulos P, Hunt JP, Lasater EA, Pallares G, Picaud S, Wells C, et al. Dual kinase-bromodomain inhibitors for rationally designed polypharmacology. Nat. Chem. Biol. 2014;10:305–312. doi: 10.1038/nchembio.1471. [DOI] [PMC free article] [PubMed] [Google Scholar]
- Dobin A, Davis CA, Schlesinger F, Drenkow J, Zaleski C, Jha S, Batut P, Chaisson M, Gingeras TR. STAR: ultrafast universal RNA-seq aligner. Bioinformatics. 2013;29:15–21. doi: 10.1093/bioinformatics/bts635. [DOI] [PMC free article] [PubMed] [Google Scholar]
- Fischer ES, Böhm K, Lydeard JR, Yang H, Stadler MB, Cavadini S, Nagel J, Serluca F, Acker V, Lingaraju GM, et al. Structure of the DDB1-CRBN E3 ubiquitin ligase in complex with thalidomide. Nature. 2014;512:49–53. doi: 10.1038/nature13527. [DOI] [PMC free article] [PubMed] [Google Scholar]
- Hartzog GA, Wada T, Handa H, Winston F. Evidence that Spt4, Spt5, and Spt6 control transcription elongation by RNA polymerase II in Saccharomyces cerevisiae. Genes Dev. 1998;12:357–369. doi: 10.1101/gad.12.3.357. [DOI] [PMC free article] [PubMed] [Google Scholar]
- Huttlin EL, Jedrychowski MP, Elias JE, Goswami T, Rad R, Beausoleil SA, Villén J, Haas W, Sowa ME, Gygi SP. A tissue-specific atlas of mouse protein phosphorylation and expression. Cell. 2010;143:1174–1189. doi: 10.1016/j.cell.2010.12.001. [DOI] [PMC free article] [PubMed] [Google Scholar]
- Itzen F, Greifenberg AK, Bösken CA, Geyer M. Brd4 activates P-TEFb for RNA polymerase II CTD phosphorylation. Nucleic Acids Res. 2014;42:7577–7590. doi: 10.1093/nar/gku449. [DOI] [PMC free article] [PubMed] [Google Scholar]
- Jang MK, Mochizuki K, Zhou M, Jeong HS, Brady JN, Ozato K. The bromodomain protein Brd4 is a positive regulatory component of P-TEFb and stimulates RNA polymerase II-dependent transcription. Mol. Cell. 2005;19:523–534. doi: 10.1016/j.molcel.2005.06.027. [DOI] [PubMed] [Google Scholar]
- Jonkers I, Lis JT. Getting up to speed with transcription elongation by RNA polymerase II. Nat. Rev. Mol. Cell Biol. 2015;16:167–177. doi: 10.1038/nrm3953. [DOI] [PMC free article] [PubMed] [Google Scholar]
- Jonkers I, Kwak H, Lis JT. Genome-wide dynamics of Pol II elongation and its interplay with promoter proximal pausing, chromatin, and exons. eLife. 2014;3:e02407. doi: 10.7554/eLife.02407. [DOI] [PMC free article] [PubMed] [Google Scholar]
- Kimbrel EA, Davis TN, Bradner JE, Kung AL. In vivo pharma-codynamic imaging of proteasome inhibition. Mol. Imaging. 2009;8:140–147. [PubMed] [Google Scholar]
- Klein BJ, Bose D, Baker KJ, Yusoff ZM, Zhang X, Murakami KS. RNA polymerase and transcription elongation factor Spt4/5 complex structure. Proc. Natl. Acad. Sci. USA. 2011;108:546–550. doi: 10.1073/pnas.1013828108. [DOI] [PMC free article] [PubMed] [Google Scholar]
- Kwiatkowski N, Zhang T, Rahl PB, Abraham BJ, Reddy J, Ficarro SB, Dastur A, Amzallag A, Ramaswamy S, Tesar B, et al. Targeting transcription regulation in cancer with a covalent CDK7 inhibitor. Nature. 2014;511:616–620. doi: 10.1038/nature13393. [DOI] [PMC free article] [PubMed] [Google Scholar]
- Langmead B, Trapnell C, Pop M, Salzberg SL. Ultrafast and memory-efficient alignment of short DNA sequences to the human genome. Genome Biol. 2009;10:R25. doi: 10.1186/gb-2009-10-3-r25. [DOI] [PMC free article] [PubMed] [Google Scholar]
- Lin CY, Lovén J, Rahl PB, Paranal RM, Burge CB, Bradner JE, Lee TI, Young RA. Transcriptional amplification in tumor cells with elevated c-Myc. Cell. 2012;151:56–67. doi: 10.1016/j.cell.2012.08.026. [DOI] [PMC free article] [PubMed] [Google Scholar]
- Lin CY, Erkek S, Tong Y, Yin L, Federation AJ, Zapatka M, Haldipur P, Kawauchi D, Risch T, Warnatz H-JJ, et al. Active medulloblastoma enhancers reveal subgroup-specific cellular origins. Nature. 2016;530:57–62. doi: 10.1038/nature16546. [DOI] [PMC free article] [PubMed] [Google Scholar]
- Lovén J, Hoke HA, Lin CY, Lau A, Orlando DA, Vakoc CR, Bradner JE, Lee TI, Young RA. Selective inhibition of tumor oncogenes by disruption of super-enhancers. Cell. 2013;153:320–334. doi: 10.1016/j.cell.2013.03.036. [DOI] [PMC free article] [PubMed] [Google Scholar]
- Lu G, Middleton RE, Sun H, Naniong M, Ott CJ, Mitsiades CS, Wong KK, Bradner JE, Kaelin WG., Jr The myeloma drug lenalidomide promotes the cereblon-dependent destruction of Ikaros proteins. Science. 2014;343:305–309. doi: 10.1126/science.1244917. [DOI] [PMC free article] [PubMed] [Google Scholar]
- Lu J, Qian Y, Altieri M, Dong H, Wang J, Raina K, Hines J, Winkler JD, Crew AP, Coleman K, Crews CM. Hijacking the E3 Ubiquitin Ligase Cereblon to Efficiently Target BRD4. Chem. Biol. 2015;22:755–763. doi: 10.1016/j.chembiol.2015.05.009. [DOI] [PMC free article] [PubMed] [Google Scholar]
- Margaritis T, Holstege FC. Poised RNA polymerase II gives pause for thought. Cell. 2008;133:581–584. doi: 10.1016/j.cell.2008.04.027. [DOI] [PubMed] [Google Scholar]
- Martinez Molina D, Jafari R, Ignatushchenko M, Seki T, Larsson EA, Dan C, Sreekumar L, Cao Y, Nordlund P. Monitoring drug target engagement in cells and tissues using the cellular thermal shift assay. Science. 2013;341:84–87. doi: 10.1126/science.1233606. [DOI] [PubMed] [Google Scholar]
- Martinez-Rucobo FW, Sainsbury S, Cheung AC, Cramer P. Architecture of the RNA polymerase-Spt4/5 complex and basis of universal transcription processivity. EMBO J. 2011;30:1302–1310. doi: 10.1038/emboj.2011.64. [DOI] [PMC free article] [PubMed] [Google Scholar]
- Mayer A, di Iulio J, Maleri S, Eser U, Vierstra J, Reynolds A, Sandstrom R, Stamatoyannopoulos JA, Churchman LS. Native elongating transcript sequencing reveals human transcriptional activity at nucleotide resolution. Cell. 2015;161:541–554. doi: 10.1016/j.cell.2015.03.010. [DOI] [PMC free article] [PubMed] [Google Scholar]
- McAlister GC, Nusinow DP, Jedrychowski MP, Wühr M, Huttlin EL, Erickson BK, Rad R, Haas W, Gygi SP. MultiNotch MS3 enables accurate, sensitive, and multiplexed detection of differential expression across cancer cell line proteomes. Anal. Chem. 2014;86:7150–7158. doi: 10.1021/ac502040v. [DOI] [PMC free article] [PubMed] [Google Scholar]
- McKeown MR, Shaw DL, Fu H, Liu S, Xu X, Marineau JJ, Huang Y, Zhang X, Buckley DL, Kadam A, et al. Biased multicomponent reactions to develop novel bromodomain inhibitors. J. Med. Chem. 2014;57:9019–9027. doi: 10.1021/jm501120z. [DOI] [PMC free article] [PubMed] [Google Scholar]
- Orlando DA, Chen MW, Brown VE, Solanki S, Choi YJ, Olson ER, Fritz CC, Bradner JE, Guenther MG. Quantitative ChIP-Seq normalization reveals global modulation of the epigenome. Cell Rep. 2014;9:1163–1170. doi: 10.1016/j.celrep.2014.10.018. [DOI] [PubMed] [Google Scholar]
- Peterlin BM, Price DH. Controlling the elongation phase of transcription with P-TEFb. Mol. Cell. 2006;23:297–305. doi: 10.1016/j.molcel.2006.06.014. [DOI] [PubMed] [Google Scholar]
- Rahl PB, Lin CY, Seila AC, Flynn RA, McCuine S, Burge CB, Sharp PA, Young RA. c-Myc regulates transcriptional pause release. Cell. 2010;141:432–445. doi: 10.1016/j.cell.2010.03.030. [DOI] [PMC free article] [PubMed] [Google Scholar]
- Ran FA, Hsu PD, Wright J, Agarwala V, Scott DA, Zhang F. Genome engineering using the CRISPR-Cas9 system. Nat. Protoc. 2013;8:2281–2308. doi: 10.1038/nprot.2013.143. [DOI] [PMC free article] [PubMed] [Google Scholar]
- Saint-André V, Federation AJ, Lin CY, Abraham BJ, Reddy J, Lee TI, Bradner JE, Young RA. Models of human core transcriptional regulatory circuitries. Genome Res. 2016;26:385–396. doi: 10.1101/gr.197590.115. [DOI] [PMC free article] [PubMed] [Google Scholar]
- Sanda T, Lawton LN, Barrasa MI, Fan ZP, Kohlhammer H, Gutierrez A, Ma W, Tatarek J, Ahn Y, Kelliher MA, et al. Core transcriptional regulatory circuit controlled by the TAL1 complex in human T cell acute lymphoblastic leukemia. Cancer Cell. 2012;22:209–221. doi: 10.1016/j.ccr.2012.06.007. [DOI] [PMC free article] [PubMed] [Google Scholar]
- Tanaka M, Roberts JM, Seo HS, Souza A, Paulk J, Scott TG, DeAngelo SL, Dhe-Paganon S, Bradner JE. Design and characterization of bivalent BET inhibitors. Nat. Chem. Biol. 2016;12:1089–1096. doi: 10.1038/nchembio.2209. [DOI] [PMC free article] [PubMed] [Google Scholar]
- Trapnell C, Williams BA, Pertea G, Mortazavi A, Kwan G, van Baren MJ, Salzberg SL, Wold BJ, Pachter L. Transcript assembly and quantification by RNA-Seq reveals unannotated transcripts and isoform switching during cell differentiation. Nat. Biotechnol. 2010;28:511–515. doi: 10.1038/nbt.1621. [DOI] [PMC free article] [PubMed] [Google Scholar]
- Van Vlierberghe P, Ferrando A. The molecular basis of T cell acute lymphoblastic leukemia. J. Clin. Invest. 2012;122:3398–3406. doi: 10.1172/JCI61269. [DOI] [PMC free article] [PubMed] [Google Scholar]
- Weekes MP, Tomasec P, Huttlin EL, Fielding CA, Nusinow D, Stanton RJ, Wang EC, Aicheler R, Murrell I, Wilkinson GW, et al. Quantitative temporal viromics: an approach to investigate host-pathogen interaction. Cell. 2014;157:1460–1472. doi: 10.1016/j.cell.2014.04.028. [DOI] [PMC free article] [PubMed] [Google Scholar]
- Whyte WA, Orlando DA, Hnisz D, Abraham BJ, Lin CY, Kagey MH, Rahl PB, Lee TI, Young RA. Master transcription factors and mediator establish super-enhancers at key cell identity genes. Cell. 2013;153:307–319. doi: 10.1016/j.cell.2013.03.035. [DOI] [PMC free article] [PubMed] [Google Scholar]
- Winter GE, Buckley DL, Paulk J, Roberts JM, Souza A, Dhe-Paganon S, Bradner JE. DRUG DEVELOPMENT. Phthalimide conjugation as a strategy for in vivo target protein degradation. Science. 2015;348:1376–1381. doi: 10.1126/science.aab1433. [DOI] [PMC free article] [PubMed] [Google Scholar]
- Zengerle M, Chan KH, Ciulli A. Selective Small Molecule Induced Degradation of the BET Bromodomain Protein BRD4. ACS Chem. Biol. 2015;10:1770–1777. doi: 10.1021/acschembio.5b00216. [DOI] [PMC free article] [PubMed] [Google Scholar]
- Zhang Y, Liu T, Meyer CA, Eeckhoute J, Johnson DS, Bernstein BE, Nusbaum C, Myers RM, Brown M, Li W, Liu XS. Model-based analysis of ChIP-Seq (MACS) Genome Biol. 2008;9:R137. doi: 10.1186/gb-2008-9-9-r137. [DOI] [PMC free article] [PubMed] [Google Scholar]
Associated Data
This section collects any data citations, data availability statements, or supplementary materials included in this article.