

Abstract
Self-assembly of plasma membrane-associated Ras GTPases has major implications to the regulation of cell signaling. However, the structural basis of homo-oligomerization and the fractional distribution of oligomeric states remained undetermined. We have addressed these issues by deciphering the distribution of dimers and higher-order oligomers of K-Ras4B, the most frequently mutated Ras isoform in human cancers. We focused on the constitutively active G12V K-Ras and two of its variants, K101E and K101C/E107C, which respectively destabilize and stabilize oligomers. Using raster image correlation spectroscopy and number and brightness analysis combined with fluorescence recovery after photobleaching, fluorescence correlation spectroscopy and electron microscopy in live cells, we show that G12V K-Ras exists as a mixture of monomers, dimers and larger oligomers, while the K101E mutant is predominantly monomeric and K101C/E107C is dominated by oligomers. This observation demonstrates the ability of K-Ras to exist in multiple oligomeric states whose population can be altered by interfacial mutations. Using molecular modeling and simulations we further show that K-Ras uses two partially overlapping interfaces to form compositionally and topologically diverse oligomers. Our results thus provide the first detailed insight into the multiplicity, structure, and membrane organization of K-Ras homomers.
Graphical Abstract

INTRODUCTION
Human Ras proteins are intracellular molecular switches that mediate many diverse signal transduction pathways controlling cell growth and development.1,2 They act as molecular switches by oscillating between inactive guanine diphosphate (GDP)-and active guanine triphosphate (GTP)-bound conformational states.3,4 GTP-bound Ras interacts with effector kinases and transduces signal to the nucleus via multiple pathways including the MAPK and AKT cascades.2–4 Oncogenic mutations impair the ability of Ras to hydrolyze GTP and thus lead to unregulated signal transduction.2,5 Of the three common Ras isoforms in humans (N-, H- and K-Ras4 (A&B)), K-Ras4B (here after K-Ras) is therapeutically the most significant as it is found mutated in 15–25% of all human cancers or about 85% of Ras-associated cancers.2,5
The effector-binding surface of K-Ras is located at the highly conserved catalytic domain (residues 1–166). In contrast, the functionally required attachment of K-Ras to the inner surface of the plasma membrane (PM) is achieved via a C-terminal hypervariable region (HVR, residues 167–185) that contains a farnesylated polybasic motif.6 Upon PM binding, K-Ras is believed to assemble into potentially functional dimers7–10 and/or higher-order proteolipid oligomers termed nano-clusters.11–14 Unlike dimerization, which attracted attention only in recent years, Ras nanoclustering has been studied extensively using a variety of techniques. These include electron microscopy (EM), single particle tracking (SPT) and biochemical methods.15–19 For instance, EM spatial mapping of gold-labeled Ras proteins on PM sheets has shown that Ras clusters are approximately 10 nm in radius and contain 5–8 proteins.20–22 Similarly, cell biological experiments and mathematical modeling showed that Ras nanoclusters are signaling hubs for effector recruitment and activation.20 However, the molecular basis of Ras nanoclustering and its potential connection to dimer formation remain undetermined. As an initial step toward addressing these questions, we recently described two partially overlapping protein–protein interaction interfaces (PPIs) that underlie K-Ras self-interactions.9
The focus of the current work is to (i) test our hypothesis that the two partially overlapping PPIs we recently described can give rise to multiple K-Ras oligomers in cells, and (ii) examine the diversity and size distribution of laterally diffusive K-Ras oligomers on the PM. As model systems we used the oncogenic G12V K-Ras (WT) and its variants K101E (KE), E107K (EK) and K101C/E107C (CC) expressed in baby hamster kidney (BHK) cells. We chose these mutants because introduction of charge repulsion at the previously described PPIs through K101E and/or E107K mutation significantly reduced clustering while a double cysteine mutation at the same location dramatically increased clustering likely through intermolecular disulfide bond formation.9 No single technique would be able to simultaneously characterize the fractional distribution of the potentially diverse K-Ras oligomers and their molecular structures. Thus, we combined raster image correlation and number and brightness (RICS/N&B) analysis, fluorescence recovery after photobleaching (FRAP), fluorescence correlation spectroscopy (FCS) and EM imaging with molecular modeling. Our results show that K-Ras exists in diverse oligomeric states whose distribution is sensitive to mutation of interfacial residues.
MATERIALS AND METHODS
Figure 1A schematically summarizes our combined experimental and computational approach to investigating the molecular organization of K-Ras on the PM.
Figure 1.

Summary of our approach. (A) Schematics of our approach to studying the distribution of K-Ras oligomers on the cell plasma membrane (PM). Guided by previously described protein–protein interaction interfaces (PPIs), we designed PPI-destabilizing and -stabilizing K-Ras mutations and studied their dynamics in live BHK cells using—in increasing order of resolution—fluorescence recovery after photobleaching (FRAP), fluorescence correlation spectroscopy (FCS) and raster image correlation spectroscopy (RICS) with number and brightness (N&B) analysis, complemented by electron microscopy (EM) imaging and computational modeling. (B) Localization of K-Ras, membrane-targeted monomeric EGFP (mem-EGFP) and cytoplasmic monomeric EGFP (cyt-GFP) in BHK cells. GFP-tagged K-Ras and mem-EGFP reside primarily on the PM, while cyt-GFP is localized throughout the cytosol and the nucleus.
Experimental Methods
For all experiments, monomeric enhanced green fluorescent protein (EGFP)-tagged WT, KE and CC K-Ras proteins were ectopically expressed in BHK cells (Lipofectamine, Invitrogen). For control experiments we used cytosolic GFP (cyt-GFP) and a membrane-bound EGFP (mem-EGFP), a GFP containing an N-terminally palmitoylated GAP-43 sequence cloned in a pEGFP-1 vector.23 Cells were maintained at 37 °C in Dulbecco’s modified Eagle medium (DMEM), 10% bovine calf serum (Hyclone) and 5% (v/v) CO2 in a 35 mm glass bottom dish (MatTek Corporation). Fluorescence measurements were carried out with Nikon A1 confocal microscope using CFI Plan Apo IR 60× 1.27 NA water immersion objective at 22 °C. Imaging was done with cells immersed in live cell imaging solution containing HEPES buffered physiological saline (Life Technologies), pH 7.4.
FRAP
Following previous reports (e.g., see ref 24), a 4 μm-wide rectangular region of interest (ROI) on the basal side of the PM, where the expression profile of EGFP-K-Ras was uniform, was photobleached with 80% transmission laser power. Images were taken on a 256 × 256 pixels scan area with the pinhole set to 1–2 Airy units. To minimize acquisition bleaching and maximize signal-to-background ratio prebleach and postbleach images were taken at the same acquisition setting: the highest frame rate of 4 frames per second and 0.5% of the 488 nm laser transmission power. Fluorescence recovery was quantified with ImageJ and plotted with Graphpad. The data were fit using the general empirical expression25 F(t) = F∞(1 − (ω2(ω2 + 4πDt)−1)1/2), where D is the diffusion coefficient of the fluorescent molecules, F(t) and F∞ denote fluorescence intensity at time t and after full recovery, and ω = 4 μm is the strip-width of the ROI (see legend of Figure 2). The recovery halftime can then be calculated as t1/2 = (0.75ω2)/πD.25 Goodwin and Kenworthy24 have shown that t1/2 but not D is significantly affected by the size of the strip-width; they measured D = 1.13 ± 0.27 μm2/s and 1.01 ± 0.01 μm2/s for K-Ras using ω = 1.4 and 4 μm. Similarly, we found that changing the height of the ROI from 1 to 3 μm only slightly altered the D of WT K-Ras (from 0.8 ± 0.1 μm2/s to 0.7 ± 0.1 μm2/s). Therefore, we used a 4 μm ×1 μm ROI for the rest of the experiments.
Figure 2.

FRAP and FCS analyses. (A) Fluorescence recovery curves for WT (i.e., G12V K-Ras, circle) and its variants KE (triangle) and CC (square). A 4 μm × 1 μm area at the basal PM was photobleached with 80% laser power (see inset, middle) and recovery of the fluorescence was monitored at the highest acquisition frame rate with 0.5% laser power. The mobile fraction (Mf) at time t = 50 s is highlighted. (B) Scatter plot of diffusion coefficients, D, obtained from fitting the recovery curves to a bicomponent empirical diffusion model: F(t) = F∞(1 − (a(ω2(ω2 + 4πD1x)−1))1/2) + (1 − ((1 − a)( ω2(ω2 + 4πD2x)−1))1/2). Only the fast component (D1) is shown here; see Table S1 for the slow component D2. Significance was determined by unpaired two-tailed t test and indicated as * (P ≤ 0.0232). (C) Normalized fluorescence autocorrelation (G(τ)) curves for WT (black), KE (red) and CC (blue) shown in symbols and their fitting to an empirical bicomponent 2D diffusion model (lines). Residuals of the fits are shown as insets, highlighting the goodness of the fits. These experiments were carried out using PicoQuant attached to Nikon A1 confocal microscope with 485-pulsed diode laser. Averages from three runs of 30 s each are shown. Note: as discussed in Methods and SI, a significant fraction of the FCS measurements required a 3-component diffusion model for a proper fit. (D) Scatter plot of FCS-derived diffusion coefficients based on the slowest component of both the bicomponent and 3-component 2D diffusion models. *** = P ≤ 0.0001. The error bar in (B) and (D) represents standard deviation (SD) of the measurements; 7–18 cells were used.
FCS
PicoQuant (PQ GMBH, Germany) attached to a Nikon A1 confocal microscope with 485 nm pulsed diode laser and repetition rate of 40 MHz was used for single-point FCS measurements. Emission spectrum was detected using SPAD (Single Photon Avalanche Detector). The size of the observation volume (ω) and other conditions were calibrated by the Symphotime64 software using FCS measurements of free fluorescein dye whose diffusion coefficient has been well established (≈ 425 μm2/s). To reduce noise only cells transiently expressing low levels of the protein were considered (after 16–24 h of transfection), with the PM marked by the ROI indicator and inspected using the live intensity histogram focusing along the z-axis.26 Four repeats of 30s scans were taken but the first scan was excluded due to bleaching on the firing of the laser as evidenced by uneven fluorescent time traces. The data was analyzed with Origin as described in Supporting Information. Briefly, a bicomponent diffusion model was used to fit some of the data but the majority of the K-Ras data required a 3-component model. Comparison with previous reports25–29 suggests that the fastest component (tD1) in the bicomponent and the intermediate component (tD2) in the tricomponent model, ranging between 195 and 500 μs are associated with the GFP photophysics. The source of the very fast component (2–100 μs) in the latter is unclear. Thus, we considered the average of the slow component D values from both the 2- and 3-component fitting models.
RICS and N&B Analysis
For RICS measurements we set the 488 nm laser power to 0.5% corresponding to 1.75 mW at the sample. Images were scanned at the rate of 23.8 μs/pixel for cyt-GFP in the cytoplasm and 53.1 μs/pixel for mem-EGFP and EGFP-K-Ras at membranes. These rates were chosen so that the average translational diffusion time of each fluorescent species is slower than the scanning time. A stack of 100 images was acquired at 256 × 256 pixels frame size. The width of the point-spread function, w, was calibrated by using 5 nM Fluorescein (Invitrogen) in 10 M Tris buffer and fixing its D to 400 μm2/s (see for example ref 30 for calibration with fluorescein dye). This yielded the typical value of w ≈ 0.3 μm,31 which was used in the formula to generate the D of diffusing membrane proteins. A BHK cell expressing mem-EGFP was used as our brightness standard, and to calibrate laser power and other microscopic conditions. The data was analyzed following previous reports32,33 and as described in SI. Briefly, we define oligomer size as the ratio of the measured brightness and the brightness of monomeric mem-EGFP after subtracting the apparent brightness of immobile molecules (see for example ref 33).
EM Spatial Mapping
Intact PM sheets from BHK cells coexpressing EGFP-K-Ras mutants and mRFP-CRaf were prepared and labeled with anti-GFP antibody conjugated with 6 nm gold particles, and anti-RFP antibody conjugated with 2 nm gold particles, respectively, and imaged with transmission electron microscope. PM recruitment and coclustering of C-Raf and K-Ras mutants were analyzed by bivariate EM spatial mapping as described previously.34
Computational Methods
We recently reported multiple K-Ras dimer models and two partially overlapping PPIs that have the potential to form diverse oligomers.9 To model larger K-Ras oligomers, we first required that each monomer within a cluster should bind a planar membrane. This eliminates oligomers of the D-symmetry group except D2 (dimer of dimer). Second, the fact that we have identical subunits, and that the two reactive surfaces centered on helices h3–5 are proximal and overlapping, implicates them as the likely interfaces for larger oligomers. Re-examination of our dimer models with these in mind allowed us to build a trimer and a tetramer model, as follows. We first superimposed one subunit each of i1 and i2 dimer structures, varying the template subunit in search of a combination with minimal atomic clashes. We then deleted the template subunit used for overlay and applied translations and rotations to further relieve atomic clashes. This resulted in one open (with the two interfaces being i1 and i2) and one closed (with the third interface being a hybrid of i1 and i2) trimer models. Similarly, we built an initial tetramer model by bringing i1 and i2 dimers closer together and applying rotations and translations such that i1 and i2 form a single continuous interface. This yielded a pseudo-C4 complex with helix 4 at the center. Each model was then attached to a pre-equilibrated bilayer made up of POPC (1-palmitoyl-2-oleoyl-sn-glycero-3-phosphocholine) and POPS (1-palmitoyl-2-oleoyl-sn-glyc-ero-3-phosphoserine) lipids (5:1 ratio), solvated, energy-minimized, and simulated for 1 μs using the NAMD2.9 program and the CHARMM27 and CHARMM36 force fields. The rest of the simulation details are identical to that described in a recent report.9
RESULTS
Figure 1B summarizes the distribution of the different fluorophore systems investigated in this work in BHK cells: EGFP-tagged K-Ras mutants and mem-EGFP localize at membranes including the PM while cyt-GFP resides in the cytosol and nucleus.
FRAP and FCS Analyses of WT and Mutant K-Ras
Examples of FRAP curves for WT, KE and CC K-Ras are shown in Figure 2A (the insets illustrate the pre- and postbleach fluorescence at the indicated ROI). In the majority of the cells that we have analyzed the recovery curves fit well to a two-component empirical diffusion model, yielding two distinct diffusion coefficients D1 and D2 with similar weights (Table S1). Consistent with a previous observation using single molecule FRET,35 we found that D1 (0.11–0.40 μm2/s) is 5–10 times larger than D2 (0.03–0.09 μm2/s). This shows that there are at least two distinct species of GFP-labeled K-Ras that differ in dynamics within the time (seconds) and length (μm) scales of FRAP. The distribution of D1 (Figure 2B) shows little variation among WT, KE and CC K-Ras, each being reasonably close to the D of 1.01 μm2/s24 and 0.3–1.6 μm2/s36 measured by others for GFP-K-Ras using the same experimental setup. A notable difference among WT, KE and CC was in the fraction of cells harboring species with two distinct diffusivities: 55% in KE, 80% in WT and 88% in CC, suggesting potential differences in their ability to form slowly diffusing species or differential impact from barriers to free diffusion. Diffusion of Ras is dominated by lateral mobility on the PM,36,37 and we previously showed using EM and FLIM/FRET that clustering is decreased in the KE mutant and increased in CC relative to WT.9 Together, these results suggest an altered molecular organization of KE and CC compared with WT. Consistent with this interpretation, the mobile fraction of molecular species is larger in KE (~89%) than WT and CC (73–76%). However, FRAP can suffer from potential artifacts associated with the high bleaching power as well as from errors in the empirical model used for data fitting, which can be as high as 30% (see ref 24 and references therein).
Figure 2C and Figures S1 and S2 show examples of fluorescence autocorrelation functions (G(τ)) from FCS measurements in cells expressing EGFP-K-Ras mutants and mem-EGFP. Unlike our control mem-EGFP, the K-Ras FCS data could be grouped in to two: “typical” G(τ) curves that can be fit to a bicomponent diffusion model (see examples in Figure 2C and Figure S1) and “atypical” G(τ)’s that could only be fitted to a 3-component model (Figure S2A,B). About 50, 58 and 89% of cells expressing KE, WT and CC K-Ras gave rise to FCS data that fall into the second category (Figure S2C). As mentioned in Methods, we used the last component of both groups to derive average D of 0.57, 0.91, and 0.21 μm2/s for WT, KE and CC, respectively (Figure 2D). The amplitude of the slowest component was 10–40%, suggesting that the dynamics of a significant fraction of the fluorescent molecules could be captured by the slowest component. For additional control and to determine if the atypical profiles are unique to K-Ras, we measured the diffusional dynamics of phosphatidylserine (PS) labeled by the PS-specific marker EGFP-LactC2.38 We obtained an average D = 0.7 ± 0.2 μm2/s for this construct, which is within error of the D for WT and KE. However, unlike K-Ras, all of the G(τ) curves of EGFP-LactC2-PS could be fit well to a 2-componenet diffusion model. Since there is no evidence of EGFP-LactC2-PS self-assembly and given our FRAP data, we reasoned that oligomer formation might account for the long lag times in the 3-componenet atypical G(τ) profiles of K-Ras. Testing this hypothesis requires a technique that allows for separating species whose lateral mobility is altered only by oligomer formation from transiently immobilized complexes such as those observed by single molecule FRET.35
RICS and N&B Analyses Show That K-Ras Forms Dimer, Trimer and Tetramer
An example of a typical RICS image and fluorescence intensity distribution derived from it are shown in Figure 3A. Analysis of such images over many cells (see Methods) yielded the D distributions depicted in Figure 3B. Taking the mean of these distributions we obtained D’s of 7.22 and 4.70 μm2/s for mem-EGFP and EGFP-LactC2-PS, and 5.05, 2.19, and 1.35 μm2/s for KE, WT and CC, respectively. These values suggest a > 5-times faster rate of lateral mobility than estimates by FRAP or FCS. Since in our analysis the contribution from immobile fractions is subtracted out (see SI and refs33,39), only the highly mobile (in the μs range) species contribute to the diffusion we obtained from RICS. We therefore believe the smaller D values from FRAP and FCS are attributable to contributions from immobile or very slowly (milliseconds to seconds) diffusing species. Moreover, our RICS data shows that the diffusion of KE is similar to monomeric mem-EGFP and EGFP-LactC2-PS whereas those of WT and CC are 3–4 fold smaller, suggesting that the mobile fraction of KE is largely monomeric while WT and CC contain oligomers. This is supported by data from N&B analysis. The single peak in the brightness distribution of mem-EGFP indicates a single species (Figure S3) with a mean B-1 value of 1.229 or 23145 cpsm, which is comparable to the 21260 cpsm we obtained for cyt-GFP or the 24800 cpsm reported by others.40 In contrast, the brightness distributions for the K-Ras mutants have multiple peaks with different brightness values, suggesting at least two species of KE and up to four species of WT and CC (Figure 3C). Normalization of these histograms by the brightness of mem-EGFP and reweighting by the fraction of pixels associated with a given brightness value yielded the frequency distributions shown in Figure 3D. The data shows that the monomer fraction in WT is 38%, with the remaining being dimer (51%) and trimer (10%). In contrast, KE is primarily monomeric (73%), with a 27% dimer content. CC is predominantly dimer (58%) and trimer (38%) with a minor population of tetramer (3%). These variations in oligomer content are consistent with the observed differences in lateral dynamics. For example, the monomer fraction in WT is equal to the trimer fraction in CC while their dimer content is about the same. Assuming similar concentration (i.e., expression level) and free diffusion, a simple calculation based on molecular weight would yield DWT ≈ 1.73 × DCC, which is comparable to the 1.5 to 2-fold difference in the measured diffusion coefficients. In sum, the interface mutations KE and CC shift the oligomer distribution toward monomeric and oligomeric states, respectively.
Figure 3.

RICS and N&B analyses. (A) Fluorescence intensity image (blue-yellow-red indicate low, medium and high) showing the distribution of EGFP-tagged WT K-Ras on the surface of a BHK cell (left) and histogram of the intensity in the region indicated by the square box (right). The intensity histogram shows an oval shaped distribution profile of the analyzed squared area, indicating the presence of slow-diffusing species. We used a one-component 2D diffusion model for data fitting. A pixel size of 0.050 μm was used in this analysis. For the fit, the waist was measured to be 0.30 μm. The same analysis was conducted on our controls mem-EGFP and LactC2-PS. (B) Scatter plot of diffusion coefficients from RICS analysis of multiple 64 × 64 pixel boxes that span the entire surface of the cell, using a calibrated w value of 0.3 μm. *** = P ≤ 0.0001. (C) Distribution of molecular brightness values obtained from averaging over multiple 64 × 64 pixel scans of the cell surface. The K-Ras mutants exhibit multiple brightness values that correspond to 1-, 2-, 3-, or 4-times the brightness of mem-EGFP, which exists as a single species of brightness 23145 cpsm (counts per second per molecule). (D) Percent occurrence of the different species (or brightness values) shown in (C) after normalization with the brightness of mem-EGFP and weighting by the number of pixels representing each brightness value. We analyzed 10–20 cells for each system; error bars represent SD.
Computational Modeling Suggests That K-Ras Can Form Oligomers of Diverse Size
There are over a dozen structures of monomeric K-Ras in the protein data bank (PDB). However, high-resolution structure determination of the weak-affinity, highly dynamic and membrane-associated Ras oligomers remains beyond the reach of current techniques. Computational modeling of these complexes is also challenging due to the lack of experimental restraints or even simple geometric attributes such as symmetry. We recently devised an approach that overcame many of these challenges by combining a wide variety of computational and experimental techniques to identify two PPIs (termed i1 and i2) that allowed us to build multiple K-Ras dimer models (Figure 4A).9 Based on these modeled structures and PPIs, we built plausible trimer and tetramer models of membrane-bound K-Ras (Figures 4A,B). To model trimer we first constructed a quasi-C3-symmetric closed complex where all PPIs are buried, and an open-chain complex where one PPI on each of the two peripheral subunits is solvent exposed. As an initial test of viability, each model was simulated for 1 μs in three copies (6 μs total). The open complex was found to be stable during each of the three runs while the closed complex either dissociated or evolved to an open complex. In all of the three stable runs of the open trimer, the overall interface remained intact but pairwise interactions continued to evolve, suggesting that longer simulations will be required to optimize the interfacial interactions. However, the overall topology of the complex converged to that shown in Figure 4. Broadly, the central subunit interacts with one subunit via i1 (essentially via helices h3 and h4) and with another via i2 (h4 and h5 plus the turn β2/β3). The residues involved in the intermonomer interactions are shown in Figure 4C. The ensemble-averaged center of mass distance between subunits 1 and 2 was 36.6 Å while that between subunits 2 and 3 was 33.2 Å, close to the mean intermonomer distance in dimers i1 and i2, respectively.9 The surface areas buried at the interfaces were 1300 and 1450 Å2, which are somewhat smaller than that buried at the dimer interfaces (1600–1800 Å2) but still within the range of stable complexes.41 A key result of the simulations was that they allowed for what would have been an open interface on one of the peripheral subunits to get engaged by the bilayer, resulting in a semiclosed complex (Figure 4B, top). A similar MD analysis suggested that the quasi-C4 tetramer model built from the dimer structures is rather stable (Figure 4A,B,D). Not only did the model remain intact during the entire 1 μs run but also the average intersubunit center of mass distances (32.9–34.8 Å) are essentially the same as in the dimers. The average buried solvent accessible surface area ranged between 1020 and 1250 Å2. As in the trimer, the interfaces are primarily made up of helices h3–h5, essentially different combinations of the same set of residues involved in intermonomer contacts in the dimers (Figure 4D).
Figure 4.

Molecular modeling and EM analysis. (A) Structure of monomeric K-Ras (PDB code 4DSO), previously described dimer models with PPIs i1 and i2 (ref 9), and models of trimer and tetramer built as described in the text and refined by 1 μs MD simulation (this work). Only the catalytic domain is shown with helices 3, 4, and 5 that are involved in the PPIs i1 and i2 highlighted in yellow, green and red-colored rods. (B) The final snapshot of trimeric (top) and tetrameric full-length K-Ras bound to a POPC/POPS bilayer, illustrating the organization of the subunits relative to each other and the bilayer; the lower leaflet of the bilayer where the protein is bound is shown as gray surface. (C, D) Normalized probability of residue contact per monomer during MD simulation of the trimer (C) and tetramer (D) models, with contact defined to exist if any heavy atom of a residue in one monomer is within 4 Å of any heavy atom in another monomer. Notice the significant role of surface residues on helices 3, 4, and 5 (highlighted in yellow, green and red boxes) and the occasional participation of a few residues from the β2/β3 turn (residues 47–50) and switch 2 (residues 60–70). (E, F) EM analysis of PM sheets from BHK cells coexpressing mGFP-tagged K-Ras mutants and mRFP-tagged CRaf labeled with 6 and 2 nm gold-conjugated anti-GFP and anti–RFP antibodies, respectively. Co-clustering of C-Raf with K-Ras was analyzed using bivariate Ripley’s K-function as described previously (ref34). The mutations have minor effect on membrane binding, as shown by the number of gold particles/μm2 (D), while C-Raf coclustering with K-Ras is reduced in cells expressing KE or EK but not CC, as shown by the LBI values representing the area under the Ripley K-function curves (F).
EM Analysis Shows That Interfacial Mutations Modulate Raf Recruitment
Previous studies have shown that K-Ras dimerization and clustering facilitate Raf recruitment and signaling.12,22 This implies that disruption of oligomerization may decrease Raf recruitment and coclustering with K-Ras. We tested this hypothesis by EM spatial mapping. Intact PM sheets from BHK cells coexpressing monomeric EGFP-tagged K-Ras mutants and mRFP-CRaf were colabeled with anti-GFP and anti-RFP antibodies conjugated directly to 6 or 2 nm gold particles, respectively, and the immunogold particle point patterns revealed by EM were analyzed using spatial statistics. The integrated bivariate K-function (LBI), which quantifies the extent of coclustering of the 6 or 2 nm gold particles, showed that while PM binding of KE K-Ras was only slightly affected (Figure 4E), its coclustering with CRaf is significantly reduced (Figure 4F). We obtained the same result from cells expressing E107K mutant K-Ras (EK, which is equivalent to KE in its ability to introduce interfacial charge repulsion since K101 and E107 are engaged in salt bridge interactions9). In contrast, CRaf PM-recruitment and K-Ras coclustering were unaffected in the CC mutant (Figure 4E,F).
Can K-Ras Form Clusters Larger than Tetramer?
EM studies have shown that on average there is 5–8 Ras proteins per cluster12,20,21 but the maximum cluster size we obtained from N&B analysis was 4 (Figure 3). How can these be reconciled? We believe the answer lies in the differences in lateral diffusion coefficients obtained from FRAP or FCS on the one hand and RICS on the other. Namely, species that are immobile in the μs time regime and hence are excluded from our RICS analysis could contribute to and reduce the average D measured by FRAP or FCS. Similarly, since it does not discriminate mobile from immobile species, EM-estimated cluster sizes should be an average of fast-moving, slow-moving and immobile oligomers. The question is if the latter two represent oligomers larger than those captured by RICS (i.e., can K-Ras form clusters larger than 4?). To address this question, we took advantage of the intrinsic geometry of the catalytic domain where helices h3, h4 and h5 are arranged such that they fit into a circular sector with a central angle of 72°. Since 5 such objects complete a circle we reasoned that cyclization of K-Ras into a C5-symmetric homomer would be possible. We constructed such a pentamer model and simulated it for 1 μs in bilayer. The complex remained intact with a time-averaged intersubunit center of mass distance of 34.7–36.2 Å (Figure 5A), within the range measured for the smaller oligomers. The buried interfacial surface area (~920 Å2 per subunit) is somewhat smaller than for the trimer and tetramer (1360 and 1140 Å2, respectively), suggesting a potentially less stable complex. However, a closer look at the intersubunit interactions indicated that the same residues at i1 and i2 that stabilize the smaller complexes are responsible for holding the pentamer together (Figure 5B). In addition, the ~10 nm radius of the pentamer almost precisely matches estimates from EM after accounting for the size of GFP, antibody, gold nanoparticle and nanocluster geometry.21 We therefore perturbed two pentameric interfacial ion pairs E98–K165 and D105–K172 (note: these are different from those in the dimers). Charge reversal mutagenesis (E98K/D105K) did not affect membrane recruitment but reduced nanoclustering by ~40% (Figure 5C). In contrast, swapping the charges so that salt bridge formation would still be possible (E98K/D105K, K165E/K127D) had no effect on either clustering or membrane binding (Figure 5C). Taken together, these results suggest that the EM-derived nanocluster sizes represent averages of diverse oligomers, including complexes of 4 or more molecules that might be temporarily immobilized.
Figure 5.
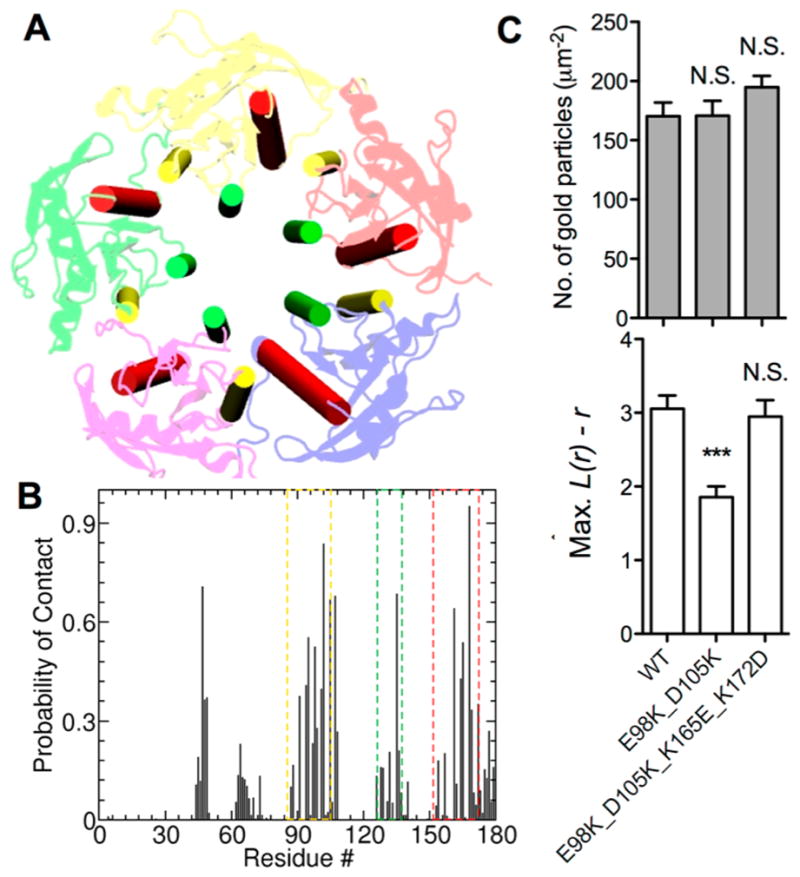
K-Ras can form oligomers larger than tetramer. (A) Structural model of a pentameric K-Ras nanocluster built as described in the text. Shown is the catalytic domain of five monomers arranged into a quasi-C5 symmetric pentamer based on a 1 μs snapshot from a simulation of the complex in a POPC/POPS bilayer. Interfacial helices 3, 4, and 5 are highlighted in yellow, green and red, respectively. (B) Normalized probability of intermonomer residue contacts per subunit during an MD simulation of the pentamer model. Contact was defined to exist if any heavy atom of a residue in one monomer was within 4 Å of any heavy atom of a residue in another monomer. Helices 3 (yellow box), 4 (green) and 5 (red) along with the β2/β3 turn contribute most of the residues involved in pentamer formation, essentially the same residues involved in trimer or tetramer formation (see Figure 4) as well as dimer (ref 9). (C) EM analysis of interfacial ion pairs predicted to stabilize pentamer. Mutation of E98 and D105, which in the pentamer model form a salt bridge with K165 and K175, to K (E98K_D105K) did not affect membrane recruitment as shown by the number of gold particles/μm2 (top) but significantly reduced clustering as measured by L(r) − r (bottom). In contrast, simply swapping the charges of both pairs (E98K_D105K_K165E_K172D) did not affect clustering. Statistical analysis and other details are as in Figure 4.
DISCUSSION
It is becoming increasingly evident that PM-bound K-Ras forms dimers7–9,42 and/or larger clusters.12–14,21,43 However, the population of the different oligomeric states and their mechanism of assembly, including whether dimer is an intermediate en route to higher-order oligomers, have remained undetermined. A major goal of the current work was to address these questions using single-molecule fluorescence spectroscopic and microscopic imaging as well as molecular modeling.
Two Partially Overlapping Interfaces Underlie Diverse K-Ras Oligomers
Our FRAP analysis suggested that PM-bound WT, KE and CC exhibit similar overall dynamics within the resolution limit of the technique. However, we found that KE has a larger mobile fraction (Figure 2A) and a smaller percentage of cells with two distinct diffusivities (see Results). FCS yielded about twice-larger D’s for WT and KE K-Ras but not CC (Figure 2C,D). As in FRAP, measurement of lateral dynamics by FCS does not readily distinguish highly dynamic oligomers from transiently immobilized species. However, our FCS data provided an important additional information: 50% (KE), 58% (WT) and 89% (CC) of the cells we have analyzed yielded G(τ) profiles that are distinct from those of our controls LactC2-PS and mem-EGFP (Figure S2). The FCS data from these cells required a 3-component diffusion model for proper fitting, whereas all of the data for the controls could be fit to a bicomponent diffusion model. That the majority of cells expressing CC gave rise to atypical profiles compared with about half of KE suggests that the two mutants differ in their ability to form slowly diffusing species, which is consistent with our FRAP data. Further analysis with RICS, which captures the dynamics of only the mobile species at higher spatial and temporal resolutions, showed that KE diffuses at a rate similar to LactC2-PS while WT and especially CC are significantly slower (Figure 3B). N&B analysis of the distribution of oligomers provided an important insight into the origin of the differences in lateral dynamics (Figure 3C,D). First, we found that mem-EGFP is 100% monomeric. In contrast, WT K-Ras exists as monomer, dimer and larger oligomers. It is worth noting that the monomer fraction we obtained (38%) is comparable to that from EM (40%).21 KE is predominantly monomeric with a small fraction of dimer, clearly showing that the mutation destabilized the oligomers. In contrast, CC stabilized the dimer and trimer fractions significantly at the expense of the monomer fraction. The functional implication of these observations is highlighted by our EM data showing that interfacial mutations affect effector recruitment (Figure 4E,F). But what is the molecular basis for the diversity of K-Ras oligomers? We previously examined the role of lipidation in Ras clustering14,44–46 and highlighted the challenges of modeling full-length Ras oligomers.47 More recently, we described partially overlapping PPIs i1 and i2 that allow for the formation of multiple K-Ras dimers.9 We now found that simple geometric transformation of these dimers can lead to plausible timer, tetramer and pentamer models that are stable during a μs-long MD run (Figures 4 and 5). Notably, these oligomers are held together by interactions involving the same set of residues at PPIs i1 and i2. That the same PPIs arranged differently stabilize dimers and larger oligomers explains why mutations at i1 or i2 can affect both dimerization and clustering. Conversely, mutations that stabilize any one of the two PPIs, such as our Cys mutations at i1, also increase clustering. Thus, our results define Ras oligomer composition, topology and membrane organization in atomic detail, providing a clearer picture of how dimers and higher-order oligomers could coexist and how two surfaces could variously combine to assemble oligomers of diverse sizes and architectures.
Proposed Mechanism of K-Ras Oligomerization on the PM
Our modeling suggests that K-Ras complexes on the PM include dimers and quasi-D2- or -C-symmetric larger oligomers. These locally asymmetric larger oligomers differed from the dimers in terms of intermonomer residue pairs. Considering further that C-symmetry is most common in oligomers and that we have identical subunits, we propose that cyclization48 wherein monomers directly assemble into dimers or larger clusters is the likely mechanism for Ras self-assembly. This is consistent with our RICS/N&B data that show the coexistence of diverse oligomeric states. Alternative mechanisms such as hierachial growth or covalent dimerization via nonspecific photooxidation of tyrosine residues, as observed for H-Ras in a suppported bilayer,49 could not be ruled out but appear less likely. As already noted, considerations of symmetry and the requirement that Ras assembly occurs on the membrane plane would make hierarchical growth of oligomers less likely. Covalent dimerization does not explain the differences we observe in the oligomerization profile of WT, KE and CC K-Ras in live cells; and dimers were observed in cells expressing CC and WT K-Ras in the absence of a radiation source.9 Combining these with the crucial role of the lipid anchor8,14 and PM components such as cholesterol and PS,20,34 we propose that Ras oligomerization is initially driven by protein–protein interactions and then modulated by lipid sorting. Proximity of protomers due to the former brings the lipid anchors closer together, which triggers redistribution of membrane components. This has profound implications for Ras biology because different Ras proteins that may initially cocluster driven by homologous protein–protein interactions will be segregated in the second step due to their distinct HVR lipids. The PM is thus an active participant in Ras self-assembly and not just a framework to increase local concentration. We believe this mechanism applies not only to the consitituvely G12V but also to wild type K-Ras and other Ras isoforms, but there can be potential differences in the distribution of monomer, dimer/trimer and higher order organization due to GDP/GTP exchange or nucleotide dependent membrane binding.50–53 We then wondered about the implication of oligomerization on the dynamic reorientation of the catalytic domain with respect to the membrane plane.52,54,55 Inspection of our membrane-bound oligomer models yielded a surprising insight. In the i1 dimer (Figure 3 in ref 9) and tetramer (Figure 4B) models, helices h3–5 are roughly perpendicular to the membrane plane so that the catalytic domain stays in water. In contrast, one of the catalytic domains in dimer i2 (Figure 3 in ref 9) and the trimer (Figure 4B) interact with the bilayer. This means that catalytic domain-membrane interaction is possible both in monomeric and oligomeric K-Ras, with the specific orientation likely dictated by the nature of the oligomerization. Thus, the built-in flexibility of weak PPIs allows K-Ras to sample different membrane orientation and oligomerization states without significant energetic cost. Both of these are likely modulated by various factors including activation status, mutation and membrane composition.
Functional Significance and Other Potential Effects of K-Ras Interface Mutations
Our comparative analyses of the constitutively active G12V K-Ras with and without mutations at positions 101 and 107 showed that residues at a few reactive surface patches could pair-up differently to yield diverse oligomeric states. What other possible effects could these mutations have? Several possibilities come to mind. First, loop 7 (residues 107–110) is involved in an allosteric communication with the catalytic site,56,57 which could be affected by a mutation at E101 or K107. However, we believe this will now result in a measurably altered lateral dynamics on the PM because the effect on molecular weight is likely small. Second, K101 and E107 are near K104, a site of acetylation and ubiquitination.58,59 It is unclear what fraction of cellular K-Ras is acetylated or ubiquitinated, or whether K-Ras self-assembly is impacted by or affects posttranslational modification. We speculate that, due to steric reasons, only the monomeric pool of K-Ras is subjected to acetylation or ubiquitination. If so, WT and KE K-Ras, which contain a substantial monomer pool, would be acetylated or ubiquitinated while CC may not. It is also possible that acetylation and ubiquitination alter the lateral diffusion of K-Ras, or that K101E and E107K mutations affect interaction with the enzymes that modify K-Ras at K104. The latter assumes that the same PPI of K-Ras studied in this work is also involved in interaction with ubiquitin ligases and acetyl-transferases. These and other possible effects of the mutations (for example on trafficking or membrane morphology) require further investigation.
Our EM analysis shows that mutations K101E and E107K affect coclustering of K-Ras with CRaf while K101C/E107C does not (Figure 4F). Moreover, initial experiments suggest that K101C/E107C slightly impairs K-Ras signaling as measured by phosphorylation levels of ERK and AKT (data not shown). Considering the functional role of nanoclusters (e.g., ref 22), an intriguing implication of these observations is that weak interactions and flexibility may be critical for enhanced Ras signaling via nanoclusters. The weak interactions through the Ras interfaces would allow the fluidity necessary for conformational adaptations associated with signaling in the presence of effector proteins. This would be consistent with the fact that no oncogenic i1 or i2 mutation that enhances self-association has been discovered thus far. The potential link—either directly or through allosteric effects—between cancer mutations and K-Ras self-assembly, and their role in the relative distribution of monomers and oligomers, remain open questions.
CONCLUSION
Previous studies have shown that clustering is essential for high fidelity Ras signaling, but very little has been known about the structure and mechanism of assembly of K-Ras oligomers. Also unclear was the relative population of dimers and larger oligomers or if dimer is an (obligate) intermediate step in higher-order oligomer formation. The current work addressed these issues using live cell single molecule spectroscopic analyses complemented by EM and molecular modeling. Using the constitutively active G12V K-Ras (WT) and its variants K101E (KE) and K101C/E107C (CC) that respectively destabilize and stabilize oligomers, we have demonstrated the coexistence of K-Ras in diverse oligomeric states. Specifically, the mobile fraction of WT K-Ras includes monomer, dimer and trimer, whereas KE is mostly monomeric and CC is dominated by oligomers. In addition, modeling and molecular simulation suggest that two previously described partially overlapping interfaces are sufficient for K-Ras to form diverse oligomers, including mobile dimer, trimer and tetramer as well as less mobile larger oligomers. These results provide the first detailed insight into K-Ras oligomer formation, composition, topology and membrane organization with important implications for therapeutic interventions.
Supplementary Material
Acknowledgments
We thank Dr Yong Zhou for illuminating discussions and the Texas Advanced Computing Center (TACC) and the Extreme Science and Engineering Discovery Environment (XSEDE Project: MCB150054) for computational resources. This work was supported in part by the National Institutes of Health General Medical Sciences (Grant No. R01GM100078 to AAG and R00CA188593 to KJC) and the Cancer Prevention and Research Institute of Texas (CPRIT grant No. DP150093 to AAG and RP170233 to JFH). MNW would like to acknowledge a generous endowment from the William Wheless III Professorship. Spectroscopic experiments were performed at the Center for Advanced Microscopy at the Department of Integrative Biology & Pharmacology of the McGovern Medical School, UTHealth.
Footnotes
Notes
The authors declare no competing financial interest.
The Supporting Information is available free of charge on the ACS Publications website at DOI: 10.1021/jacs.7b06292.
Details of FCS and RICS/N&B data analyses; supporting table of diffusion coefficients (PDF)
References
- 1.Barbacid M. Annu Rev Biochem. 1987;56:779. doi: 10.1146/annurev.bi.56.070187.004023. [DOI] [PubMed] [Google Scholar]
- 2.Cox AD, Der CJ. Small GTPases. 2010;1:2. doi: 10.4161/sgtp.1.1.12178. [DOI] [PMC free article] [PubMed] [Google Scholar]
- 3.Vetter IR, Wittinghofer A. Science. 2001;294:1299. doi: 10.1126/science.1062023. [DOI] [PubMed] [Google Scholar]
- 4.Prakash P, Gorfe AA. Biochim Biophys Acta, Gen Subj. 2013;1830:5211. doi: 10.1016/j.bbagen.2013.07.024. [DOI] [PMC free article] [PubMed] [Google Scholar]
- 5.Prior IA, Lewis PD, Mattos C. Cancer Res. 2012;72:2457. doi: 10.1158/0008-5472.CAN-11-2612. [DOI] [PMC free article] [PubMed] [Google Scholar]
- 6.Hancock JF, Magee AI, Childs JE, Marshall CJ. Cell. 1989;57:1167. doi: 10.1016/0092-8674(89)90054-8. [DOI] [PubMed] [Google Scholar]
- 7.Guldenhaupt J, Rudack T, Bachler P, Mann D, Triola G, Waldmann H, Kotting C, Gerwert K. Biophys J. 2012;103:1585. doi: 10.1016/j.bpj.2012.08.043. [DOI] [PMC free article] [PubMed] [Google Scholar]
- 8.Nan X, Tamguney TM, Collisson EA, Lin LJ, Pitt C, Galeas J, Lewis S, Gray JW, McCormick F, Chu S. Proc Natl Acad Sci U S A. 2015;112:7996. doi: 10.1073/pnas.1509123112. [DOI] [PMC free article] [PubMed] [Google Scholar]
- 9.Prakash P, Sayyed-Ahmad A, Cho KJ, Dolino DM, Chen W, Li H, Grant BJ, Hancock JF, Gorfe AA. Sci Rep. 2017;7:40109. doi: 10.1038/srep40109. [DOI] [PMC free article] [PubMed] [Google Scholar]
- 10.Muratcioglu S, Chavan TS, Freed BC, Jang H, Khavrutskii L, Freed RN, Dyba MA, Stefanisko K, Tarasov SG, Gursoy A, Keskin O, Tarasova NI, Gaponenko V, Nussinov R. Structure. 2015;23:1325. doi: 10.1016/j.str.2015.04.019. [DOI] [PMC free article] [PubMed] [Google Scholar]
- 11.Plowman SJ, Hancock JF. Biochim Biophys Acta, Mol Cell Res. 2005;1746:274. doi: 10.1016/j.bbamcr.2005.06.004. [DOI] [PubMed] [Google Scholar]
- 12.Abankwa D, Gorfe AA, Hancock JF. Semin Cell Dev Biol. 2007;18:599. doi: 10.1016/j.semcdb.2007.08.003. [DOI] [PMC free article] [PubMed] [Google Scholar]
- 13.Abankwa D, Gorfe AA, Inder K, Hancock JF. Proc Natl Acad Sci U S A. 2010;107:1130. doi: 10.1073/pnas.0903907107. [DOI] [PMC free article] [PubMed] [Google Scholar]
- 14.Janosi L, Li Z, Hancock JF, Gorfe AA. Proc Natl Acad Sci U S A. 2012;109:8097. doi: 10.1073/pnas.1200773109. [DOI] [PMC free article] [PubMed] [Google Scholar]
- 15.Parton RG, Hancock JF. Methods Enzymol. 2001;33:3172. doi: 10.1016/s0076-6879(01)33055-0. [DOI] [PubMed] [Google Scholar]
- 16.Prior IA, Muncke C, Parton RG, Hancock JF. J Cell Biol. 2003;160:165. doi: 10.1083/jcb.200209091. [DOI] [PMC free article] [PubMed] [Google Scholar]
- 17.Kusumi A, Koyama-Honda I, Suzuki K. Traffic. 2004;5:213. doi: 10.1111/j.1600-0854.2004.0178.x. [DOI] [PubMed] [Google Scholar]
- 18.Nicolau DV, Jr, Burrage K, Parton RG, Hancock JF. Mol Cell Biol. 2006;26:313. doi: 10.1128/MCB.26.1.313-323.2006. [DOI] [PMC free article] [PubMed] [Google Scholar]
- 19.Garcia-Parajo MF, Cambi A, Torreno-Pina JA, Thompson N, Jacobson K. J Cell Sci. 2014;127:4995. doi: 10.1242/jcs.146340. [DOI] [PMC free article] [PubMed] [Google Scholar]
- 20.Zhou Y, Hancock JF. Biochim Biophys Acta, Mol Cell Res. 2015;1853:841. doi: 10.1016/j.bbamcr.2014.09.008. [DOI] [PubMed] [Google Scholar]
- 21.Plowman SJ, Muncke C, Parton RG, Hancock JF. Proc Natl Acad Sci U S A. 2005;102:15500. doi: 10.1073/pnas.0504114102. [DOI] [PMC free article] [PubMed] [Google Scholar]
- 22.Tian T, Harding A, Inder K, Plowman S, Parton RG, Hancock JF. Nat Cell Biol. 2007;9:905. doi: 10.1038/ncb1615. [DOI] [PubMed] [Google Scholar]
- 23.Okada A, Lansford R, Weimann JM, Fraser SE, McConnell SK. Exp Neurol. 1999;156:394. doi: 10.1006/exnr.1999.7033. [DOI] [PubMed] [Google Scholar]
- 24.Goodwin JS, Kenworthy AK. Methods. 2005;37:154. doi: 10.1016/j.ymeth.2005.05.013. [DOI] [PubMed] [Google Scholar]
- 25.Ellenberg J, Lippincott-Schwartz J, Presley JF. Biotechniques. 1998;25:838. doi: 10.2144/98255bt01. [DOI] [PubMed] [Google Scholar]
- 26.Heinemann F, Vogel SK, Schwille P. Biophys J. 2013;104:1465. doi: 10.1016/j.bpj.2013.02.042. [DOI] [PMC free article] [PubMed] [Google Scholar]
- 27.Briddon SJ, Middleton RJ, Cordeaux Y, Flavin FM, Weinstein JA, George MW, Kellam B, Hill SJ. Proc Natl Acad Sci U S A. 2004;101:4673. doi: 10.1073/pnas.0400420101. [DOI] [PMC free article] [PubMed] [Google Scholar]
- 28.Kilpatrick LE, Briddon SJ, Holliday ND. Biochim Biophys Acta, Mol Cell Res. 2012;1823:1068. doi: 10.1016/j.bbamcr.2012.03.002. [DOI] [PMC free article] [PubMed] [Google Scholar]
- 29.Wong K, Briddon SJ, Holliday ND, Kerr ID. Biochim Biophys Acta, Mol Cell Res. 2016;1863:19. doi: 10.1016/j.bbamcr.2015.10.002. [DOI] [PubMed] [Google Scholar]
- 30.Digman MA, Dalal R, Horwitz AF, Gratton E. Biophys J. 2008;94:2320. doi: 10.1529/biophysj.107.114645. [DOI] [PMC free article] [PubMed] [Google Scholar]
- 31.Digman MA, Brown CM, Sengupta P, Wiseman PW, Horwitz AR, Gratton E. Biophys J. 2005;89:1317. doi: 10.1529/biophysj.105.062836. [DOI] [PMC free article] [PubMed] [Google Scholar]
- 32.Sanabria H, Digman MA, Gratton E, Waxham MN. Biophys J. 2008;95:6002. doi: 10.1529/biophysj.108.138974. [DOI] [PMC free article] [PubMed] [Google Scholar]
- 33.Ossato G, Digman MA, Aiken C, Lukacsovich T, Marsh JL, Gratton E. Biophys J. 2010;98:3078. doi: 10.1016/j.bpj.2010.02.058. [DOI] [PMC free article] [PubMed] [Google Scholar]
- 34.Zhou Y, Prakash P, Liang H, Cho KJ, Gorfe AA, Hancock JF. Cell. 2017;168:239. doi: 10.1016/j.cell.2016.11.059. [DOI] [PMC free article] [PubMed] [Google Scholar]
- 35.Murakoshi H, Iino R, Kobayashi T, Fujiwara T, Ohshima C, Yoshimura A, Kusumi A. Proc Natl Acad Sci U S A. 2004;101:7317. doi: 10.1073/pnas.0401354101. [DOI] [PMC free article] [PubMed] [Google Scholar]
- 36.Goodwin JS, Drake KR, Remmert CL, Kenworthy AK. Biophys J. 2005;89:1398. doi: 10.1529/biophysj.104.055640. [DOI] [PMC free article] [PubMed] [Google Scholar]
- 37.Kenworthy AK, Nichols BJ, Remmert CL, Hendrix GM, Kumar M, Zimmerberg J, Lippincott-Schwartz J. J Cell Biol. 2004;165:735. doi: 10.1083/jcb.200312170. [DOI] [PMC free article] [PubMed] [Google Scholar]
- 38.Kay JG, Koivusalo M, Ma X, Wohland T, Grinstein S. Mol Biol Cell. 2012;23:2198. doi: 10.1091/mbc.E11-11-0936. [DOI] [PMC free article] [PubMed] [Google Scholar]
- 39.Digman MA, Stakic M, Gratton E. Methods Enzymol. 2013;518:121. doi: 10.1016/B978-0-12-388422-0.00006-6. [DOI] [PubMed] [Google Scholar]
- 40.Chen Y, Muller JD, Ruan Q, Gratton E. Biophys J. 2002;82:133. doi: 10.1016/S0006-3495(02)75380-0. [DOI] [PMC free article] [PubMed] [Google Scholar]
- 41.Lo Conte L, Chothia C, Janin J. J Mol Biol. 1999;285:2177. doi: 10.1006/jmbi.1998.2439. [DOI] [PubMed] [Google Scholar]
- 42.Inouye K, Mizutani S, Koide H, Kaziro Y. J Biol Chem. 2000;275:3737. doi: 10.1074/jbc.275.6.3737. [DOI] [PubMed] [Google Scholar]
- 43.Hancock JF. Nat Rev Mol Cell Biol. 2006;7:456. doi: 10.1038/nrm1925. [DOI] [PMC free article] [PubMed] [Google Scholar]
- 44.Li Z, Janosi L, Gorfe AA. J Am Chem Soc. 2012;134:17278. doi: 10.1021/ja307716z. [DOI] [PMC free article] [PubMed] [Google Scholar]
- 45.Li H, Gorfe AA. J Phys Chem Lett. 2014;5:1457. doi: 10.1021/jz500451a. [DOI] [PMC free article] [PubMed] [Google Scholar]
- 46.Lin X, Li Z, Gorfe AA. Biophys J. 2015;109:2467. doi: 10.1016/j.bpj.2015.11.009. [DOI] [PMC free article] [PubMed] [Google Scholar]
- 47.Li H, Gorfe AA. PLoS One. 2013;8:e71018. doi: 10.1371/journal.pone.0071018. [DOI] [PMC free article] [PubMed] [Google Scholar]
- 48.Ahnert SE, Marsh JA, Hernandez H, Robinson CV, Teichmann SA. Science. 2015;350:aaa2245. doi: 10.1126/science.aaa2245. [DOI] [PubMed] [Google Scholar]
- 49.Chung JK, Lee YK, Lam HY, Groves JT. J Am Chem Soc. 2016;138:1800. doi: 10.1021/jacs.5b12648. [DOI] [PMC free article] [PubMed] [Google Scholar]
- 50.Gorfe AA, Hanzal-Bayer M, Abankwa D, Hancock JF, McCammon JA. J Med Chem. 2007;50:674. doi: 10.1021/jm061053f. [DOI] [PubMed] [Google Scholar]
- 51.Gohlke A, Triola G, Waldmann H, Winter R. Biophys J. 2010;98:2226. doi: 10.1016/j.bpj.2010.02.005. [DOI] [PMC free article] [PubMed] [Google Scholar]
- 52.Mazhab-Jafari MT, Marshall CB, Smith MJ, Gasmi-Seabrook GM, Stathopulos PB, Inagaki F, Kay LE, Neel BG, Ikura M. Proc Natl Acad Sci U S A. 2015;112:6625. doi: 10.1073/pnas.1419895112. [DOI] [PMC free article] [PubMed] [Google Scholar]
- 53.Li ZL, Buck M. Structure. 2017;25:679. doi: 10.1016/j.str.2017.02.007. [DOI] [PMC free article] [PubMed] [Google Scholar]
- 54.Prakash P, Zhou Y, Liang H, Hancock JF, Gorfe AA. Biophys J. 2016;110:1125. doi: 10.1016/j.bpj.2016.01.019. [DOI] [PMC free article] [PubMed] [Google Scholar]
- 55.Li Z, Cao S, Buck M. Biophys J. 2016;110:1033. doi: 10.1016/j.bpj.2016.01.020. [DOI] [PMC free article] [PubMed] [Google Scholar]
- 56.Buhrman G, Holzapfel G, Fetics S, Mattos C. Proc Natl Acad Sci U S A. 2010;107:4931. doi: 10.1073/pnas.0912226107. [DOI] [PMC free article] [PubMed] [Google Scholar]
- 57.Prakash P, Sayyed-Ahmad A, Gorfe AA. PLoS Comput Biol. 2012;8:e1002394. doi: 10.1371/journal.pcbi.1002394. [DOI] [PMC free article] [PubMed] [Google Scholar]
- 58.Sasaki AT, Carracedo A, Locasale JW, Anastasiou D, Takeuchi K, Kahoud ER, Haviv S, Asara JM, Pandolfi PP, Cantley LC. Sci Signaling. 2011;4:ra13. doi: 10.1126/scisignal.2001518. [DOI] [PMC free article] [PubMed] [Google Scholar]
- 59.Yang MH, Nickerson S, Kim ET, Liot C, Laurent G, Spang R, Philips MR, Shan Y, Shaw DE, Bar-Sagi D, Haigis MC, Haigis KM. Proc Natl Acad Sci U S A. 2012;109:10843. doi: 10.1073/pnas.1201487109. [DOI] [PMC free article] [PubMed] [Google Scholar]
Associated Data
This section collects any data citations, data availability statements, or supplementary materials included in this article.