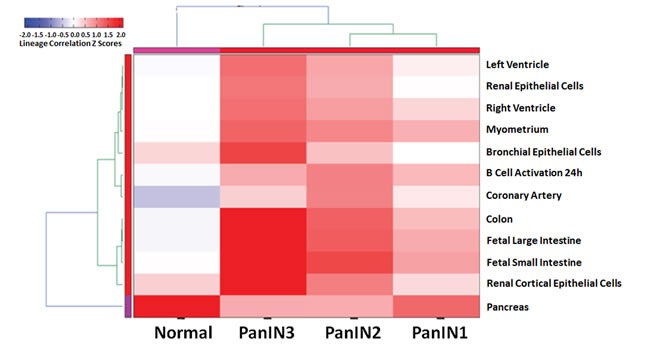
Figure 2. Global alternative splicing in PanINs.

Heirarchical heatmap clustering of similarity to tissue-based profiles of alternative splicing. Isoform expression in PanINs and normal ducts was compared to a curated database of isoform expression profiles in different tissues. The 12 profiles included in the heatmap are those that most strongly correlated with the PanIN and normal pancreatic duct samples. Normal pancreatic duct samples correlated strongly and almost exclusively with the normal pancreas profile. PanIN-2 and PanIN-3 samples were less related to the normal pancreas profile than PanIN-1 samples and more similar to other tissues (colon, fetal large intestine, and fetal small intestine).
