Abstract
Incorporating different data processing methods, optical coherence tomography (OCT) has the ability for high-resolution angiography and quantitative flow velocity measurements. However, OCT angiography cannot provide quantitative information of flow velocities, and the velocity measurement based on Doppler OCT requires the determination of Doppler angles, which is a challenge in a complex vascular network. In this study, we report on a relative standard deviation OCT (RSD-OCT) method which provides both vascular network mapping and quantitative information for flow velocities within a wide range of Doppler angles. The RSD values are angle-insensitive within a wide range of angles, and a nearly linear relationship was found between the RSD values and the flow velocities. The RSD-OCT measurement in a rat cortex shows that it can quantify the blood flow velocities as well as map the vascular network in vivo.
Doppler optical coherence tomography (OCT) and OCT angiography have been used widely to quantify flow and map microvascular networks in biological research and clinical diagnosis, such as cerebral flow imaging,1–4 ophthalmic imaging,5 and tumor microvascular imaging.6 In OCT angiography, the microvascular network can be mapped using Doppler variance,7–9 speckle variance,10 speckle decorrelation,11 optical micro-angiography,12 and intensity-based subtraction.13 OCT angiography can provide the distribution of blood flow; however, it lacks information on quantitative flow velocities. Doppler OCT, combining the Doppler principle with OCT, has been used for the quantitative velocity measurement of blood flow.14–18 However, the velocity measurement based on Doppler OCT requires the calculation of Doppler angles (angle between the blood vessel and the OCT beam). It is a challenge to determine Doppler angles in a complex network of a large number of vessels. Without Doppler angles, only the velocity component along the OCT beam can be quantified and mapped. Incorporating the factors of the flow velocity and the blood diameter, the flow rate can be calculated by the measurement of the velocity component along the OCT beam direction and the vessel's cross-sectional area perpendicular to the OCT beam without the explicit information of the Doppler angle.19 However, when the vessel axial direction is almost perpendicular to the OCT beam, both the cross-sectional area and the Doppler phase change cannot be measured accurately, which results in large uncertainty in the measurement of the flow rate. Doppler variance methods have been developed for the vascular mapping and quantification of the flow velocities with a pre-determined calibration when the OCT beam is nearly perpendicular to the flow direction.7,8,20 It was demonstrated that when the angular deviation from perpendicular incidence is less than 12°, Doppler variances are insensitive to Doppler angles.20 However, for complex vascular networks, the angular distribution may not be limited to this small range. For vascular imaging, an ideal imaging method should be able to provide both vascular network mapping and quantitative information of flow velocities within a wide range of Doppler angles.
In this study, we report on a relative standard deviation OCT (RSD-OCT) method for both microvascular network mapping and quantitative flow velocity measurements, which does not require the explicit calculation of Doppler angles. From flow phantom validation, it is found that the RSD values are angle-insensitive within a wide range of Doppler angles and have a nearly linear relationship with the flow velocities until saturation. After a pre-determined calibration, the RSD-OCT method can quantify the flow velocity in vivo. Comparison of the cerebral blood flow measurements in a rat cortex using RSD-OCT and Doppler OCT shows that RSD-OCT can quantify the blood flow velocities and map the microvascular network in vivo without the predetermination of Doppler angles.
Based on the analysis of the speckle pattern, temporal normalized variance of speckle amplitudes at a given point within a time window mainly depends on the scatterer displacement vector and the beam width along the direction of , which can be approximately modeled by a Gaussian function21–23
| (1) |
When the magnitude of is equal to zero, that is, there is no scatterer displacement, the variance will be zero. When the magnitude of is large enough compared to the magnitude of , will be close to one. When is equal to , will be equal to . Considering the Brownian motion and scattering properties of the scattering medium, can be described by the following equation:
| (2) |
will be equal to when is equal to zero and be equal to when is much larger than . The factors and are mainly related to the Brownian motion and scattering properties. As scatterer displacement vector can be determined by the product of the fluid velocity and sampling time interval , can be described by the following equation:
| (3) |
The beam width incorporates axial and lateral components, which can be assessed by the axial and lateral resolutions in the OCT system. When the lateral resolution is close to the axial resolution, the beam width is not sensitive to the angles over a broad range of orientations. Therefore, mainly depends on the velocities and sampling time intervals for a specific scattering medium. The normalized variance in the time domain at one location can be evaluated as the relative standard deviation by the following equation:
| (4) |
where , , and are the relative standard deviation, standard deviation, and the average of the amplitudes from the A-lines of to at the B-scan of and the depth of , respectively. is the amplitude at the A-line of , the B-scan of , and the depth of , and represents the window for the RSD calculation. The A-lines of to can be regarded to be captured at the same lateral location when the A-line number is high enough in a small range of the B-scan. From Eq. (4), the accurate relationship between RSD values and flow velocities is an exponential term. However, when the RSD values are relatively low compared to the saturated values, there is a nearly linear range between RSD values and the fluid velocities.
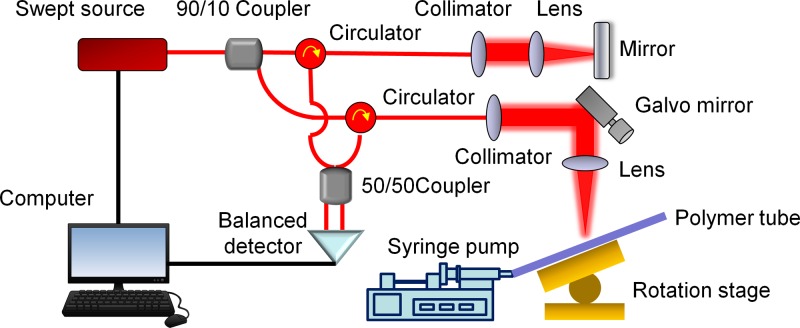
We used a swept source OCT system for flow velocity measurements, which is shown in Fig. 1. A swept source with a central wavelength of 1310 nm and an A-line speed of 50 kHz was used in the OCT system. The structure of the OCT system is similar to that in our previous studies.24,25 The axial and lateral resolutions were 14.6 μm and 17.5 μm near the focus, respectively, and so, the lateral resolution was close to the axial resolution. In order to validate our measurement, a syringe pump was used to infuse fluid into a polymer tube with an inner diameter of 1.0 mm. The polymer tube was fixed on a rotation stage for the adjustment of the Doppler angle between the flow direction and the OCT beam direction. One hundred repeats of B-scan imaging were captured for measurements of the accurate flow velocities.
FIG. 1.
Schematic of a RSD-OCT system. The OCT system uses a swept source with a central wavelength of 1310 nm and an A-line speed of 50 kHz.
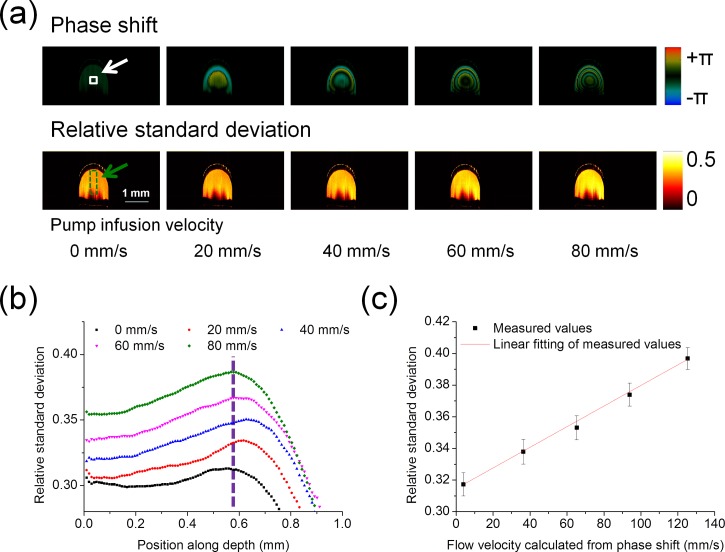
A flow phantom was used to validate RSD measurements. With different velocities of 6% intralipid solution infused by the syringe pump at different angles, the correlation between the RSD values and flow velocities were analyzed and the angle-insensitivity of RSD values was evaluated. Since it is difficult to simulate the flow from a theoretical perspective due to the absence of some parameters, such as the accurate pump infusion velocities and properties of the polymer tube wall, the flow velocities were determined by the OCT Doppler phase shift measurements based on the Doppler principle. The Doppler phase shift measurement has been a reliable and effective method to measure the flow when the flow direction is not nearly perpendicular to the beam direction.14 Briefly, the phase shift is used to calculate the velocity by the equation , where is the vacuum center wavelength of the light source, is the refractive index, is the Doppler angle, is the phase shift between A-lines measured from OCT data, and is the time interval between A-lines. The parameters of and are 1310 nm and 1.4, respectively. Phase wrapping is corrected for the calculation of the accurate phase shift. The accuracy of Doppler phase shift measurements to determine flow velocity mainly depends on the angle determination. When angles are close to 90°, small errors of angle measurements will result in significant differences in the flow velocities. However, when the angle is far away from 90°, the errors of flow velocity measurements caused by the angular uncertainty are small. Therefore, the relationship between RSD values and flow velocities was analyzed with the Doppler angle of 120° controlled by the rotation stage. The window for RSD measurements was 5, and the A-line time interval between adjacent A-lines was 0.02 ms. Figure 2(a) shows the phase shift images and RSD images where the infusion velocities of the syringe pump were set to 0 mm/s, 20 mm/s, 40 mm/s, 60 mm/s, and 80 mm/s. The infusion velocities of the syringe pump were average velocities controlled by the syringe pump. In the theoretical forms of the velocity profiles, the maximum velocities were located in the central region of the tube and velocities decreased from the central region to the wall of the tube. The Doppler phase shift images showed similar distributions. The depth-resolved RSD profiles measured in the green dashed region indicated in Fig. 2(a) are shown in Fig. 2(b). The RSD values increased from the upper edge of the tube and reached a maximum in the central region of the tube, which accords with flow distribution in a tube. Then, the RSD values decreased rapidly as the depth increased due to the decrease in flow velocities and the attenuation of OCT signals. Linear fitting between the RSD value and the flow velocity was analyzed. The RSD values were obtained, and flow velocities were calculated from the central region of the tube, which was indicated by the white solid box in Fig. 2(a) and the vertical dashed line in Fig. 2(b). The local flow velocities calculated by the Doppler phase shifts were 3.8 mm/s, 36.4 mm/s, 65.2 mm/s, 93.9 mm/s, and 125.4 mm/s in the central region, when the infusion velocities of the syringe pump were set to 0 mm/s, 20 mm/s, 40 mm/s, 60 mm/s, and 80 mm/s. The central region of the tube was selected so that the measured velocities could cover the widest range. From Fig. 2(c), it is found that the RSD value increased with the increase in the flow velocity and the correlation coefficient was larger than 0.99 when RSD values were in the range of 0.32–0.40. The RSD value had a nearly linear relationship with the flow velocity at this Doppler angle.
FIG. 2.
Measurements of RSD values in intralipid solution with a Doppler angle of 120°. (a) Phase shift images and RSD images during the increase of infusion velocities. (b) Depth-resolved RSD profile in the green dashed region shown in (a): the velocities reach the maximum in the central region of the tube. (c) Linear fitting between the RSD value and the flow velocity: the RSD values are obtained from the central region of the tube, which are indicated by the white solid box in (a) and the dashed line in (b). When the pump infusion velocities were 0, 20, 40, 60, and 80 mm/s, the local velocities calculated by the phase shifts were 3.8 mm/s, 36.4 mm/s, 65.2 mm/s, 93.9 mm/s, and 125.4 mm/s in the central region. Error bars represent the standard deviations of RSD values from 100 replications.
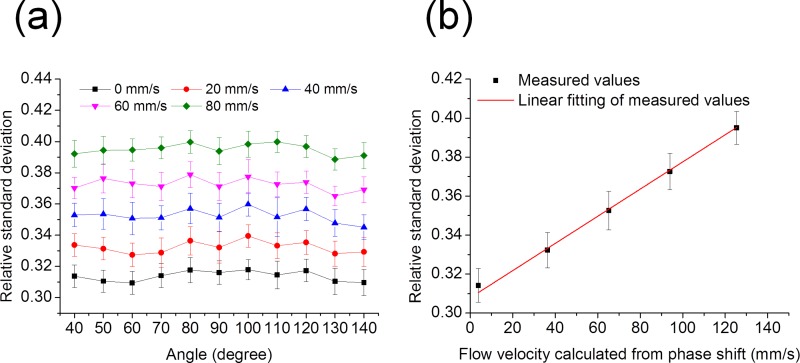
In order to validate the angle-insensitivity of RSD values, the RSD values were measured when the Doppler angle changed from 40° to 140° covering the normal range in angiography. When the intralipid solution was infused with the same flow velocity, the RSD values did not change with the different Doppler angles, which is shown in Fig. 3(a). From Fig. 3(b), it is found that the RSD value increases when the infusion velocity increases and has a nearly linear relationship with the flow velocity. The RSD value is dependent on the flow velocity and insensitive to the Doppler angle within this range.
FIG. 3.
RSD values measured at different angles between the tube and the OCT beam. (a) The RSD values with the changes in pump infusion velocities and the angles. Error bars represent the standard deviations of RSD values from 100 replications. (b) Linear fitting between the RSD value and the local flow velocity in the central region. The error bars are calculated from the 1100 measurements, including 100 replications at each of 11 different angles.
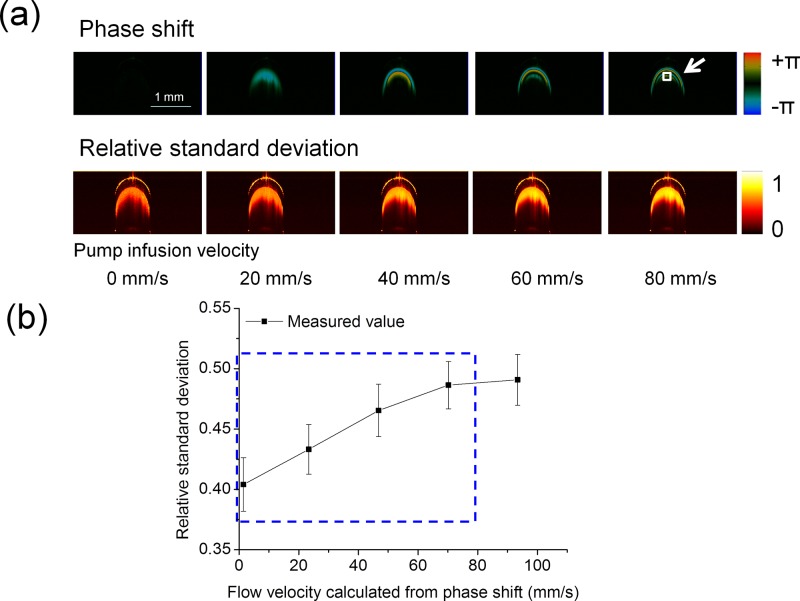
After validating the RSD-OCT system using the intralipid flow phantom, we applied it for microvascular network mapping and quantitative flow velocity measurements in a rat brain cortex. As the optical properties of the intralipid solution are much different from those of rat whole blood, we calibrated the RSD-OCT system using rat whole blood before the in vivo imaging, which is shown in Fig. 4. With a Doppler angle of 120° controlled by the rotation stage, phase shift images and RSD images are shown in Fig. 4(a). When the infusion velocities of the syringe pump were set to 0 mm/s, 20 mm/s, 40 mm/s, 60 mm/s, and 80 mm/s, the local velocities measured based on the Doppler phase shifts were 1.5 mm/s, 23.4 mm/s, 46.8 mm/s, 70.2 mm/s, and 93.4 mm/s in the region indicated by the white solid box in Fig. 4(a). Due to the high scattering of the blood samples, the central region of the tube cannot be imaged clearly, and so, we selected a region close to the central region of the tube. From Fig. 4(b), it is found that the RSD value increases with the increase in the flow velocity in the indicated region. After the RSD value increases to about 0.49, it will not change significantly with the increase in the flow velocity and reach a plateau stage. A fully developed OCT speckle pattern follows a Rayleigh-distribution, and so, the theoretical maximum RSD value is 0.52.26,27 When the RSD values without saturation [blue rectangular region in Fig. 4(b)] are analyzed, the relationship between the RSD value and the flow velocity is approximately simplified to the linear equation . Factor is 61/mm, factor is 0.4, and the correlation coefficient is 0.99 using linear regression analysis for the OCT system and the rat whole blood sample when RSD values are in the range of 0.40–0.49.
FIG. 4.
Calibration of the RSD-OCT system using rat whole blood. (a) Phase shift images and RSD images during the increase of infusion velocities at a Doppler angle of 120°. (b) Relationship between the RSD value and the flow velocity in the region indicated by the white solid box in (a): the RSD value increases with increase in the flow velocity until RSD saturation. When the pump infusion velocities were 0, 20, 40, 60, and 80 mm/s, the local velocities calculated by the phase shifts were 1.5 mm/s, 23.4 mm/s, 46.8 mm/s, 70.2 mm/s, and 93.4 mm/s in the indicated region. Error bars represent the standard deviations of RSD values from 100 replications.
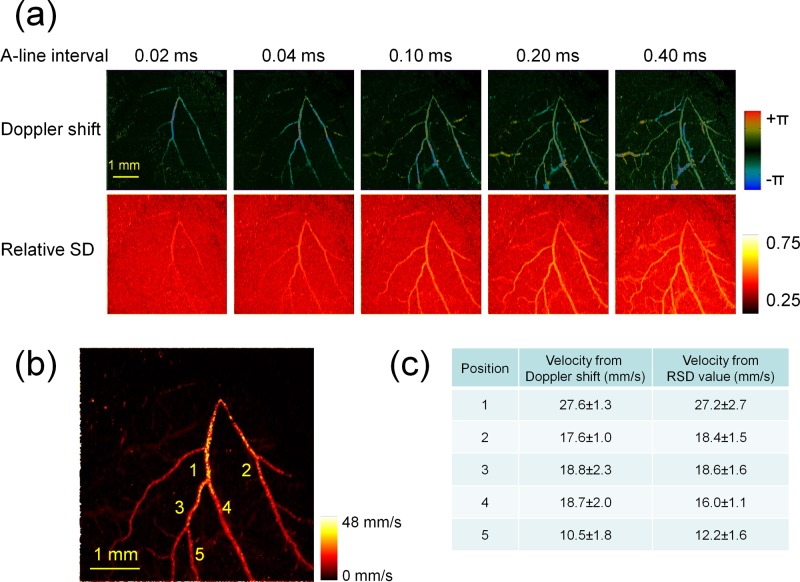
After calibration using rat whole blood, a rat brain cortex was imaged using the RSD-OCT system, as shown in Fig. 5. Soft tissues were removed, and the skull was thinned over the left primary somatosensory cortex. Different A-line intervals were applied to detect velocities in a wider range. The increase in will result in the increase in the RSD value until the RSD value reaches saturation. The maximum intensity projections (MIPs) of the Doppler shift and the RSD value are shown in Fig. 5(a). With a shorter A-line interval, the faster velocity can be calculated from the phase shifts and RSD values; however, the slower velocity cannot be detected. With the increase in the A-line interval, slower velocities become detectable; however, the phase shift wraps and RSD values become saturated for faster velocities.
FIG. 5.
Rat brain cortex imaging using the RSD-OCT system. (a) Maximum intensity projections of Doppler shift images and RSD images in a rat brain cortex: different A-line intervals are applied. (b) Maximum velocity projections of the microvascular network in a rat brain cortex incorporating RSD maximum intensity projections with 5 A-line intervals. (c) Comparison of velocities from Doppler shift measurements and RSD measurements. Error bars represent the standard deviations from 5 measurements in the adjacent regions at each position.
The RSD projections with different A-line intervals are merged to detect velocities within a wider range. The main idea is that the flow is measured with a larger A-line interval for sensitive and accurate quantification, and the A-line interval used in the measurements should avoid RSD saturation. Therefore, for each point in the projection, an appropriate A-line interval should be selected and the corresponding RSD value is extracted. is the RSD value at the A-line of and the B-scan of in the RSD maximum intensity projection with the A-line interval of . The A-line intervals of , , , , and are 0.02 ms, 0.04 ms, 0.10 ms, 0.20 ms, and 0.40 ms, respectively, in this study. The flow velocity at the A-line of and the B-scan of is determined by , where is the largest A-line interval with which is in the linear range. The factors and can be determined based on the calibration using rat whole blood in Fig. 4(b) and the background measurements of the projections, respectively. Figure 5(b) shows the maximum velocity projections of the microvascular network in a rat brain cortex. Velocities are extracted from 5 positions in Fig. 5(b), which are compared with the values calculated from the Doppler shifts. For the velocity quantification using Doppler OCT, the Doppler angles of 5 positions on major branches were calculated based on the reconstruction of the branch skeletons, which was described by the previous publication.2 From Fig. 5(c), it is found that the velocities calculated by RSD values are close to the values calculated by the Doppler phases.
With different A-line intervals, RSD measurements can cover different ranges of flow velocities. In order to quantify fast blood flow, inter A-line RSD measurements were performed in this study. The time interval of can be decreased to 0.02 ms when a 50 kHz swept source is used. For measurements of slow blood flow, the time interval should be increased. In addition to the inter A-line RSD measurements, inter B-scan (inter frame) RSD measurements can also be used to further increase the time interval.
The accurate relationship between RSD values and flow velocities is an exponential term. When the RSD values are relatively low compared to the saturated threshold in the measurements, RSD values have a nearly linear relationship with flow velocities. The linear range will depend on the sampling time interval and the optical properties of the sample for a given OCT system. From linear regression analysis, the correlation coefficients are about 0.99 when RSD values are in the range of 0.32–0.40 in Fig. 2(c) and in the range of 0.40–0.49 in Fig. 4(b). For more accurate measurements, it is suggested that the calibration could be made with more measurement points and the exponential fitting.
In summary, we developed a RSD-OCT method based on the relative standard deviation measurement for flow velocity mapping without consideration of Doppler angles. The insensitivity of RSD values at the Doppler angles within a wide range of angles and the nearly linear relationship between RSD values and flow velocities were validated by a flow phantom of intralipid solution. After a calibration using rat whole blood, the flow velocity was mapped in a rat brain cortex. A comparison between the Doppler shift measurement and the RSD measurement showed that flow velocity can be mapped quantitatively using the RSD-OCT system over a broad range of flow velocities and vessel orientations. This method has great potential for in vivo quantification of flow dynamics in brains and eyes.
Acknowledgments
This work was supported by grants from the National Institutes of Health (R01HL-125084, R01HL-127271, R01EY-026091, and P41EB-015890). Dr. Ling Wang was supported by a grant from the National Natural Science Foundation of China (61675059). Dr. Li Qi is currently with the Department of Biomedical Engineering, Southern Medical University, China, and was supported by the China Postdoctoral Science Foundation (2017M610536), the National Natural Science Foundation of China (31700857), and the Guangdong Provincial Natural Science Foundation (2017A030310516). Dr. Zhongping Chen has financial interest in OCT Medical Imaging, Inc., which, however, did not support this work.
References
- 1. You J., Du C., Volkow N. D., and Pan Y., Biomed. Opt. Express 5, 3217 (2014). 10.1364/BOE.5.003217 [DOI] [PMC free article] [PubMed] [Google Scholar]
- 2. Qi L., Zhu J., Hancock A. M., Dai C., Zhang X., Frostig R. D., and Chen Z., Biomed. Opt. Express 7, 601 (2016). 10.1364/BOE.7.000601 [DOI] [PMC free article] [PubMed] [Google Scholar]
- 3. Chen Z., Zhao Y., Srinivas S., Nelson J., Prakash N., and Frostig R., IEEE J. Sel. Top. Quantum Electron. 5, 1134 (1999). 10.1109/2944.796340 [DOI] [PMC free article] [PubMed] [Google Scholar]
- 4. Chen Z. and Zhu J., in Neurophotonics and Brain Mapping, 1st ed., edited by Chen Y. and Kateb B. ( Taylor & Francis, Boca Raton, 2017), p. 159. [Google Scholar]
- 5. Huang S., Piao Z., Zhu J., Lu F., and Chen Z., J. Biomed. Opt. 20, 76003 (2015). 10.1117/1.JBO.20.7.076003 [DOI] [PMC free article] [PubMed] [Google Scholar]
- 6. Vakoc B. J., Lanning R. M., Tyrrell J. A., Padera T. P., Bartlett L. A., Stylianopoulos T., Munn L. L., Tearney G. J., Fukumura D., Jain R. K., and Bouma B. E., Nat. Med. 15, 1219 (2009). 10.1038/nm.1971 [DOI] [PMC free article] [PubMed] [Google Scholar]
- 7. Zhao Y., Chen Z., Saxer C., Shen Q., Xiang S., de Boer J. F., and Nelson J. S., Opt. Lett. 25, 1358 (2000). 10.1364/OL.25.001358 [DOI] [PubMed] [Google Scholar]
- 8. Liu G., Chou L., Jia W., Qi W., Choi B., and Chen Z., Opt. Express 19, 11429 (2011). 10.1364/OE.19.011429 [DOI] [PMC free article] [PubMed] [Google Scholar]
- 9. Ren H., Brecke K. M., Ding Z., Zhao Y., Nelson J. S., and Chen Z., Opt. Lett. 27, 409 (2002). 10.1364/OL.27.000409 [DOI] [PubMed] [Google Scholar]
- 10. Mariampillai A., Standish B. A., Moriyama E. H., Khurana M., Munce N. R., Leung M. K., Jiang J., Cable A., Wilson B. C., Vitkin I. A., and Yang V. X., Opt. Lett. 33, 1530 (2008). 10.1364/OL.33.001530 [DOI] [PubMed] [Google Scholar]
- 11. Liu X., Huang Y., Ramella-Roman J. C., Mathews S. A., and Kang J. U., Opt. Lett. 38, 805 (2013). 10.1364/OL.38.000805 [DOI] [PMC free article] [PubMed] [Google Scholar]
- 12. Wang R. K., Jacques S. L., Ma Z., Hurst S., Hanson S. R., and Gruber A., Opt. Express 15, 4083 (2007). 10.1364/OE.15.004083 [DOI] [PubMed] [Google Scholar]
- 13. Zhi Z., Qin W., Wang J., Wei W., and Wang R. K., Opt. Lett. 40, 1779 (2015). 10.1364/OL.40.001779 [DOI] [PMC free article] [PubMed] [Google Scholar]
- 14. Chen Z., Milner T. E., Dave D., and Nelson J. S., Opt. Lett. 22, 64 (1997). 10.1364/OL.22.000064 [DOI] [PubMed] [Google Scholar]
- 15. You J., Zhang Q., Park K., Du C., and Pan Y., Opt. Lett. 40, 4293 (2015). 10.1364/OL.40.004293 [DOI] [PMC free article] [PubMed] [Google Scholar]
- 16. Cho Y., Zheng G., Augustine G., Hochbaum D., Cohen A., Knopfel T., Pisanello F., Pavone F., Vellekoop I., Booth M., Hu S., Zhu J., Chen Z., and Hoshi Y., J. Opt. 18, 093007 (2016) 10.1088/2040-8978/18/9/093007. [DOI] [PMC free article] [PubMed] [Google Scholar]
- 17. Chen Z., Milner T. E., Srinivas S., Wang X., Malekafzali A., van Gemert M. J., and Nelson J. S., Opt. Lett. 22, 1119 (1997). 10.1364/OL.22.001119 [DOI] [PubMed] [Google Scholar]
- 18. Zhao Y., Chen Z., Saxer C., Xiang S., de Boer J. F., and Nelson J. S., Opt. Lett. 25, 114 (2000). 10.1364/OL.25.000114 [DOI] [PubMed] [Google Scholar]
- 19. Srinivasan V. J., Sakadzić S., Gorczynska I., Ruvinskaya S., Wu W., Fujimoto J. G., and Boas D. A., Opt. Express 18, 2477 (2010). 10.1364/OE.18.002477 [DOI] [PMC free article] [PubMed] [Google Scholar]
- 20. Liu G., Lin A. J., Tromberg B. J., and Chen Z., Biomed. Opt. Express 3, 2669 (2012). 10.1364/BOE.3.002669 [DOI] [PMC free article] [PubMed] [Google Scholar]
- 21. Rubin J. M., Tuthill T. A., and Fowlkes J. B., Ultrasound Med. Biol. 27, 101 (2001). 10.1016/S0301-5629(00)00291-X [DOI] [PubMed] [Google Scholar]
- 22. Aoudi W., Liebgott H., Needles A., Yang V., Foster F. S., and Vray D., Ultrasonics 44, e135 (2006). 10.1016/j.ultras.2006.06.025 [DOI] [PubMed] [Google Scholar]
- 23. Wear K. A. and Popp R. L., IEEE Trans. Med. Imaging 6, 281 (1987). 10.1109/TMI.1987.4307844 [DOI] [PubMed] [Google Scholar]
- 24. Zhu J., Qu Y., Ma T., Li R., Du Y., Huang S., Shung K. K., Zhou Q., and Chen Z., Opt. Lett. 40, 2099 (2015). 10.1364/OL.40.002099 [DOI] [PMC free article] [PubMed] [Google Scholar]
- 25. Zhu J., Qi L., Miao Y., Ma T., Dai C., Qu Y., He Y., Gao Y., Zhou Q., and Chen Z., Sci. Rep. 6, 35499 (2016). 10.1038/srep35499 [DOI] [PMC free article] [PubMed] [Google Scholar]
- 26. Pircher M., Gotzinger E., Leitgeb R., Fercher A. F., and Hitzenberger C. K., J. Biomed. Opt. 8, 565 (2003). 10.1117/1.1578087 [DOI] [PubMed] [Google Scholar]
- 27. Hughes M., Spring M., and Podoleanu A., Appl. Opt. 49, 99 (2010). 10.1364/AO.49.000099 [DOI] [PubMed] [Google Scholar]


