

Abstract
In healthy mammalian hearts the action potential (AP) waveform initiates and modulates each contraction, or heartbeat. As a result, AP height and duration are key physiological variables. In addition, rate‐dependent changes in ventricular AP duration (APD), and variations in APD at a fixed heart rate are both reliable biomarkers of electrophysiological stability. Present guidelines for the likelihood that candidate drugs will increase arrhythmias rely on small changes in APD and Q–T intervals as criteria for safety pharmacology decisions. However, both of these measurements correspond to the final repolarization of the AP. Emerging clinical evidence draws attention to the early repolarization phase of the action potential (and the J‐wave of the ECG) as an additional important biomarker for arrhythmogenesis. Here we provide a mechanistic background to this early repolarization syndrome by summarizing the evidence that both the initial depolarization and repolarization phases of the cardiac action potential can exhibit distinct time‐ and voltage‐dependent thresholds, and also demonstrating that both can show regenerative all‐or‐none behaviour. An important consequence of this is that not all of the dynamics of action potential repolarization in human ventricle can be captured by data from single myocytes when these results are expressed as ‘repolarization reserve’. For example, the complex pattern of cell‐to‐cell current flow that is responsible for AP conduction (propagation) within the mammalian myocardium can change APD and the Q–T interval of the electrocardiogram alter APD stability, and modulate responsiveness to pharmacological agents (such as Class III anti‐arrhythmic drugs).
Keywords: action potential, all‐or‐none repolarization, K+ currents, repolarization reserve, early repolarization, late repolarization, J‐wave, T‐wave, momputational Biology, safety pharmacology
Clinical relevance of ventricular repolarization
In mammalian ventricle the action potential waveform and in particular the ‘timing and strength’ of its repolarization phase in are essential physiological variables that can strongly modulate cardiac contractility and often guide clinical arrhythmia assessments and management (see Anderson et al. 2002; Gussak & Antzelevitch, 2003; Nattel, 2010). Prominent physiological effects of even small changes in the repolarization phase of the action potential include (i) modulation of both the absolute and relative refractory periods, (ii) alterations in excitation–contraction coupling, and (iii) emergent differences in the anti‐ or proarrhythmic status of the tissue substrate (Wood et al. 1969; Bouchard et al. 1995; Clark et al. 1996; Sah et al. 2003; Nerbonne & Kass, 2005). The translational relevance of changes in action potential repolarization has been established at both the tissue and the whole heart level. Nonetheless, ongoing assessments of the utility/validity of changes in final repolarization and in the Q–T interval of the electrocardiogram as a proarrhythmic biomarker for drug candidates require more detailed knowledge of the ionic mechanisms that are responsible for final repolarization phase of the action potential (Yan et al. 2003; Roden, 2004; Bowes et al. 2012; Sager et al. 2013). In addition, there is increasing interest in obtaining an improved understanding of early repolarization of the ventricular action potential and the associated J‐wave of the ECG as part of efforts to detect and treat early repolarization syndrome abnormalities (Nattel, 2010; Hoogendijk et al. 2012, 2013). In this Topical Review we summarize, integrate and illustrate key cellular electrophysiology principles that regulate action potential repolarization in human ventricle.
It is well known that the mammalian ventricle action potential waveform exhibits (i) marked sensitivity to both transient and maintained changes in heart rate; (ii) beat‐to‐beat changes and/or modulation by autonomic transmitters and some co‐transmitters; and (iii) sensitivity to even small changes in plasma electrolytes, e.g. K+ levels (Bouchard et al. 2004) and pH (Saegusa, Garg & Spitzer, 2013). In addition, distinct patterns of changes in action potential (AP) waveforms and the Q–T intervals due to cyclical sex hormone alterations can result in population‐wide gender‐specific repolarization changes (Xiao et al. 2006; Tadros et al. 2014).
Important pathophysiological settings also provide strong motivations for continuing to seek a more comprehensive understanding of the ionic mechanism(s) that are responsible for repolarization in the mammalian heart. Examples include heart failure and ischaemia (Taggart et al. 2001) as well as both genetic and chronic disease‐induced long Q–T syndrome (Nabauer et al. 1993; Janse, 2004; Coronel et al. 2013; Walmsley et al. 2013; see Belardinelli et al. 2015). In addition, both early findings concerning Class III anti‐arrhythmic agents and more recent cellular and genetic data emphasize changes in the late repolarization phase of the action potential as an essential measure or biomarker for antiarrhythmic drug discovery and safety evaluations (Yang et al. 2014, 2015). Improved knowledge of the factors that regulate (or even reprogramme) action potential repolarization (Wang et al. 2006; Xiao et al. 2008) could improve contemporary safety pharmacology screening processes/paradigms (Anderson et al. 2002; Roden, 2004; Nerbonne & Kass, 2005; Kramer et al. 2013; see Gussak & Antzelevitch, 2003; Thomsen, 2007; Chi, 2013). It is now recognized that the early and late phases of repolarization of the ventricular action potential are controlled by different mechanisms, and are involved in or responsible for distinct sets of life‐threating rhythm disturbances (Rosso et al. 2011; Antzelevitch, 2012).
Repolarization reserve
Repolarization reserve is a useful descriptor of one set of conditions that governs action potential repolarization in cardiac myocytes (Roden & Yang, 2005; Roden, 2008; Roden & Abraham, 2011; Varro & Baczko, 2011; Jost et al. 2013). This concept is based on the principle that during a membrane or non‐conducted action potential in a myocyte, it is the algebraic sum (or net value) of all of the inward (e.g. Na+, Ca2+, Na+/Ca2+ exchanger) and outward (K+, C1−, Na+/K+ pump, Na+/Ca2+ exchanger) transmembrane currents that initiates and regulates repolarization. The classical studies of Weidmann (1951) first demonstrated that at voltages corresponding to the plateau of the action potential, the membrane resistance is very high compared to the value of this parameter at rest, that is, during diastole. Accordingly, and as illustrated clearly by related theoretical analyses (Noble, 1960, 1962a,b; Hall & Noble, 1963; Noble & Tsien, 1972), even very small net current changes can substantially alter the action potential waveform (see Moreno et al. 2013; Yang et al. 2015). A second consequence of this high membrane resistance at the action potential plateau is that during this phase of the cardiac electrophysiological duty cycle, the ventricular myocyte is a very effective current source (Joyner, 1986; see Xie et al. 2010). This property is particularly important for ensuring the normal epicardial‐to‐endocardial transmural repolarization process (Libbus et al. 2004; Antzelevitch, 2005; Spitzer et al. 2006).
Action potential waveform stability
In mammalian hearts, repolarization can be described and assessed in terms of the stability of the action potential waveform. As mentioned, the long AP plateau, and the fact that in this voltage range the membrane resistance is very high, have the consequence that even very small net current changes can significantly alter the action potential plateau height or duration. This phenomenon is particularly striking in isolated single ventricular myocytes (see Moreno et al. 2013; Romero et al. 2009, 2014). In these preparations, the action potential waveform is often quite variable, even at a fixed stimulation frequency. This variability may seem counterintuitive since in all mammalian ventricular myocytes as many as five or six different background or time‐ and voltage‐dependent currents interact to produce the net outward current that is responsible for repolarization. However, it is well known that either (i) adding an outward current source (Spitzer et al. 2006; Zaniboni et al. 2000) or (ii) reducing an inward current that is active at the action potential plateau (Yang et al. 2015) can almost completely stabilize the action potential waveform of single myocyte preparations. These results demonstrate that the repolarization reserve is very small at the AP plateau (see Nerbonne & Kass, 2005; Varro & Baczko, 2011).
This marked variation in action potential duration (APD) of a single, isolated myocyte is not representative of the normal physiological substrate. Although the ventricular myocardium consists of many millions of myocytes, they function as a well‐coupled unit or syncytium (see Wiedmann, 1957; Cranefield & Hoffman, 1958). During each heart beat there is myocyte‐to‐myocyte intercellular current flow. This essential principle has been clearly demonstrated. For example, artificially coupling as few as two myocytes (using an external electronic circuit that provides the equivalent of a low intercellular resistance), or even deliberately selecting preparations that consist of two or three well coupled myocytes for APD analysis: can almost completely remove the fluctuations in action potential duration (Zaniboni et al. 2000). Moreover, the overall profile and dynamics of transmural voltage gradients reflect a complex interaction among intrinsic myocyte properties, myocyte‐to‐myocyte resistance and the activation initiation site/sequence (Myles et al. 2010).
Transmural repolarization in either the left or the right ventricle is one important context in which such changes can significantly alter the electrophysiological substrate in mammalian hearts. Repolarization in the mammalian ventricle normally progresses in an epi‐ to endocardial orientation. This is driven by small but significant differences in the respective, spatially localized APD waveforms, and it depends critically on the relatively low resistance myocyte‐to‐myocyte coupling (Antzelevitch, 2005; Kelly et al. 2013). However, quite commonly encountered physiological changes or pathophysiological challenges, including localized or global ischaemia, can diminish this waveform gradient, and thus reduce or remove this ‘safety factor’ for transmural repolarization (Taggart et al. 2001). These differences in excitability and transmural action potential waveforms have been observed even in very small hearts, e.g. the adult mouse ventricle (Sampson & Henriquez, 2005; Kondo et al. 2006; Zhou et al. 2012).
It is also interesting that maintained changes in cell‐to‐cell coupling can result in quite marked remodelling of key electrophysiological properties of the ventricular myocardium. This includes connexin‐dependent changes in repolarization, which are due mainly to alterations in the density of expression of certain K+ channels in the myocyte (Clark et al. 2001; Libbus et al. 2004; Xiao et al. 2008). Moreover in the post‐infarction ventricle, changes in transmural APD waveform significantly alter excitation–contraction coupling. The main cause of this is that the transmembrane Ca2+ influx that triggers Ca2+‐induced Ca2+ release is very sensitive to even small changes in the action potential waveform (Bouchard et al. 1995, 2004; Sah et al. 2003; Mohri et al. 2002; Kondo et al. 2006; Bondarenko & Rasmusson, 2010).
In a number of clinical settings, the appearance of beat‐to‐beat variability in action potential repolarization is a useful biomarker for emerging proarrhythmic events (Varkevisser et al. 2012). The underlying electrophysiological mechanism(s) include changes in (i) specific channel expression levels, (ii) ion channel residual activation or ‘memory’ (Yu et al. 1999), (iii) transmembrane currents generated by ion exchangers (Na+/Ca2+) or pumps (Na+/K+), and (iv) dynamic changes in connexin‐mediated intercellular communication (Thompsen et al. 2007).
All‐or‐none repolarization
The first detailed insights into the ionic mechanism(s) that are responsible for the dynamics of repolarization in mammalian heart were published more than 65 years ago. Weidmann (1951) demonstrated that in sheep Purkinje fibres the repolarization phase of the action potential could exhibit regenerative all‐or‐none behaviour. Specifically, these experiments showed that depending upon the timing and strength of the applied current (a hyperpolarizing current injected during the plateau phase) the action potential plateau could be ‘interrupted’, that is, the membrane potential abruptly returned to the resting potential. Using a similar approach, Cranefield and Hoffman (1958) provided analogous evidence for all‐or‐none repolarization in a papillary muscle preparation.
Previously this same phenomenon had been studied in squid axon by Huxley (1959). His results demonstrated that when this ‘membrane’ (or non‐conducted) action potential was altered by applying rectangular hyperpolarizing currents at selected times very soon after the initial depolarization (see Fig. 1), the subsequent voltage trajectory of the action potential changed markedly. Sometimes it showed a regenerative depolarization, while at other times, the action potential exhibited an abrupt repolarization. This analysis of the underlying ionic mechanism(s) was the first to draw attention to the very important interactions between (i) an inactivating Na+ current and (ii) progressive activation of the time‐ and voltage‐dependent delayed rectifier K+ current for initiating action potential repolarization in this ‘space clamped’ experimental preparation.
Figure 1. The first demonstrations of all‐or‐none action potential repolarization.
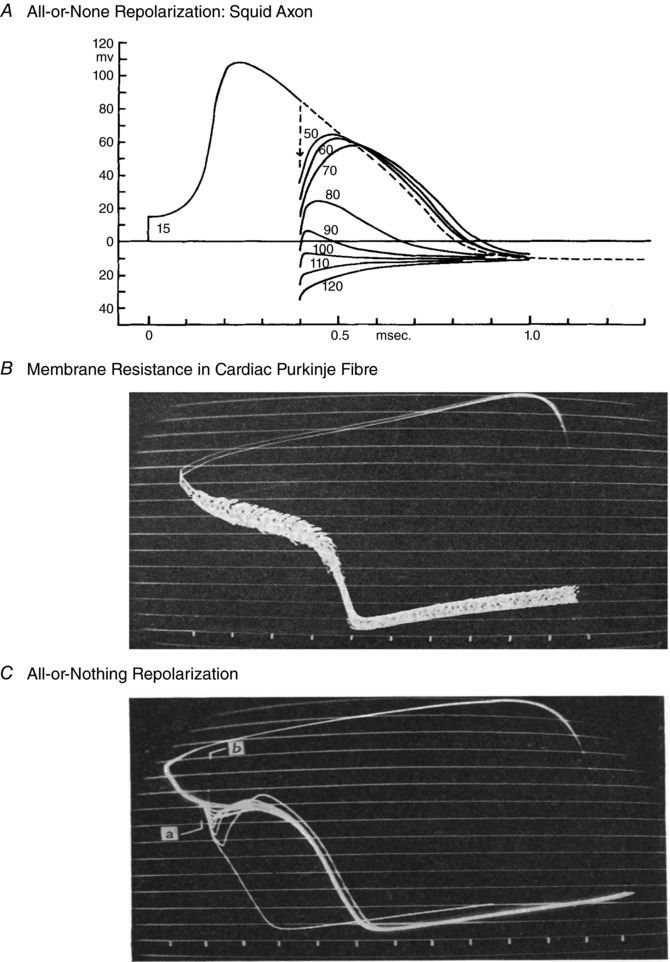
A and C, the first demonstrations of all‐or‐none action potential repolarization in the squid axon (A) and a mammalian cardiac Purkinje fibre preparation (C). Note that in both preparations, a hyperpolarizing stimulus applied during the relative refractory period effectively interrupts the action potential. This phenomenon is the basis for describing repolarization as an all‐or‐none phenomenon. B, a related study by Weidmann (1951) demonstrated that during the plateau of the cardiac action potential, membrane resistance is very high. For this reason, the action potential waveform can be altered by even very small de‐ or hyperpolarizing current pulses applied during the plateau. A direct quote from Weidmann reflects his surprise and intrigue at having discovered this principle: ‘If ever I discovered something accidentally, it was the phenomenon of all‐or‐nothing (and propagated) repolarization. With no thought of what to expect, I injected square pulses of constant current into kid Purkinje fibres by means of a second micro‐pipette. When the strength of the repolarizing current was increased in a stepwise manner, a threshold was revealed.’ In B and C each ‘tick’ or marker at the bottom denotes 100 ms, and the continuous horizontal lines denote approx. 10 mV differences. A is from Huxley (1959) and B and C are from Weidmann (1951).
The first biophysical analysis of all‐or‐none repolarization in the heart was based on data from a multicellular cardiac Purkinje fibre preparation (Noble 1962a,b; Hall & Noble 1963). As shown in Fig. 2, in these mathematical simulations, a small current was applied at selected and progressively later time points during the Purkinje fibre action potential plateau. These computations yielded results that were quite similar to the observations published by Wiedmann (1951): the threshold for all‐or‐none repolarization changed significantly depending on the size, polarity and timing of the applied current. Noble (1960) reasoned that the action potential plateau was supported by ‘failure to inactivate’ by a small fraction of the same Na+ channels that produced the action potential upstroke. Accordingly, the distinct repolarization threshold(s) for these in silico membrane action potentials were suggested to be due to a combination of (i) slow inactivation of I Na (which would, in principle, maintain the plateau), and (ii) progressive activation of the delayed rectifier K+ current (which would provide the required net outward current). Very importantly, subsequent mathematical modelling by Hall and Noble (1963) also revealed that in multicellular preparations, a comprehensive/correct understanding of the mechanism(s) for all‐or‐none repolarization required recognition of, and correction for, cable properties, i.e. intercellular current flow (see Noble & Tsien, 1972; Bean, 2007). In summary, even very early in this field of study it was recognized that in the ventricular myocardium, repolarization was regulated by both intrinsic ion channel and net current properties (the repolarization reserve), as well as concurrent, and sometimes dominant, cable properties conferred by the three‐dimensional syncytium of coupled myocytes.
Figure 2. An illustration based on computer simulations of an early working hypothesis for the ionic mechanism that underlies the plateau of the cardiac (Purkinje fibre) action potential.
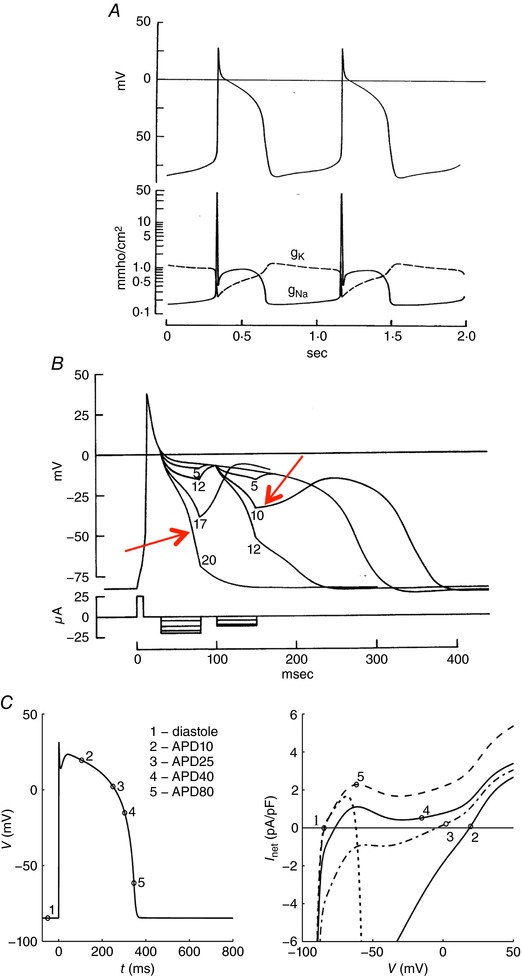
A, the Noble (1962a) mathematical reconstruction of the Purkinje fibre action potential generated the plateau phase by implementing a marked slowing of the inactivation of the same Na+ current that is responsible for the action potential upstroke. Accordingly, as shown in the bottom half of Panel A this model all‐or‐none repolarization of the action potential is dependent upon the relative sizes of this slowly inactivating (or residual) Na+ current, and the time‐ and voltage‐dependent activation of the delayed‐rectifier K+ current(s). B, as illustrated by the red arrows, the threshold for all‐or‐none repolarization moves in the depolarizing direction at later time points in the action potential plateau, as inactivation of the Na+ current becomes more complete. C, an analogous in silico analysis based on the Ten Tusscher model (Fink et al. 2006) of the human ventricular action potential. The numbers superimposed on the action potential correspond to the instantaneous current–voltage relationships shown on the right. Note that when the I–V curve is net outward, repolarization proceeds. Taken together, these findings illustrate a key concept: that a net inward current is required to maintain depolarization, and that repolarization is initiated and then progresses when the net ionic current flow is outward. A is from Noble (1962) and B and C are from Fink et al. (2006).
Additional mechanistic insights into the interactions between action potential repolarization and underlying transmembrane ionic current changes were provided by Chandler and Meves (1970a,b). Their studies were done using internal perfusion of squid axon preparations with a solution containing a high level of fluoride. This fluoride treatment significantly slowed inactivation of the Na+ current. The resulting ‘non‐inactivating’ component of the inward Na+ current caused a markedly prolonged squid axon action potential. Analysis of data from this model system clearly revealed that the repolarization threshold is due to the development of a net outward current resulting from (i) progressive time‐ and voltage‐dependent inactivation of I Na coupled with (ii) activation of the delayed rectifier K+ current, I K. Figure 3 summarizes these experimental data and also illustrates these effects, based on a mathematical model of the squid axon ‘membrane’ action potential.
Figure 3. Fluoride prolongs the squid axon action potential.
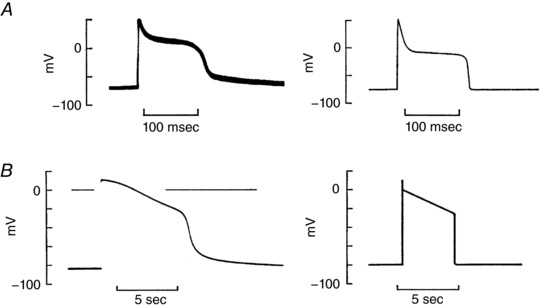
Chandler and Meves (1970a,b) reported that after internal perfusion of the squid giant axon with NaF, prolonged ‘cardiac‐like’ action potentials were observed (A and B, left). This effect was shown to be due to F3−‐induced slowing of inactivation of a small fraction of the intrinsic squid axon Na+ channels, as illustrated by the simulated ‘action potentials’ (A and B, right). These findings demonstrated the marked influence that a quasi‐steady‐state background inward current can have on action potential waveform. This type of ‘late’ or slowly inactivating Na+ current is now the focus of detailed investigations of the electrophysiological basis for novel anti‐arrhythmic agents. This is because a slowly inactivating or late Na+ current in the human heart that has been identified in a wide variety of pathophysiological settings, and novel antiarrhythmic agents are able to block it selectively (Yang et al. 2015; Belardinelli et al. 2015). This figure is adapted from Chandler and Meves (1970b).
Early repolarization and the J‐wave of the ECG
In most mammalian ventricle preparations, repolarization of the action potential exhibits distinct early and late phases (Gussak & Antzelevitch, 2003; Antzelevitch, 2012). The early repolarization phase (or notch) of the ventricular action potential is more marked in recordings from the epicardium than the endocardium. This early repolarization coincides with the J‐wave of the ECG (Wellens, 2008; Antzelevitch, 2005, 2012). Osborn (1953) first described what is now termed the J‐wave. However, the clinical significance of changes in its morphology, or even the presence of a J‐wave, remained somewhat uncertain until about 10 years ago (Wellens, 2008; Haissaguerre et al. 2008; Tikannen et al. 2009; Antzelevitch & Yan, 2010; Burashnikov et al. 2010; Antzelevitch et al. 2011; Hoogendijk et al. 2013). A recent consensus document (Macfarlane et al. 2015) summarizes key background findings and presents clinical guidelines concerning optimal recordings of early repolarization and the J‐wave. This framework, together with criteria developed for detecting benign vs. malignant J‐wave and S–T segment ‘interactions’ are of increasing translational significance. It is now recognized that early repolarization abnormalities require reliable detection and careful management (see ‘the early repolarization syndrome’ Rosso et al. 2011, 2012).
The discovery of the L‐type Ca2+ current, I Ca‐L, in mammalian heart cells represented a paradigm shift concerning the ionic mechanism(s) responsible for the plateau and repolarization phases of the AP in mammalian ventricle. In the late 1960s Reuter and colleagues (reviewed by Reuter, 1973) first demonstrated that a small Ca2+ current (and not mainly a slowly inactivating Na+ current) had an essential role in supporting the ventricular action potential plateau in vertebrate hearts. The experimental work by Giebisch and Weidmann (1971) provided further insights into the ionic basis for all‐or‐none behaviour during repolarization of the action potential in ventricular trabeculae. Their results demonstrated that near the end of the action potential plateau under physiological conditions the two main interacting transmembrane ionic currents changes were (i) inactivation of I Ca‐L and (ii) activation of time‐ and voltage‐dependent or delayed rectifier K+ currents. Nerbonne and Kass (2005) and Jost et al. (2013) have reviewed evidence that these delayed rectifier K+ currents in human ventricle are predominantly I KR (encoded by HERG) and I KS (encoded by KCNQ1 and KCNEI).
Somewhat similar studies of the early repolarization or ‘notch’ of the mammalian ventricular action potential have revealed the ionic basis for this phase of the action potential. In this setting two principal (and overlapping) current changes are due to changes in I Ca‐L and a Ca2+‐independent K+ current, denoted I to, as illustrated in Figs 4 and 5. Expression levels of I to are heterogeneous, being larger in the right ventricle (RV) than left (LV), and also consistently larger in the epicardial than the endocardial regions of both the RV and the LV (Antzelevitch, 2005). Significant pathophysiological settings in which this transmural heterogeneity is apparent include hypothyroidism, and both types I and II diabetes (Ballou et al. 2015). In each, the density of expression of I to is selectively reduced in the epicardium and indeed the early repolarization phase of the action potential is reduced/slowed. It is also known that in a number of pathophysiological settings the net current emerging from time‐ and voltage‐dependent interactions among (i) L‐type Ca2+ current, (ii) outward K+ current(s) and (iii) a slowly inactivating or persistent Na+ current can give rise to arrhythmogenic early afterdepolarizations (Wang et al. 2006; Zhao et al. 2012; Moreno et al. 2013; Qu et al. 2013; Belardinelli et al. 2015; Liu et al. 2016).
Figure 4. Demonstration that the threshold for all‐or‐none repolarization during the action potential waveform in the endocardium of human ventricle myocyte is time‐and voltage‐dependent.
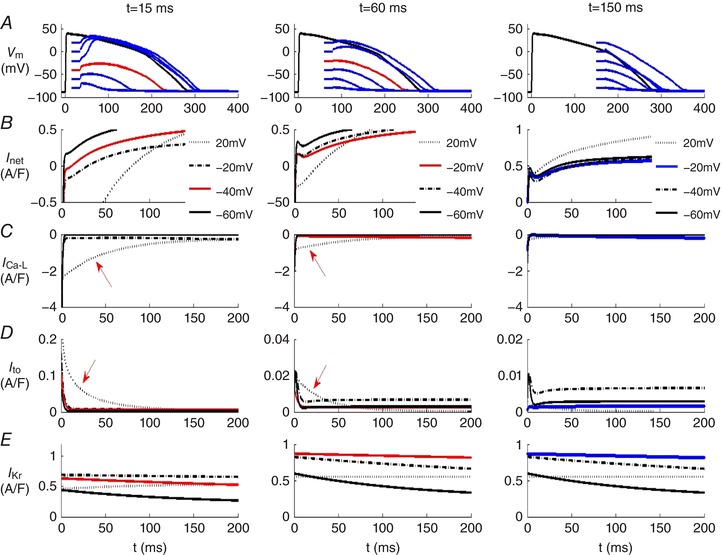
The O'Hara et al. (2011) mathematical model of the human endocardial ventricular action potential was used in these simulations. Row A in each column shows superimposed families of action potentials. In these simulations each of these APs was ‘interrupted’ by progressively larger 20 ms hyperpolarizing voltage clamp steps applied during the plateau or repolarization phases. Specifically, these voltage clamp steps were applied 15 ms (left column), 60 ms (centre column), or 150 ms (right column) after the AP upstroke. Rows B–E consist of superimposed transmembrane current records. As expected at progressively later time points during the action potential, a hyperpolarizing voltage‐clamp step is more effective at initiating repolarization. The ‘threshold’ magnitude of the hyperpolarization that is followed by action potential repolarization is denoted by the red action potentials in the left and centre columns. Note from row B that at each of the three selected time points during the action potential, the hyperpolarizing voltage clamp step induces repolarization only when the intrinsic underlying ionic currents become net outward. As shown in the right column there is no such threshold at times later than 150 ms after the AP upstroke. From this analysis it is clear that in this human ventricular endocardial myocyte model (i) early repolarization is strongly modulated by the initial sizes and inactivation rates of I Ca‐L and I to, and (ii) late repolarization is mainly dependent upon the activation of the time‐ and voltage‐dependent K+ current, HERG or I Kr (see text for additional description and discussion). In all cases repolarization is initiated in the precise voltage range at which I net is outward.
Figure 5. Illustration of the changes in individual time‐ and voltage‐dependent transmembrane ionic currents that underlie the net current which regulates the human ventricular epicardial action potential waveform.
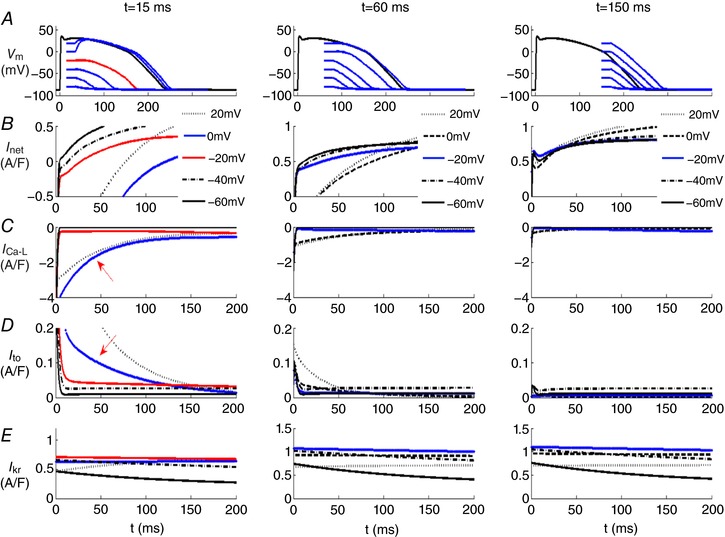
The voltage clamp protocol described in the legend of Fig. 4 was repeated here using the epicardial ventricular myocyte model (O'Hara et al. 2011). The 3 columns of data in rows B–E each consist of 5 superimposed current records beginning at time points that are 15 ms (left) 60 ms (middle) and 150 ms (right) after the upstroke of the action potential. In each column, the current changes due to I net (row B), I Ca‐L (row C), I to (row D) and I Kr or HERG (row E) are illustrated at 5 different voltages, +20, −20, −40 (red) and −60 mV. The red traces denote the net current change that gives rise to the regenerative depolarization or repolarization threshold. This is at −20 mV 15 ms after the upstroke (left column). In this epicardial ventricular myocyte model, no regenerative depolarization could be identified at either 60 or 150 ms.
An important question is: Do both phases of repolarization exhibit all‐or‐none repolarization? To address this while also illustrating the underlying transmembrane ionic current changes, we have used mathematical simulations based on a well‐validated mathematical model of the epicardial and endocardial variants of the human ventricular action potential (O'Hara et al. 2011). Our results are summarized in Figs 4 and 5. In each of these in silico tests, the selected isolated human ventricular myocyte was stimulated at 1 Hz, and then at three preselected time points during the action potential, a 20 ms hyperpolarizing voltage clamp step was applied. These times were (i) (left column) at 15 ms, i.e. almost immediately after the action potential upstroke (initial depolarization); (ii) (middle column) at 60 ms, i.e. during the plateau of the action potential; and (iii) (right column) at 150 ms, i.e. during the final phase of action potential repolarization of the action potential. The chosen combination or family of hyperpolarizing voltage clamp steps displaced the membrane potential to five different levels that spanned the full physiological range. Inspection of Fig. 4 shows that at time points corresponding to early repolarization (15 or 60 ms), well‐defined thresholds for all‐or‐none repolarization (approx. −40 and −20 mV) are observed. In contrast, at the time point that corresponds to late repolarization (right column, 150 ms), no threshold for repolarization could be identified. In the left and centre columns the traces in red reflect the ‘thresholds’ for early repolarization (row A), this figure also shows the corresponding net current changes (row B) as well as the changes in I Ca‐L (row C), I to (row D) and HERG or I Kr (row E).
In fact, however, the calculations in Fig. 4 underestimate the dynamic interactions among these currents during early repolarization since these simulations were done using the endocardial human ventricular cell model developed by O'Hara et al. (2011). As mentioned previously, in human ventricle the myocytes on the epicardium of both the right and the left ventricle exhibit a much more prominent early repolarization phase due mainly to a larger I to expression in the epicardium. Comparison of the closely related sets of computations in Figs 4 and 5 illustrate this difference. They also reinforce the fact that early repolarization is due to the net outward current generated mainly by overlapping I Ca‐L and I to. In the epicardium the expression of the Ca2+‐independent K+ current I to is much larger than in the endocardium and this has the consequence that there is only one threshold for regenerative depolarization (−20 mV at 15 ms) following the hyperpolarizing voltage clamp step. The prominent early repolarization ‘notch’ of the action potential also drives the gradient of repolarization that generates the J‐wave and modulates the T‐wave in some ECG recordings (Joyner 1986; Antzelevitch, 2012). This transmural gradient of repolarization is a consistent property of all mammalian ventricles. In fact, it has even been demonstrated in the transmural aspect of the adult mouse right ventricle where the epicardial‐to‐endocardial thickness/dimension is only approximately 200 μm (Teutsch et al. 2007).
In summary, during early repolarization (specifically at 15 ms after the action potential upstroke) the two most prominent current changes are (i) inactivation of the transient outward K+ current, I to, and (ii) the overlapping inactivation of the L‐type Ca2+ current, I Ca‐L. The applied voltage clamp hyperpolarizations during these membrane action potentials demonstrate the full extent of these interactions. That is, they reveal distinct voltage and time ‘windows’ when (i) either the outward current due mainly to I to predominates (all‐or‐none repolarization) or (ii) the remaining I Ca‐L yields a net inward current and produces a slow (all‐or‐none) depolarization.
Final repolarization and the T‐Wave of the ECG
The late or final repolarization phase of the action potential has been studied in detail. In part, this is because APD90, the voltage/time point corresponding to 90% of full repolarization of the action potential, is an almost universally accepted measure of ‘repolarization’ (Roden, 2004; Antzelevitch, 2005; Fink et al. 2006; Zaniboni, 2011, 2012). Certainly, APD90, can be related qualitatively to the T‐wave of the lead II ECG (Anderson et al. 2002; Romero et al. 2014; Yang et al. 2014). However, in most physiological settings, the preparations being studied are not ‘space clamped’. That is, after their initiation the action potentials propagate from myocyte to myocyte. During this conduction process intercellular current flow results in a quite complex time course or distribution of both (i) the residual applied stimulus current and the (ii) intrinsic ‘source current’ from adjacent myocytes. These factors must be taken into account when attempting to fully understand or account for the mechanisms/dynamics of the repolarization process (see Noble & Tsien, 1972; Jack et al. 1975; Gray et al. 2013). The data sets in the right columns of Figs 4 and 5 demonstrate the principal ionic mechanisms of late repolarization based on the O'Hara et al. (2011) mathematical model of the human ventricular action potential. Inspection of these result shows that late in the AP plateau and at all time points thereafter there are no regenerative depolarizations following release of the imposed voltage clamp steps. This is mainly because I Ca has inactivated almost completely. Accordingly, the repolarizing voltage trajectory is governed by progressive activation of the delayed rectifier K+ current(s), I Kr and I Ks (Anderson et al. 2002; Nerbonne and Kass, 2005). When the membrane potential has repolarized to approx. −60 mV, these time‐dependent outward currents are supplemented by outward K+ current provided by I KI channels. This is the same inwardly rectifying background K+ current that strongly modulates the resting potential in the human ventricle (see Fink et al. 2006). I K1 is not shown in this figure since only time‐ and voltage‐dependent current changes are illustrated. Under the conditions of this set of simulations, both HERG or I Kr and I Ks are relatively small. However, it is clear that both of these K+ currents contribute to the initiation of and provide a safety factor for final repolarization in ventricular myocytes (Roden & Yang, 2005; Silva & Rudy, 2005; Roden & Abraham, 2011).
Concluding perspectives
The changes in transmembrane ionic currents that are responsible for both early and late repolarization are now quite well understood at the single myocyte level (Gussack & Antzelevitch, 2000; Anderson et al. 2002; Nerbonne & Kass, 2005). For ongoing attempts to develop or re‐purpose compounds as anti‐arrhythmic drugs, the ‘repolarization reserve’ concept has proven quite useful (Roden, 2004; Roden & Yang, 2005; Roden & Abraham, 2011). However, this concept and operational definition strictly apply only to non‐conducted or ‘membrane’ action potentials. Furthermore, it is important to recognize that both early and late repolarization are highly non‐linear; that is, both can be a regenerative, all‐or‐none dynamic process.
To summarize the important biophysical principles and reiterate the need to consider the underlying mechanisms for both ‘membrane’ and ‘conducted action potentials’ (see Bean, 2007) we provide the following example. The ionic mechanism for the early repolarization phase or ‘notch’ of the action potential (especially in the epicardium) can be accounted for in a single myocyte using classical ‘net current analysis’ as shown in Figs 4 and 5. However, the related J‐wave of the ECG involves important additional factors, including effects of intercellular current flow and the influence of capacitive as opposed to transmembrane ionic currents (Antzelevitch, 2012; Rosso et al. 2012). Somewhat similar considerations apply in attempts to account for and utilize T‐wave morphology (Roden, 2004; Kannankeril et al. 2010), changes the S–T segment and/or Q–T interval changes as biomarkers for pro‐arrhythmic substrates (Vicente et al. 2015).
Ongoing multidisciplinary efforts aimed at developing improved criteria for cardiac safety pharmacology (Thomsen, 2007; Thomsen et al. 2007) must be based on a comprehensive understanding of the full spectrum of repolarization dynamics. This requires data and insights that have been obtained both at the membrane action potential and single myocyte level (see Sarkar and Sobie, 2011; Sarker et al. 2012; Mirams et al. 2012, 2016) and from multicellular settings where the myocardium functions as a normal syncytium (see Kramer et al. 2013; Sager et al. 2013).
Additional information
Competing interests
None declared.
Author contributions
All authors have approved the final version of the manuscript and agree to be accountable for all aspects of the work. All persons designated as authors qualify for authorship, and all those who qualify for authorship are listed.
Funding
The Giles Laboratory acknowledges funding from the Canadian Institutes for Health Research. The computational work in Spain, was funded from the Ministerio de Economia, Industria y Competitividad of Spain (DPI2016‐75799‐R) and AEI/FEDER, UE, and the Programa Prometeu (PROMETEU/2016/088) de la Conselleria d'Educació, Formació/Ocupació, Generalitat Valenciana.
Biographies
Beatriz Trenor received a PhD from the Universitat Politècnica de València (UPV), Valencia, Spain, in 2001. In 1997 she graduated as an Electronic Engineer at the UPV. Currently, she is an Assistant Professor in the Department of Electronic Engineering, UPV. She is also the Leader of the Cardiac Modelling Group, Center for Research and Innovation in Bioengineering at the UPV. Her current research interests include cardiac electrophysiology and computer modelling of cardiac electrical activity.
![]()
Karen Cardona received a PhD from the UPV in 2008. In 2002, she graduated as a Telecomunications Engineer at the Universidad Santo Tomás de Colombia. Currently, she is a researcher in the Cardiac Modelling Group, Center for Research and Innovation in Bioengineering at the UPV. Her current research interests include cardiac electrophysiology and computer modelling of cardiac electrical activity.
Javier Saiz received a PhD from the UPV in 1992. In 1986, he graduated as an Electronic Engineer at the UPV. Currently, he is a Full Professor in the Department of Electronic Engineering, UPV, where he is also a researcher of the Cardiac Modelling Group, and the Leader of Center for Research and Innovation in Bioengineering at the UPV. His current research interests include cardiac electrophysiology, computer modelling of cardiac electrical activity, biomedical signal processing and bioelectronic instrumentation.
Denis Noble is Emeritus Professor of Cardiovascular Physiology in the Department of Physiology, Anatomy and Genetics at Oxford University. Fifty years ago he published the first mathematical model of the electrical activity of the heart based on experimental measurements of ion channels. This has since been developed into the virtual heart project within the Human Physiome Project of the International Union of Physiological Sciences (IUPS). He is author of The Music of Life (Oxford University Press, 2006), the first popular book on systems biology, now translated into nine foreign languages, and of Dance to the Tune of Life, recently published by CUP.
Wayne Giles is currently Professor in the Faculties of Kinesiology and Medicine at the University of Calgary. His interests in Cardiac Electrophysiology include ion channel function, pacemaker activity, and rhythm disturbances.
References
- Anderson ME, Al‐Khatib SM, Roden DM & Califf RM (2002). Cardiac repolarization: current knowledge critical gaps and new approaches to drug development and patient management. Am Heart J 144, 769–781. [DOI] [PubMed] [Google Scholar]
- Antzelevitch C (2005). Modulation of transmural repolarization. Ann N Y Acad Sci 1047, 314–323. [DOI] [PMC free article] [PubMed] [Google Scholar]
- Antzelevitch C (2012). Genetic molecular and cellular mechanisms underlying the J wave syndromes. Circ J 76, 1054–1065. [DOI] [PMC free article] [PubMed] [Google Scholar]
- Antzelevitch C & Yan GX (2010). J wave syndromes. Heart Rhythm 7, 549–558. [DOI] [PMC free article] [PubMed] [Google Scholar]
- Antzelevitch C, Yan GX & Viskin S (2011). Rationale for the use of the terms J‐wave syndromes and early repolarization. J Am Coll Cardiol 7, 1587–1590. [DOI] [PMC free article] [PubMed] [Google Scholar]
- Ballou LM, Lin RZ & Cohen IS (2015). Control of cardiac repolarization by phosphoinositide 3‐kinase signalling to ion channels. Circ Res 116, 127–137. [DOI] [PMC free article] [PubMed] [Google Scholar]
- Bean BP (2007). The action potential in mammalian central neurons. Nat Rev Neurosci 8, 451–465. [DOI] [PubMed] [Google Scholar]
- Belardinelli L, Giles WR, Rajamani S, Karagueuzian HS, Shryock JC (2015). Cardiac late Na+ current: proarrhythmic effects, roles in long QT syndromes, and pathologic relationship to CaMKII and oxidative stress. Heart Rhythm 12, 440–448. [DOI] [PubMed] [Google Scholar]
- Bonderenko VE & Rasmusson RL (2010). Transmural heterogeneity of repolarization and Ca2+ handling in a model of mouse ventricular tissue. Am J Physiol Heart Circ Physiol 299, H454–H469. [DOI] [PMC free article] [PubMed] [Google Scholar]
- Bouchard R, Clark R & Giles W (1995). Effects of action potential duration on excitation contraction coupling in rat ventricular myocytes: action potential voltage‐clamp measurements. Circ Res 76, 790–801. [DOI] [PubMed] [Google Scholar]
- Bouchard R, Clark RB, Juhasz AE & Giles WR (2004). Changes in extracellular K+ concentration modulate contractility of rat and rabbit cardiac myocytes via the inward rectifier K+ current, IK1 . J Physiol 556, 773–790. [DOI] [PMC free article] [PubMed] [Google Scholar]
- Bowes J, Brown AJ, Hamon J, Jarolimek W, Sridhar A, Waldron G & Whitebread S (2012). Reducing safety‐related drug attrition: the use of in vitro pharmacological profiling. Nat Rev Drug Discov 11, 909–922. [DOI] [PubMed] [Google Scholar]
- Burashnikov E, Pfeiffer R, Barajas‐Martinez H, Delpon E, Hu D, Desai M, Borggrefe M, Haissaguerre M, Kanter R, Pollevick GD, Guerchicoff A, Laino R, Marieb M, Nademanee K, Nam G, Robles R, Schimpf R, Stapleton D, Viskin S, Winters S, Wolpert C, Zimmern S, Veltmann C & Antzelevitch C (2010). Mutations in the cardiac L‐type calcium channel associated with inherited J‐wave syndromes and sudden cardiac death. Heart Rhythm 7, 1872–1882. [DOI] [PMC free article] [PubMed] [Google Scholar]
- Chandler WK & Meves H (1970a). Evidence for two types of sodium conductance in axons perfused with sodium fluoride solution. J Physiol 211, 653–678. [DOI] [PMC free article] [PubMed] [Google Scholar]
- Chandler WK & Meves H (1970b). Slow changes in membrane permeability and long lasting action potentials in axons perfused with fluoride solutions. J Physiol 211, 707–728. [DOI] [PMC free article] [PubMed] [Google Scholar]
- Chi KR (2013). Revolution dawning in cardiotoxicity testing. Nat Rev Drug Discov 12, 565–567. [DOI] [PubMed] [Google Scholar]
- Clark R, Bouchard R & Giles W (1996). Action potential duration modulates calcium influx, Na+‐Ca2+ exchange, and intracellular calcium release in rat ventricular myocytes. Ann N Y Acad Sci 779, 417–429. [DOI] [PubMed] [Google Scholar]
- Clark RB, Tremblay A, Melnyk P, Allen BG, Giles WR & Fiset C (2001). T‐tubule localization of the inward‐rectifier K+ channel in mouse ventricular myocytes: a role in K+ accumulation. J Physiol 537, 979–992. [DOI] [PMC free article] [PubMed] [Google Scholar]
- Coronel R, Wilders R, Verkerk AO, Wiegerinck RF, Benoist D & Bernus O (2013). Electrophysiological changes in heart failure and their implications for arrhythmogenesis. Biochim Biophys Acta 1832, 2432–2441. [DOI] [PubMed] [Google Scholar]
- Cranefield PF & Hoffman BF (1958). Propagated repolarization in heart muscle. J Gen Physiol 41, 633–649. [DOI] [PMC free article] [PubMed] [Google Scholar]
- Fink M, Giles WR & Noble D (2006). Contributions of inwardly rectifying K+ currents to repolarization assessed using mathematical models of human ventricular myocytes. Philos Trans A Math Phys Eng Sci 364, 1207–1222. [DOI] [PubMed] [Google Scholar]
- Giebisch G & Weidmann S (1971). Membrane currents in mammalian ventricular heart muscle fibers using a voltage‐clamp technique. J Gen Physiol 57, 290–296. [DOI] [PMC free article] [PubMed] [Google Scholar]
- Gray RA, Mashburn DN, Sidorov VY & Wikswo JP (2013). Quantification of transmembrane currents during action potential propagation in the heart. Biophys J 104, 268–278. [DOI] [PMC free article] [PubMed] [Google Scholar]
- Gussak I & Antzelevitch C (2000). Early repolarization syndrome: clinical characteristics and possible cellular and ionic mechanisms. J Electrocardiol 33, 299–309. [DOI] [PubMed] [Google Scholar]
- Gussak I & Antzelevitch C (2003). Cardiac Repolarization: Bridging Basic and Clinical Science. Humana Press Inc, Totowa, NJ, USA. [Google Scholar]
- Haissaguerre M, Derval N, Sacher F, Jesel L, Deisenhofer I, de Roy L, Pasquie JL, Nogami A, Babuty D, Yli‐Mayry S, De Chillou C, Scanu P, Mabo P, Matsuo S, Probst V, Le Scouarnec S, Defaye P, Schlaepfer J, Rostock T, Lacroix D, Lamaison D, Lavergne T, Aizawa Y, Englund A, Anselme F, O'Neill M, Hocini M, Lim KT, Knecht S, Veenhuyzen GD, Bordachar P, Chauvin M, Jais P, Coureau G, Chene G, Klein GJ & Clementy J (2008). Sudden cardiac arrest associated with early repolarization. N Engl J Med 358, 2016–2023. [DOI] [PubMed] [Google Scholar]
- Hall AE & Noble D (1963). Transient responses of Purkinje fibres to non‐uniform currents. Nature 199, 1294–1295. [DOI] [PubMed] [Google Scholar]
- Hoogendijk MG, Potse M & Coronel R (2012). Early repolarization patterns: the good, the bad, and the ugly? Heart Rhythm 9, 230–231. [DOI] [PubMed] [Google Scholar]
- Hoogendijk MG, Potse M & Coronel R (2013). Critical appraisal of the mechanism underlying J waves. J Electrocardiol 46, 390–394. [DOI] [PubMed] [Google Scholar]
- Huxley AF (1959). Ion movements during nerve activity. Ann N Y Acad Sci 81, 221–246. [DOI] [PubMed] [Google Scholar]
- Jack, JJB , Noble D & Tsien RW (1975). Electric Current Flow in Excitable Cells. Clarendon Press, Oxford. [Google Scholar]
- Janse MJ (2004). Electrophysiological changes in heart failure and their relationship to arrhythmogenesis. Cardiovasc Res 61, 208–217. [DOI] [PubMed] [Google Scholar]
- Jost N, Virag L, Comtois P, Ordog B, Szuts V, Seprenyi G, Bitay M, Kohajda Z, Koncz I, Nagy N, Szel T, Magyar J, Kovacs M, Puskas LG, Lengyel C, Wettwer E, Ravens U, Nanasi PP, Papp JG, Varro A & Nattel S (2013). Ionic mechanisms limiting cardiac repolarization‐reserve in humans compared to dogs. J Physiol 591, 4189–4206. [DOI] [PMC free article] [PubMed] [Google Scholar]
- Joyner RW (1986). Modulation of repolarization by electrotonic interactions. Japan Heart J 27, 167–183. [PubMed] [Google Scholar]
- Kannankeril P, Roden DM & Darbar D (2010). Drug‐induced long QT syndrome. Pharmacol Rev 62, 760–781. [DOI] [PMC free article] [PubMed] [Google Scholar]
- Kelly A, Ghouri IA, Kemi OJ, Bishop MJ, Bernus O, Fenton FH, Myles RC, Burton FL & Smith GL (2013). Subepicardial action potential characteristics are a function of depth and activation sequence in isolated rabbit hearts. Circ Arrhythm Electrophysiol 6, 809–817. [DOI] [PubMed] [Google Scholar]
- Kondo RP, Dederko DA, Teutsch C, Chrast C, Catalucci D, Chien KR & Giles WR (2006). Comparison of contraction and calcium handling between right and left ventricular myocytes from adult mouse heart: a role for repolarization waveform. J Physiol 571, 131–146. [DOI] [PMC free article] [PubMed] [Google Scholar]
- Kramer J, Obejero‐Paz CA, Myatt G, Kuryshev YA, Bruening‐Wright A, Verducci JS & Brown AM (2013). MICE models: superior to the HERG model in predicting Torsade de Pointes. Sci Rep 3, 2100–2111. [DOI] [PMC free article] [PubMed] [Google Scholar]
- Libbus I, Wan X & Rosenbaum DS (2004). Electrotonic load triggers remodeling of repolarizing current I to in ventricle. Am J Physiol Heart Circ Physiol 286, H1901–H1909. [DOI] [PubMed] [Google Scholar]
- Liu MB, Ko CY, Song Z, Garfinkel A, Weiss JN & Qu Z (2016). A dynamical threshold for cardiac delayed afterdepolarization‐mediated triggered activity. Biophys J 111, 2523–2533. [DOI] [PMC free article] [PubMed] [Google Scholar]
- Macfarlane PW, Antzelevitch C, Haissaguerre M, Huikuri H, Potse M, Rosso R, Sacher F, Tikkanen JT, Wellens H & Yan GX (2015). The early repolarization pattern: a consensus paper. J Am Coll Cardiol 66, 470–477. [DOI] [PubMed] [Google Scholar]
- Mirams GR, Davies MR, Cui Y, Kohl P & Noble D (2012). Application of cardiac electrophysiology simulations to pro‐arrhythmic safety testing. Br J Pharmacol 167, 932–945. [DOI] [PMC free article] [PubMed] [Google Scholar]
- Mirams GR, Pathmanathan P, Gray RA, Challenor P & Clayton RH (2016). White paper: uncertainty and variability in computational and mathematical models of cardiac physiology. J Physiol 23, 6833–6847. [DOI] [PMC free article] [PubMed] [Google Scholar]
- Mohri S, Shimizu J, Mika Y, Shemer I, Wang J, Ben‐Haim S & Burkhoff D (2002). Electric currents applied during refractory period enhance contractility and systolic calcium in the ferret heart. Am J Physiol Heart Circ Physiol 284, H1119–H1123. [DOI] [PubMed] [Google Scholar]
- Moreno JD, Yang PC, Bankston JR, Grandi E, Bers DM, Kass RS & Clancy CE (2013). Ranolazine for congenital and acquired late INa‐linked arrhythmias: in silico pharmacological screening. Circ Res 113, e50–e61. [DOI] [PMC free article] [PubMed] [Google Scholar]
- Myles RC, Bernus O, Burton FL, Cobbe SM & Smith GL (2010). Effect of activation sequence on transmural patterns of repolarization and action potential duration in rabbit ventricular myocardium. Am J Physiol Heart Circ Phyiol 299, H1812–H1822. [DOI] [PMC free article] [PubMed] [Google Scholar]
- Nabauer M, Beuckelmann DJ & Erdmann E (1993). Characteristics of transient outward current in human ventricular myocytes from patients with terminal heart failure. Circ Res 73, 386–394. [DOI] [PubMed] [Google Scholar]
- Nattel S (2010). When normal ECG variants turn lethal. Nature Med 16, 646–647. [DOI] [PubMed] [Google Scholar]
- Nerbonne JM & Kass RS (2005). Molecular physiology of cardiac repolarization. Physiol Rev 85, 1205–1253. [DOI] [PubMed] [Google Scholar]
- Noble D (1960). Cardiac action and pacemaker potentials based on the Hodgkin–Huxley equations. Nature 188, 495–497. [DOI] [PubMed] [Google Scholar]
- Noble D (1962a). A modification of the Hodgkin–Huxley equations applicable to Purkinje fibre action and pace‐maker potentials. J Physiol 160, 317–352. [DOI] [PMC free article] [PubMed] [Google Scholar]
- Noble D (1962b). The voltage dependence of the cardiac membrane conductance. Biophys J 2, 381–393. [DOI] [PMC free article] [PubMed] [Google Scholar]
- Noble D & Tsien RW (1972). The repolarization process of heart cells In Electrical Phenomena in the Heart, ed. de Mello WC, pp. 133–161. Academic Press Inc, New York. [Google Scholar]
- O'Hara T, Virág L, Varró A & Rudy Y (2011). Simulation of the undiseased human cardiac ventricular action potential: model formulation and experimental validation. PLoS Comput Biol 7, e1002061. [DOI] [PMC free article] [PubMed] [Google Scholar]
- Osborn JJ (1953). Experimental hypothermia: respiratory and blood pH changes in relation to cardiac function. Am J Physiol 175, 389–398. [DOI] [PubMed] [Google Scholar]
- Qu Z, Xie L, Olcese R, Karagueuzian HS, Chen PS, Garfinkel A & Weiss JN (2013). Early afterdepolarizations in cardiac myocytes: beyond reduced repolarization reserve. Cardiovasc Res 99, 6–15. [DOI] [PMC free article] [PubMed] [Google Scholar]
- Reuter H (1973). Divalent cations as charge carriers in excitable membranes. Prog Biophys Mol Biol 26, 1–43. [DOI] [PubMed] [Google Scholar]
- Roden DM (2004). Drug‐induced prolongation of the QT interval. N Engl J Med 350, 1013–1022. [DOI] [PubMed] [Google Scholar]
- Roden DM (2008). Repolarization reserve: a moving target. Circulation 118, 981–982. [DOI] [PubMed] [Google Scholar]
- Roden DM & Abraham RL (2011). Refining repolarization reserve. Heart Rhythm 8, 1749–1755. [DOI] [PMC free article] [PubMed] [Google Scholar]
- Roden DM & Yang T (2005). Protecting the heart against arrhythmias: potassium current physiology and repolarization reserve. Circulation 112, 1376–1378. [DOI] [PubMed] [Google Scholar]
- Romero L, Pueyo E, Fink M & Rodriguez B (2009). Impact of ionic current variability on human ventricular cellular electrophysiology. Am J Physiol Heart Circ Physiol 297, H1436–H1445. [DOI] [PubMed] [Google Scholar]
- Romero L, Trenor B, Yang PC, Saiz J & Clancy CE (2014). In silico screening of the impact of hERG channel kinetic abnormalities on channel block and susceptibility to acquired long QT syndrome. J Mol Cell Cardiol 72, 126–137. [DOI] [PMC free article] [PubMed] [Google Scholar]
- Rosso R, Adler A, Halkin A & Viskin S (2011). Risk of sudden death among young individuals with J waves and early repolarization: putting the evidence into perspective. Heart Rhythm 6, 923–929. [DOI] [PubMed] [Google Scholar]
- Rosso R, Glikson E, Belhassen B, Katz A, Halkin A, Steinvil A & Viskin S (2012). Distinguishing ‘benign’ from ‘malignant early repolarization’: the value of the ST‐segment morphology. Heart Rhythm 9, 225–229. [DOI] [PubMed] [Google Scholar]
- Saegusa N, Garg V & Spitzer KW (2013). Modulation of ventricular transient outward K+ current by acidosis and its effects on excitation‐contraction coupling. Am J Physiol Heart Circ Physiol 304, H1680–H1696. [DOI] [PMC free article] [PubMed] [Google Scholar]
- Sager PT, Gintant G, Turner JR, Pettit S & Stockbridge N (2013). Rechanneling the cardiac proarrhythmia safety paradigm: a meeting report from the cardiac safety research consortium. Am Heart J 167, 292–300. [DOI] [PubMed] [Google Scholar]
- Sah R, Ramirez RJ, Oudit GY, Gidrewicz D, Trivieri MG, Zobel C & Backx PH (2003). Regulation of cardiac excitation‐contraction coupling by action potential repolarization: role of the transient outward potassium current Ito . J Physiol 546, 5–18. [DOI] [PMC free article] [PubMed] [Google Scholar]
- Sampson KJ & Henriquez CS (2005). Electrotonic influences on action potential duration dispersion in small hearts: a simulation study. Am J Physiol Heart Circ Physiol 289, H350–H360. [DOI] [PubMed] [Google Scholar]
- Sarkar AX & Sobie EA (2011). Quantification of repolarization reserve to understand inter patient variability in the response to proarrhythmic drugs: a computational analysis. Heart Rhythm 8, 1749–1755. [DOI] [PMC free article] [PubMed] [Google Scholar]
- Sarkar AX, Christini DJ & Sobie EA (2012). Exploiting mathematical models to illuminate electrophysiological variability between individuals. J Physiol 590, 2555–2567. [DOI] [PMC free article] [PubMed] [Google Scholar]
- Silva J & Rudy Y (2005). Subunit interaction determines I Ks participation in cardiac repolarization and repolarization reserve. Circulation 112, 1384–1391. [DOI] [PMC free article] [PubMed] [Google Scholar]
- Spitzer KW, Pollard AE, Yang L, Zaniboni M, Cordeiro JM & Huelsing DJ (2006). Cell‐to‐cell electrical interactions during early and late repolarization. J Cardiovasc Electrophysiol 17, S8–S14. [DOI] [PubMed] [Google Scholar]
- Tadros R, Ton AT, Fiset C & Nattel S (2014). Sex differences in cardiac electrophysiology and clinical arrhythmias: epidemiology, therapeutics, and mechanisms. Can J Cardiol 30, 783–792. [DOI] [PubMed] [Google Scholar]
- Taggart P, Sutton PMI, Opthof T, Coronel R, Trimlett R, Pugsley W & Kallis P (2001). Transmural repolarisation in the left ventricle in humans during normoxia and ischaemia. Cardiovasc Res 50, 454–462. [DOI] [PubMed] [Google Scholar]
- Teutsch C, Kondo RP, Dederko DA, Chrast J, Chien KR & Giles WR (2007). Spatial distributions of Kv4 channels and KChiP2 isoforms in the murine heart based on laser capture microdissection. Cardiovasc Res 73, 739–749. [DOI] [PubMed] [Google Scholar]
- Tikkanen JT, Anttonen O, Junttila MJ, Aro AL, Kerola T, Rissanen HA, Reunanen, Huikuri HV (2009). Long‐term outcome associated with early repolarization on electrocardiography. N Engl J Med 361, 2529–2537. [DOI] [PubMed] [Google Scholar]
- Thomsen MB (2007). Double pharmacological challenge on repolarization opens new avenues for drug safety research. Br J Pharmacol 151, 909–911. [DOI] [PMC free article] [PubMed] [Google Scholar]
- Thomsen MB, Oros A, Schoenmakers M, van Opstal JM, Maas JN, Beekman JDM & Mos MA (2007). Proarrhythmic electrical remodelling is associated with increased beat‐to‐beat variability of repolarisation. Cardiovasc Res 73, 521–530. [DOI] [PubMed] [Google Scholar]
- Varkevisser R, Wijers SC, van der Heyden MAG, Beekman JDM, Meine M & Vos MA (2012). Beat‐to‐beat variability of repolarization as a new biomarker for proarrhythmia in vivo. Heart Rhythm 9, 1718–1726. [DOI] [PubMed] [Google Scholar]
- Varro A & Baczko I (2011). Cardiac ventricular repolarization reserve: a principle for understanding drug‐related proarrhythmic risk. Br J Pharmacol 164, 14–36. [DOI] [PMC free article] [PubMed] [Google Scholar]
- Vicente J, Johannesen L, Mason JW, Crumb WJ, Pueyo E, Stockbridge N & Strauss DG (2015). Comprehensive T wave morphology assessment in a randomized clinical study of dofetilide, quinidine, ranolazine and verapamil. J Am Heart Assoc 4, e001615. [DOI] [PMC free article] [PubMed] [Google Scholar]
- Walmsley J, Rodriguez JF, Mirams GR, Burrage K, Efimov IR & Rodriguez B (2013). mRNA expression levels in failing human hearts predict cellular electrophysiological remodeling: a population‐based simulation study. PLoS One 8, e56359. [DOI] [PMC free article] [PubMed] [Google Scholar]
- Wang Y, Cheng J, Joyner RW, Wagner MB & Hill JA (2006). Remodeling of early‐phase repolarization: a mechanism of abnormal impulse conduction in heart failure. Circulation 113, 1849–1856. [DOI] [PMC free article] [PubMed] [Google Scholar]
- Weidmann S (1951). Effect of current flow on the membrane potential of cardiac muscle. J Physiol 115, 227–236. [DOI] [PMC free article] [PubMed] [Google Scholar]
- Weidmann S (1957). Resting and action potentials of cardiac muscle. Ann N Y Acad Sci 65, 663–678. [DOI] [PubMed] [Google Scholar]
- Wellens HJ (2008). Early repolarization revisited. N Engl J Med 358, 2063–2065. [DOI] [PubMed] [Google Scholar]
- Wood EH, Heppner RL & Weidmann S (1969). Inotropic effects of electric currents. Circ Res 24, 409–445. [DOI] [PubMed] [Google Scholar]
- Xiao L, Xiao J, Luo X, Lin H, Wang Z & Nattel S (2008). Feedback remodeling of cardiac potassium current expression: a novel potential mechanism for control of repolarization reserve. Circulation 118, 983–992. [DOI] [PubMed] [Google Scholar]
- Xiao L, Zhang L, Han W, Wang Z & Nattel S (2006). Sex‐based transmural differences in cardiac repolarization and ionic‐current properties in canine left ventricles. Am J Physiol Heart Circ Physiol 291, H570–H580. [DOI] [PubMed] [Google Scholar]
- Xie Y, Sato D, Garfinkel A, Qu Z & Weiss JN (2010). So little source, so much sink: requirements for afterdepolarizations to propagate in tissue. Biophys J 99, 1408–1415. [DOI] [PMC free article] [PubMed] [Google Scholar]
- Yan G, Lankipalli RS, Burke JF, Musco S, Kowey PR (2003). Ventricular repolarization components on the electrocardiogram: cellular basis and clinical significance. J Am Coll Cardiol 42, 401–409. [DOI] [PubMed] [Google Scholar]
- Yang T, Chun YW, Stroud DM, Mosley JD, Knollmann BC, Hong C & Roden DM (2014). Screening for acute IKr block is insufficient to detect Torsades de Pointes liability: role of late sodium current. Circulation 130, 224–234. [DOI] [PMC free article] [PubMed] [Google Scholar]
- Yang PC, Song Y, Giles WR, Horvath B, Chen‐Izu Y, Belardinelli L, Rajamani S & Clancy CE (2015). A computational modelling approach combined with cellular electrophysiology data provides insights into the therapeutic benefit of targeting the late Na+ current. J Physiol 593, 1429–1442. [DOI] [PMC free article] [PubMed] [Google Scholar]
- Yu H, McKinnon D, Dixon JE, Gao J, Wymore R, Cohen IS, Danilo P Jr, Shvilkin A, Anyukhovsky EP, Sosunov EA, Hara M & Rosen MR (1999). Transient outward current, Ito1, is altered in cardiac memory. Circulation 99, 1898–1905. [DOI] [PubMed] [Google Scholar]
- Zaniboni M (2011). 3D current‐voltage‐time surfaces unveil critical repolarization differences underlying similar cardiac action potentials: A model study. Math Biosci 233, 98–110. [DOI] [PubMed] [Google Scholar]
- Zaniboni M (2012). Late phase of repolarization is autoregenerative and scales linearly with action potential duration in mammals ventricular myocytes: a model study. IEEE Trans Biomed Eng 59, 226–233. [DOI] [PubMed] [Google Scholar]
- Zaniboni M, Pollard AE, Yang L & Spitzer KW (2000). Beat‐to‐beat repolarization variability in ventricular myocytes and its suppression by electrical coupling. Am J Physiol Heart Circ Physiol 278, H677–H687. [DOI] [PubMed] [Google Scholar]
- Zhao Z, Xie Y, Wen H, Xiao D, Allen C, Fefelova N, Dun W, Boyden PA, Qu Z & Xie L (2012). Role of the transient outward potassium current in the genesis of early afterdepolarizations in cardiac cells. Cardiovasc Res 95, 308–316. [DOI] [PMC free article] [PubMed] [Google Scholar]
- Zhou Q, Bett GCL & Rasmusson RL (2012). Markov models of use‐dependence and reverse use‐dependence during the mouse cardiac action potential. PLoS One 7, e42295. [DOI] [PMC free article] [PubMed] [Google Scholar]