

Abstract
The influenza A and B viruses are the primary cause of seasonal flu epidemics. Common to both viruses is the M2 protein, a homotetrameric transmembrane proton channel that acidifies the virion after endocytosis. Although influenza A M2 (AM2) and B M2 (BM2) are functional analogs, they have little sequence homology, except for a conserved HXXXW motif, which is responsible for proton selectivity and channel gating. Importantly, BM2 contains a second titratable histidine, His-27, in the tetrameric transmembrane domain that forms a reverse WXXXH motif with the gating tryptophan. To understand how His-27 affects the proton conduction property of BM2, we have used solid-state NMR to characterize the pH-dependent structure and dynamics of His-27. In cholesterol-containing lipid membranes mimicking the virus envelope, 15N NMR spectra show that the His-27 tetrad protonates with higher pKa values than His-19, indicating that the solvent-accessible His-27 facilitates proton conduction of the channel by increasing the proton dissociation rates of His-19. AM2 is inhibited by the amantadine class of antiviral drugs, whereas BM2 has no known inhibitors. We measured the N-terminal interhelical separation of the BM2 channel using fluorinated Phe-5. The interhelical 19F-19F distances show a bimodal distribution of a short distance of 7 Å and a long distance of 15–20 Å, indicating that the phenylene rings do not block small-molecule entry into the channel pore. These results give insights into the lack of amantadine inhibition of BM2 and reveal structural diversities in this family of viral proton channels.
Keywords: influenza virus, ion channel, membrane protein, solid state NMR, structural biology
Introduction
The influenza B virus is a component of seasonal flu infections and becomes prevalent in the spring months (1). Critical to the viral lifecycle is the M2 protein, a single-pass, membrane spanning, homo-tetrameric proton channel responsible for acidifying the virion after endocytosis; acidification of the viral interior initiates uncoating (2). In both influenza A and B M2 proteins, an HXXXW motif is conserved in the TM domain, in which the His is responsible for proton selectivity and acid activation (3, 4), whereas the Trp ensures asymmetric proton conduction from the N terminus to the C terminus (5, 6). AM23 is inhibited by the amantadine class of antiviral drugs, whereas BM2 has no known inhibitors. The structure and dynamics of AM2 and its drug-resistant mutants have been extensively studied to understand the atomic basis of proton conduction (7–12), channel gating (6, 13), and drug inhibition (14–17). In comparison, much less effort has been directed toward studying the BM2 channel (18–20), which has little sequence homology with AM2. Thus, BM2 presents a unique opportunity to understand how different chemical systems perform similar functions. Central to understanding the proton conduction mechanism of AM2 and BM2 channels are the proton transfer equilibria and dynamics at the conserved HXXXW motif and how these are affected by the amino acid residues surrounding this motif.
One of the most important sequence differences between BM2 and AM2 channels is the presence of a second histidine, His-27, in BM2. This histidine is located three residues C-terminal to Trp-23, thus forming a reverse WXXXH motif; the corresponding position in AM2 is a non-titratable Arg-45. Although mutation of the proton-selective His-19 to Cys abolishes proton conduction altogether, as seen in electrophysiological assays on whole cells (21), mutation of His-27 to Ala attenuates proton conduction only by ∼26% in liposome proton flux assays (19). The mechanism with which His-27 influences proton conduction is currently unknown. Recently, using magic-angle-spinning (MAS) solid-state NMR (SSNMR), we measured the proton-dissociation equilibrium constants (pKa values) of the His-19 tetrad and found them to be one pH unit lower than the pKa values of the His-37 tetrad in AM2 (18). This large pKa change is surprising, and we hypothesized that the C-terminal His-27 may increase the proton dissociation rate of His-19, thereby stabilizing the neutral state of His-19. If this model were correct, then we would expect His-27 to exhibit higher pKa values than His-19.
Although high-resolution structures of the AM2 TM domain have been determined using multiple techniques (8, 9, 11, 12, 14, 16, 22), the structure of the BM2 channel has been much less characterized. To date, there is only a single structure of BM2, solved by solution NMR in DHPC (1,2-dihexanoyl-sn-glycero-3-phosphocholine) micelles (19). The structure shows the channel as a coiled-coil tetramer, with three serine residues (Ser-9, Ser-12, Ser-16) lining the pore and a bulky phenylalanine ring (Phe-5) protruding into the pore at the N terminus. This structure suggests two possible reasons for the inability of amantadine drugs to block BM2: either the polar pore-lining serine residues disfavor binding of the nonpolar drug or the Phe-5 side chains block drug entry into the channel. Further structural studies of BM2 in lipid bilayers are needed to determine which mechanism is operative, which would help the development of antiviral drugs against influenza B infections.
SSNMR spectroscopy is a powerful method for elucidating the atomic structures and dynamics of membrane proteins in native-like phospholipid bilayers. Herein, we employ SSNMR to measure the pH-dependent structure and proton-transfer dynamics of His-27 and the interhelical separation of the channel at Phe-5. The measurements were conducted on BM2(1–33), which has been shown to reproduce the activity of full-length BM2 (19, 23). 13C and 15N chemical shifts of His-27 as a function of pH revealed the proton dissociation equilibria of the His-27 tetrad, whereas fluorine-tagged Phe-5 allowed interhelical separation of the N terminus to be measured. The data support the hypothesis that His-27 siphons protons off His-19, whereas the Phe-5 side chains are spaced too far apart to block small-molecule entry into the BM2 pore.
Results
The BM2 TM domain adopted a pH-independent α-helical conformation
We measured the 13C and 15N chemical shifts of several residues distributed throughout BM2(1–33) to evaluate the backbone conformation as a function of pH. Fig. 1A shows 2D double-quantum (DQ) and single-quantum (SQ) correlation spectra (called INADEQUATE; Ref. 24) of the peptide, measured at pH 5.5 and pH 7.3. With a short dipolar recoupling time of 0.50–0.57 ms for 13C-13C DQ excitation and reconversion, the 2D spectrum exhibits only correlation peaks for directly bonded carbons, thus allowing resonance assignment. Ser-9 shows similar Cα and Cβ chemical shifts, characteristic of an α-helical conformation. Similarly, Ile-14 (64.1 ppm, 36.0 ppm), Leu-18 (55.8 ppm, 40.2 ppm), and Ala-22 (53.4 ppm, 17.0 ppm) adopt α-helical Cα and Cβ chemical shifts, which do not change with pH. Thus, the backbone conformation of the BM2 TM domain is independent of pH and is α-helical in the cholesterol-containing membrane, consistent with the result of a previous study using different site-specifically labeled residues (18).
Figure 1.

2D 13C-13C INADEQUATE spectra of membrane-bound BM2(1–33) measured at 243 K. A, 2D spectra at pH 5.5 and pH 7.3. B, His-27 chemical shifts as a function of pH. The Ser-9, Ile-14, Leu-18, and Ala-22 chemical shifts are insensitive to pH, whereas His-27 shows pH-dependent changes of Cα and Cβ chemical shifts.
His-27 exhibited pH-dependent chemical structures
In contrast to the non-titratable residues, His-27 exhibits clear pH-dependent Cα and Cβ chemical shifts. At high pH (Fig. 1B), two sets of α-helical Cα and Cβ chemical shifts are observed and can be assigned to the neutral τ (57.8 ppm, 29.1 ppm) and π (56.4, ppm, 25.9 ppm) tautomers through correlation peaks with the side-chain Cγ and Cδ2 (see Fig. 3B below). At low pH, two sets of Cα-Cβ cross-peaks are also resolved but at lower chemical shifts. These peaks can be assigned to cationic His-27 based on their correlations with the Cγ and Cδ2 chemical shifts: the cross-peaks at 57.0 ppm and 25.8 ppm can be assigned to the +4 tetrad (cat4), whereas the 54.2 ppm and 25.1 ppm cross-peaks can be assigned to the +3 tetrad (cat3).
Figure 3.

2D 15N-13C and 13C-13C correlation spectra of His-27 side chain in membrane-bound BM2(1–33). A, the 15N-13C spectra were measured at 243 K under 9 kHz MAS using 15N-13C REDOR mixing times of 0.3–0.6 ms. At high pH mainly τ tautomer cross-peaks (red), and Nϵ2H-Cδ2 and Nδ1-Cγ are observed. The π tautomer (blue) 15Nδ1H chemical shift largely overlaps with the τ 15Nϵ2H peak but can be assigned based on the weak cross-peaks with π 13Cγ (∼126 ppm) and 13Cδ2 (∼124 ppm). B, the 13C-13C spectra were measured at 243 K under 7 kHz MAS using a dipolar-assisted rotational resonance (DARR) mixing time of 100 ms. The Cβ correlation peaks allow assignment of cat3 and cat4 states at low pH and unambiguous assignment of the neutral τ and π tautomers at high pH.
Fig. 2 shows 1D 13C spectra of the His-27 side chain at low temperature where motion and chemical exchange were frozen and at high temperature where proton-transfer dynamics and reorientational motion can occur. At low temperature, the pH 8.0 and 7.3 spectra are dominated by neutral histidine signals such as the Cδ2 chemical shifts of τ (114.7 ppm) and π (124.2 ppm) tautomers and the Cγ peak of the π tautomer (127.8 ppm). These neutral histidine signals persist down to pH 6.0, below which cationic histidine signals appear: the τ Cδ2 peak broadens due to partial overlap with the cationic Cδ2 peak (∼117 ppm); the Cϵ1 peak broadens and shifts to ∼134 ppm; the lipid C=C resonance is partly overlapped by the cationic Cγ peak at ∼129 ppm. At pH 5.5, the spectrum is dominated by cationic histidine signals. The high-temperature 13C spectra follow the same trends, except for the Cδ2 peak, which resonates at ∼118 ppm at all pH values, indicating that all three species (τ, π, cationic) interconvert to give an average chemical shift (17).
Figure 2.
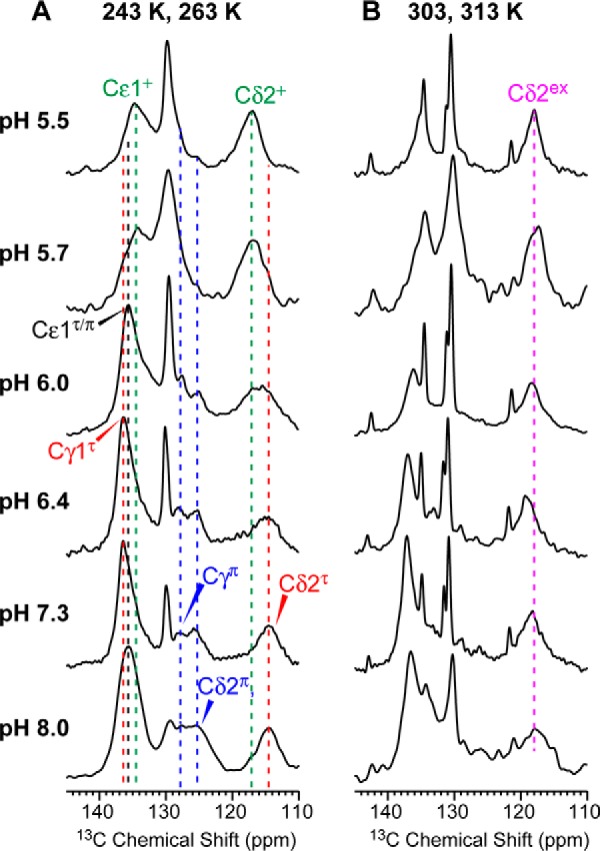
13C CP-MAS spectra of His-27 in VM+ membrane-bound BM2(1–33) as a function of pH. The spectra were measured at 243 or 263 K (A) and 303 or 313 K (B) under 7–14.5-kHz MAS. At low temperature, the Cδ2 chemical shift differed significantly between low and high pH, with cationic histidine (∼117 ppm, +) present at low pH and neutral tautomers (∼114 ppm, τ) present at high pH. At high temperature, a Cδ2 exchange peak was observed at ∼118 ppm, indicating interconversion among all three histidine species.
2D 15N-13C correlation spectra (Fig. 3A) allowed the assignment of the 15N chemical shifts of Nδ1 and Nϵ2 in the three histidine species. At low pH, only a single 15N chemical shift was observed (∼176 ppm) for Nδ1H and Nϵ2H. At high pH, the τ tautomer was dominant, as seen by the Nϵ2-Cδ2 (165.2 ppm, 114.7 ppm) and Nδ1-Cγ (248.0 ppm, 138.6 ppm) correlations, whereas the π tautomer had much lower concentrations, as shown by the low intensities of the Nδ1H-Cγ (168.1 ppm, 127.8 ppm) and Nϵ2-Cδ2 (248.0 ppm, 124.2 ppm) cross-peaks.
His-27 had different proton exchange equilibria from His-19
We measured the 15N spectra of His-27-labeled BM2(1–33) at six pH values to quantify the proton-dissociation constants. For the tetrameric channel, His-27 can be treated as a tetraprotic acid, with a maximum of four proton-dissociation constants. As shown before, the ratio of the protonated and unprotonated 15N intensities, INH/IN, can be used to extract the pKa values (25). Fig. 4A shows low-temperature 15N spectra as a function of pH. The 250-ppm 15N peak resulted from unprotonated imidazole nitrogen, whereas the 170-ppm peak was due to protonated nitrogens. At high pH, a relatively sharp 15N peak at ∼167 ppm was detected and can be assigned to τ tautomer Nϵ2H and π tautomer Nδ1H. At the intermediate pH of 6.0, both neutral and cationic NH peaks were observed, whereas below pH 6.0 only cationic NH signals were observed. As expected, the 250-ppm intensity decreased progressively from high to low pH, giving a high [His]/[HisH+] ratio of 7.7 at pH 8.0 but a low ratio of 0.09 at pH 5.5 (Fig. 5, A and B, Table 1). Fitting these histidine concentration ratios yielded four pKa values of 7.9 ± 0.1, 5.9 ± 0.1, 5.9 ± 0.1, and 5.8 ± 0.1. Thus, the His-27 tetrad already acquired a +1 charge at ∼pH 8, and the +1 charge persisted to ∼pH 5.9, when the other three His-27 residues rapidly protonated to reach the fully charged +4 tetrad (Fig. 5C).
Figure 4.
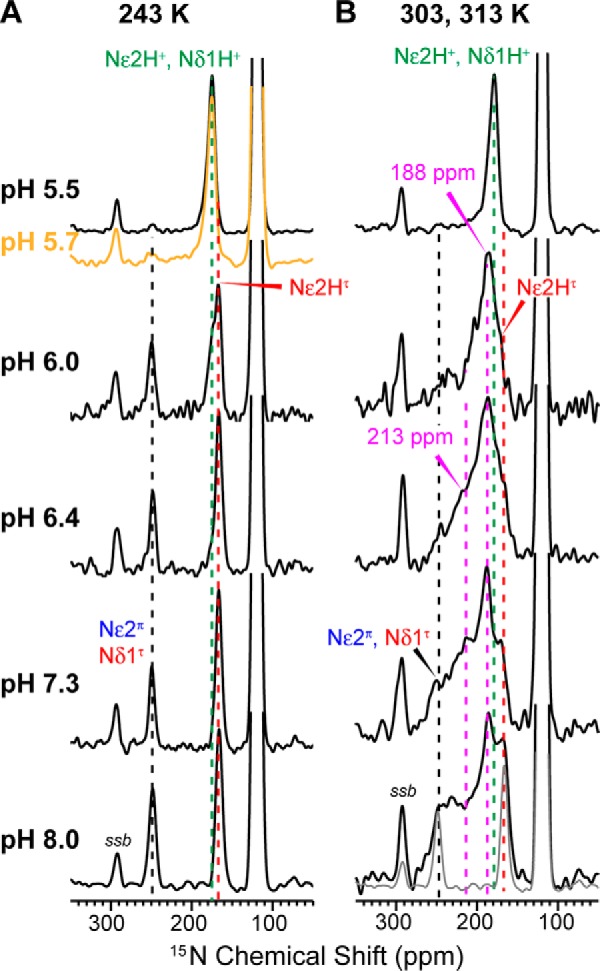
15N CP-MAS spectra of the His-27 side chain as a function of pH, measured at 243 K (A) and 303 K (B) or 313 K. A, the non-protonated (∼250 ppm) 15N peak shows the expected intensity decrease with decreasing pH, indicating higher populations of cationic His-27. The chemical shifts of 15Nϵ2 and 15Nδ1 of the neutral τ and π tautomers are indistinguishable, in contrast to previous observations of His-19 in BM2 and His-37 in AM2. B, at high temperature, the spectra show broad exchange peak intensities at 170–250 ppm. The 290-ppm peak seen in all spectra is a spinning sideband (ssb) of backbone amide 15N.
Figure 5.

Determination of His-27 tetrad pKa values from the imidazole 15N spectra. A, relative intensities of protonated (INH) and non-protonated (IN) imidazole nitrogens as a function of pH. B, ratio of neutral to cationic histidine concentrations as a function of pH. His-27 data (black) are compared with previously measured His-19 (red) data (18). The gray line is the best fit of the H27 data assuming a single pKa for all four histidines. This model does not fit the data well. C, populations of charged His-27 tetrads as a function of pH. The intercepts between adjacent charge states correspond to the specific pKa values.
Table 1.
pH-dependent His-27 15N peak intensities and neutral-to-cationic histidine concentration ratios
| pH | INH/IN | κ | [His]/[HisH+] |
|---|---|---|---|
| 5.5 ± 0.1 | 35 ± 10 | 1.47 ± 0.09 | 0.09 ± 0.03 |
| 5.70 ± 0.04 | 18 ± 8 | 1.33 ± 0.06 | 0.16 ± 0.07 |
| 6.0 ± 0.1 | 2.7 ± 0.5 | 1.47 ± 0.09 | 2.4 ± 0.5 |
| 6.4 ± 0.1 | 2.4 ± 0.3 | 1.41 ± 0.08 | 2.9 ± 0.4 |
| 7.3 ± 0.3 | 2.1 ± 0.1 | 1.6 ± 0.1 | 6.4 ± 0.5 |
| 8.0 ± 0.1 | 1.6 ± 0.1 | 1.27 ± 0.04 | 7.7 ± 0.5 |
At high temperature, the His-27 imidazole 15N spectra showed extensive chemical exchange, with strong intensities at averaged chemical shifts of 170–250 ppm (Fig. 4B). In stark contrast to the proton-selective His-19 in BM2 and His-37 in AM2, the exchange intensities of His-27 were visible already at pH 8 and pH 7.3, where His-19 and His-37 showed no exchange averaging. Moreover, the His-27 exchange band was much broader than His-19 and His-37, indicating a broad distribution of equilibrium constants. As the pH lowered, both the exchange intensities and the exchange line widths decreased, consistent with the decreasing neutral histidine population, which reduced the fraction of histidines undergoing exchange. A relatively narrow exchange peak was observed at 188 ppm and was previously assigned to Nϵ2 exchange among τ, π, and cationic histidine (17), indicating that the exchange populations are similar between His-27 and His-19.
Phe-5 interhelical distances were large at both low and high pH
We measured interhelical 19F-19F distances between 4-19F-Phe-5 using the CODEX experiment (26, 27). Representative control (S0, black) and dephased (S, red) spectra at a mixing time of 500 ms are shown in Fig. 6A for the pH 5.5 and pH 8.0 samples. Although the S/S0 ratio of the isotropic peak (centerband) is smaller for the low-pH sample than the high-pH sample, when the sideband intensities were taken into account, the average S/S0 values are similar between the two. Fig. 6B showed the full CODEX decay curves, with final S/S0 values of 0.41 ± 0.10 at pH 5.5 and 0.45 ± 0.10 at pH 8.0, measured at a mixing time of 2 s. Longer mixing times could not be measured as T1 relaxation causes prohibitively low sensitivity.
Figure 6.

19F CODEX data of 4-19F-Phe-5 labeled BM2(1–33) for determining interhelical distances at the N-terminal opening of the tetramer. A, representative CODEX spectra measured at 235 K under 10 kHz MAS. The control (S0, black) and dephased (S, red) spectra at pH 5.5 and pH 8.0 were measured at a mixing time of 500 ms. B, normalized CODEX intensities (S/S0) as a function of mixing time. The high and low pH samples show similar dephasing, indicating similar interhelical separations. The black dashed curve is the best-fit assuming a square geometry, whereas blue curves show the two distances that provide the best-fit assuming a rectangular geometry. All distance components are Gaussian-weighted (GW). C, r.m.s.d. between simulated rectangular-geometry CODEX curves as a function of distances (r1, r2) and the measured pH 5.5 data. D, structural model using the PDB 2KIX backbone showing Phe-5 with χ1 angles of +65°, −65°, +60°, −60°, which forms a rectangle geometry that satisfies the measured distances. E, simulated CODEX curve (magenta) for a weighted average of two square geometries, overlaid with the best-fit rectangular-geometry dephasing curve. The long-distance component is satisfied by a Phe-5 χ1 angle of −45°, whereas the short-distance component is satisfied using a χ1 angle of −135° to −145.
The measured CODEX decays show an initial fast decay and a slower decay at longer mixing times, indicating a distribution of interfluorine distances. Consistently, simulations assuming a symmetric 4-spin system (i.e. a square model) did not fit the data well (Fig. 6B). A dimer model involving only two spins also did not fit the data, as the observed final S/S0 intensities were well below the value of 0.5 expected for a dimer. The data thus indicate an asymmetric 4-spin geometry that can be either a rectangular geometry or a combination of two square geometries. For the rectangular model, assuming a Gaussian distribution with a standard deviation of 1 Å for each distance component, we found a best fit with two nearest-neighbor distances of 7 Å and 15 Å at both pH values (Fig. 6C). Here the longer distance is a lower bound, as the root-mean-square deviation (r.m.s.d.) between the simulated and experimental CODEX curves were insensitive to the longer distance up to 20 Å, reflecting the well known low precision of measuring weak dipolar couplings. For the model of two square geometries, a mixture of 60% of a square with a side length of 7.0 Å and 40% of a square with a side length of 15.3 Å gave the best fit to the experimental data (Fig. 6E). However, this scenario of a sharp bimodal distribution of two Phe-5 conformations to generate two very different interhelical distances is unlikely, as only a single 19F chemical shift was observed for Phe-5, and the 13C chemical shifts of non-titratable residues in the peptide also did not exhibit multiplicity. The 19F chemical shifts are highly sensitive to the local environment; thus the presence of two distinct populations of square geometries would be expected to give rise to two 19F peaks, which was not observed. Therefore, the rectangular model is the more likely reason for the biexponential decay of the CODEX intensities.
Based on the solution NMR backbone structure (19) (PDB code 2KIX), we varied the χ1 torsion angle of Phe-5 to satisfy the measured interhelical 19F-19F distances. Two χ1 angles of +60° and −60°, placed on neighboring helices, reproduced the experimental data, with inter-19F Phe-5–Phe-5 distances of ∼7.5 Å for the short sides and ∼19.5 Å for the long sides (Fig. 6D), which fell within the minimum r.m.s.d. valley (Fig. 6C). For comparison, the χ1 angles that satisfied the bimodal square model were ∼140° (t) for the 7.5 Å distance and either 60° (p) or −60° (m) for an ∼14.5 Å nearest-neighbor distance.
Discussion
The current data show similarities as well as important differences between His-27 in the reverse WXXXH motif and His-19 in the HXXXW motif of BM2 (18). First, the 13C and 15N chemical shifts of the His-27 imidazole, in composite, are similar to the chemical shifts of His-19 in BM2 and His-37 in AM2, as dictated by the chemical structures of histidine. The His-27 tetrad shows coexistence of the +3 and +4 charge states at low pH, also similar to His-19 (18) and His-37 in AM2 (7, 25) (Fig. 5C). However, in contrast to the proton-selective histidines in BM2 and AM2, the pH at which cationic His-27 dominated and neutral His-27 diminished was much higher for the solvent-exposed His-27 tetrad. The transition occurred at about pH 6, the inflection point of the titration curve (Fig. 5B). Specifically, the unprotonated 15N signal disappeared at pH 5.5 for His-27, while it persisted down to pH 4.5 for His-19 (18). The titration behavior of His-27 partly resembles amino acid histidine in solution, which has a pKa of 6.1 (28), suggesting that His-27 is sufficiently solvent-accessible that it protonates similarly to free histidine in solution. However, the His-27 tetrad differed from free histidine in that it had a high first pKa of 7.9; in other words, the His-27 tetrad already harbored a +1 charge at neutral pH. Most importantly, these data indicate that His-27 protonated at ∼1 pH unit higher (average pKa = 6.4) than His-19 (average pKa = 5.1). A previous study measuring pH-dependent Trp fluorescence emission spectra, UV resonance Raman spectra, circular dichroism spectra, and proton conductance of wild type and H19A and H27A mutants of BM2 identified a pKa of ∼7.6 for His-27 and ∼6.5 for His-19 (20). The current SSNMR data of His-27 supported the previous conclusion and added further quantitative information about the three acidic pKa values. The previous study used POPE/POPS (1-palmitoyl-2-oleoyl-sn-glycero-3-phosphoethanolamine/1-palmitoyl-2-oleoyl-sn-glycero-3-phosphoserine (1:1)) liposomes, where the negatively charged POPS lipids are expected to favor proton association to both histidines and thus elevate the pKa values.
The fact that His-27 is protonated at higher pH than His-19 supports the model that it can siphon off protons from His-19, stabilizing neutral His-19 and depressing its pKa values. In this way His-27 can facilitate proton release from the HXXXW dyad and increase the proton conduction to the C terminus, which is consistent with the mutagenesis result that H27A mutation decreases the channel activity (19, 20).
The 19F CODEX data of 4-19F-Phe-5 revealed unexpected asymmetry in the oligomeric assembly of the N terminus of the BM2 channel. The solution NMR structure of DHPC micelle-bound BM2(1–33) (19) shows the Phe-5 side chain points into the pore, with a χ1 angle of ∼180°. This conformation suggests that the Phe-5 side chain may obstruct the pore, which may partly explain the inability of amantadine drugs to bind BM2 (14, 15). The current 19F distance data rule out this model. The CODEX decay curves at both high and low pH fit well to a rectangular geometry with a short distance of 7 ± 1 Å and a long distance of 15–20 Å. Both distances are too large to block the pore. Therefore, these data imply that the lack of binding of hydrophobic adamantane drugs to BM2 results from the polar character of the channel, with three serine residues lining the pore (2, 19, 21).
The asymmetric interhelical distances found in the Phe-5 19F CODEX data differ qualitatively from the CODEX result of 5-19F-Trp-41 in AM2, which show a single nearest-neighbor distance of 11–12 Å, indicating a C4-symmetric square geometry (13, 29). Interestingly, distance asymmetry was also previously observed at Val-27 in AM2. When Val-27 was mutated to 4-19F-Phe, the 19F CODEX data showed a bimodal decay that corresponds to an equimolar mixture of a 5.3 Å distance and a 12.3 Å distance (29). The fact that both AM2 and BM2 channels show asymmetric interhelical separations at the N terminus is intriguing, but the reason for this asymmetry is unclear at present. Since no chemical shift multiplicity was observed for the non-titratable residues in these samples, the structural heterogeneity more likely occurs in the side chains rather than the backbone. The near terminal location of Phe-5 in BM2 and V27F in AM2 makes it possible for these side chains to adopt flexible χ1 torsion angles. However, Trp-41 is also located near the C terminus of the TM domain but does not exhibit such an asymmetry. Another possibility is that the 4-19F-Phe tag may cause perturbation to the helix bundle, but the lack of distance asymmetry for the 5-19F-Trp tag of the indole ring also disfavors this scenario. Future studies using 13C,15N-labeled recombinant protein samples will be useful for determining whether there is functionally important side-chain asymmetry and the high-resolution structure of BM2 in lipid bilayers.
Conclusions
The present SSNMR data give new insights into atomic-level structural and dynamical details of proton conduction through the BM2 channel and the lack of amantadine inhibition of this protein. The pKa values of His-27 tetrad are found to be 7.9, 5.9, 5.9, and 5.8. Thus, the C-terminal His-27 has much higher pKa values than the interior, proton-selective His-19, explaining the stabilization of neutral His-19 compared with His-37 in the influenza A M2 channel. We conclude that His-27 speeds up proton dissociation from the HXXXW motif, thus facilitating proton conduction by BM2. Interhelical 19F-19F distance measurements indicate that Phe-5 side chains at the N terminus of the TM domain are separated by 7 Å and 15–20 Å from each other; thus, this residue does not block small molecules from entering the channel pore. Design of BM2 inhibitors should, therefore, target the polar pore-lining surface of the BM2 channel.
Experimental procedures
Synthesis of BM2(1–33) peptides
The TM domain (residues 1–33: MLEPFQILSISSFILSALHFMAWTIGHLNQIKR) of the B/Maryland/1/2001 strain of the influenza virus was synthesized using Fmoc (fluorenylmethyloxycarbonyl) chemistry as described previously (15, 17, 18). Uniformly 13C,15N-labeled amino acids (Sigma and Cambridge Isotope Laboratories) were incorporated at Ser-9, Ile-14, Leu-18, Ala-22, and His-27. 4-19F-Phenylalanine (Sigma) was incorporated at Phe-5.
Membrane sample preparation
Isotopically labeled BM2(1–33) peptide was reconstituted into a virus-mimetic (VM+) membrane, consisting of POPC, POPE, sphingomyelin, and cholesterol at molar fractions of 25.6%, 25.6%, 25.6%, and 23.1%, respectively. The peptide:lipid molar ratio was 1:13.3. The lipids were co-dissolved in chloroform and methanol, whereas the peptide was dissolved in ∼500 μl of 2,2,2-trifluoroethanol (TFE). Nitrogen gas was used to concentrate the lipid solution to ∼1 ml then added to the peptide/TFE solution. The solvent was removed under nitrogen gas and placed under a room temperature vacuum overnight. The dried lipid/peptide mixture was then lyophilized for 3+ h to fully remove residual TFE and TFA. The dried lipid/peptide powder was resuspended in 3 ml of the desired buffer and vortexed for 2 h followed by 8 freeze-thaw cycles between liquid nitrogen and a 35 °C water bath to create large multilamellar vesicles. The membrane pellets were collected by ultracentrifugation at 50,000 rpm at 4 °C for 4 h and allowed to dry slowly to 40 wt% water in a desiccator. The proteoliposome mixture was spun into 4 mm or 3.2 mm MAS rotors for solid-state NMR experiments.
Control of sample pH was crucial for accurate determination of the His-27 pKa values. The pH was measured at several stages during membrane sample preparation: during the initial buffer preparation, immediately before the addition of buffer to the lyophilized peptide/lipid mixture, after vortexing the mixture with buffer for 2 h, and a final check of the supernatant after ultracentrifugation. Reported pH values and errors are the average and standard deviation of these measurements. In cases where the pH of the lipid/peptide mixture deviated by up to 0.3 pH units from the pH of the original buffer, the mixture was dialyzed against 1 liter of the original buffer overnight using 1-kDa molecular weight cutoff dialysis tubing before centrifugation. A total of six samples at different pH values were prepared using the following buffers: pH 5.5 ± 0.1 (10 mm citric acid/citrate, 1 mm EDTA, 0.1 mm NaN3), pH 5.70 ± 0.04 (30 mm citric acid/citrate, 3 mm EDTA, 0.3 mm NaN3), pH 6.0 ± 0.1 (20 mm Bis-Tris/HCl, 1 mm EDTA, 0.1 mm NaN3), pH 6.4 ± 0.1 (10 mm Bis-Tris/HCl, 1 mm EDTA, 0.1 mm NaN3), pH 7.3 ± 0.3 (10 mm Tris/HCl, 1 mm EDTA, 0.1 mm NaN3), pH 8.0 ± 0.1 (10 mm Tris/HCl, 1 mm EDTA, 0.1 mm NaN3).
Solid-state NMR experiments
SSNMR experiments were carried out on Bruker Avance 400 MHz (9.4 tesla (T)), 600 MHz (14.1 T), and 800 MHz (18.8 T) spectrometers using 4 mm or 3.2 mm 1H/13C/15N or 1H/19F/13C MAS probes. Typical radiofrequency field strengths were 71–100 kHz for 1H, 55–71 kHz for 13C, 35–45 kHz for 15N, and 62–71 kHz for 19F. Chemical shifts were externally referenced to the CH2 signal of adamantane at 38.48 ppm on the tetramethylsilane (TMS) scale for 13C, the amide signal of N-acetylvaline at 122.0 ppm on the liquid ammonia scale for 15N, and the Teflon signal at −122.0 ppm for 19F.
1D 13C and 15N cross-polarization (CP) MAS spectra were measured between 243 K and 313 K. 13C CP experiments were measured at 9.4 T under 7–9-kHz MAS or at 18.8 T under 14.5-kHz MAS. A 90–100% ramp was applied to the 13C channel during a 1-ms 1H-13C spin lock. The 15N CP experiments were conducted at 9.4 T under 7-kHz MAS using a 1H-15N spin lock of 3 ms. To obtain adequate signal-to-noise ratios (SNR), 40,000–100,000 scans were averaged for the 15N spectra. 15N CP signal intensities were used to quantify the relative populations of protonated (∼170 ppm) and unprotonated (∼250 ppm) nitrogens in the His-27 side chain. To correct for differences in polarization transfer between the protonated and unprotonated nitrogens, the 1H-15N CP matching condition was optimized on a pH 8.5 histidine model compound (30) to maximize the intensity of the unprotonated 15N peak. The ratio of the integrated intensities between the protonated and unprotonated regions of this model compound, ranging from 1.27 to 1.58, was used as a correction factor for the unprotonated nitrogen signal intensity on BM2 samples when extracting the ratio of neutral to cationic His-27.
2D 13C-13C correlation spectra were measured using 100 ms of dipolar-assisted rotational resonance (31) mixing. 2D DQ INADEQUATE spectra were measured at 14.1 T and 243 K under 7- or 8-kHz MAS (24). The SPC5 (32) sequence was used for 13C-13C dipolar recoupling and DQ excitation and reconversion. 2D 15N-13C correlation spectra were measured at 9.4 T and 243 K under 9 kHz MAS using a REDOR pulse sequence (33) with mixing times of 0.3–0.6 ms.
19F CODEX (26) spectra were measured at 9.4 T and 235 K under 10 kHz MAS. The control (S0) and dephased (S) spectra were acquired within 1 h of each other to minimize changes in the experimental conditions over time. In the S experiments, the exchange mixing times (τm) were 50, 100, 200, 500, 1000, and 2000 ms, whereas the z-filter time (τz) was kept constant at 1 ms. The S0 experiments used the reverse, where τm was fixed at 1 ms, whereas τz varied between 50 ms and 2000 ms. To obtain adequate SNR, 9,000–32,000 scans were averaged. Uncertainties of the S/S0 values were propagated from the SNR of the spectra.
Extraction of His-27 pKa values
His-27 proton-dissociation constants were extracted from the 15N CP spectra as described before (18, 25). In brief, the signals of protonated and unprotonated His-27 side-chain 15N atoms were integrated from 200 to 150 ppm and from 265 to 236 ppm, respectively. The integration for the unprotonated nitrogen signal is multiplied by an experimentally measured correction factor, κ, which represents the lower CP efficiency of this atom. The neutral-to-cationic histidine ratio was calculated using:
| (Eq. 1) |
The neutral-to-cationic histidine ratios were fit to the following equation to extract the His-27 tetrad pKa values.
| (Eq. 2) |
Simulation of 19F CODEX curves and distance extraction
CODEX magnetization exchange curves were calculated using an exchange-matrix formalism for a four-spin system (34). The exchange rate constants are proportional to an overlap integral F(0) and the square of the 19F dipolar coupling constants, which depend on the 19F-19F distances in the tetramer. An F(0) value of 41 μs was used, determined from model-compound experiments at 10 kHz MAS. The dephasing curves for rectangular geometries with side lengths of 2–25 Å in 0.1 Å increments were calculated. The simulated curves were multiplied by Gaussian weights with a standard deviation of 1 Å and summed together to generate dephasing curves representing a weighted population of distances. The reported best-fit distance corresponds to the center of the Gaussian distribution. The best-fit simulation was obtained from the minimal r.m.s.d. between the calculated dephasing curves and the experimental curve.
Author contributions
M. H. and J. K. W. designed the study. J. W. synthesized the peptides. J. K. W. and A. A. S. prepared the samples and performed the NMR experiments. J. K. W., A. A. S., and M. H. analyzed the data and wrote the manuscript. All authors reviewed the results and edited and approved the final version of the manuscript.
This work was supported, in whole or in part, by National Institutes of Health Grant GM088204 (to M. H.). The authors declare that they have no conflicts of interest with the contents of this article. The content is solely the responsibility of the authors and does not necessarily represent the official views of the National Institutes of Health.
- AM2
- influenza A M2
- BM2
- influenza B M2
- VM+
- eukaryotic-mimetic membrane
- POPC
- 1-palmitoyl-2-oleoyl-sn-glycero-3-phosphocholine
- POPE
- 1-palmitoyl-2-oleoyl-sn-glycero-3-phosphoethanolamine
- TFE
- 2,2,2-trifluoroethanol
- MAS
- magic-angle spinning
- SSNMR
- solid-state NMR
- CP
- cross polarization
- REDOR
- rotational-echo double-resonance
- INADEQUATE
- incredible natural abundance double quantum transfer experiment
- CODEX
- centerband-only detection of exchange
- SQ
- single-quantum
- DQ
- double quantum
- SNR
- signal to noise ratio
- r.m.s.d.
- root-mean-square deviation
- Bis-Tris
- 2-[bis(2-hydroxyethyl)amino]-2-(hydroxymethyl)propane-1,3-diol
- DHPC
- 1,2-dihexanoyl-sn-glycero-3-phosphocholine.
References
- 1. Koutsakos M., Nguyen T. H., Barclay W. S., and Kedzierska K. (2016) Knowns and unknowns of influenza B viruses. Future Microbiol. 11, 119–135 [DOI] [PubMed] [Google Scholar]
- 2. Pinto L. H., and Lamb R. A. (2006) The M2 proton channels of influenza A and B viruses. J. Biol. Chem. 281, 8997–9000 [DOI] [PubMed] [Google Scholar]
- 3. Pinto L. H., Dieckmann G. R., Gandhi C. S., Papworth C. G., Braman J., Shaughnessy M. A., Lear J. D., Lamb R. A., and DeGrado W. F. (1997) A functionally defined model for the M2 proton channel of influenza A virus suggests a mechanism for its ion selectivity. Proc. Natl. Acad. Sci. U.S.A. 94, 11301–11306 [DOI] [PMC free article] [PubMed] [Google Scholar]
- 4. Betáková T., and Kollerová E. (2006) pH modulating activity of ion channels of influenza A, B, and C viruses. Acta Virol. 50, 187–193 [PubMed] [Google Scholar]
- 5. Mandala V. S., Liao S. Y., Kwon B., and Hong M. (2017) Structural basis for asymmetric conductance of the influenza M2 proton channel investigated by solid-state NMR spectroscopy. J. Mol. Biol. 429, 2192–2210 [DOI] [PMC free article] [PubMed] [Google Scholar]
- 6. Tang Y., Zaitseva F., Lamb R. A., and Pinto L. H. (2002) The gate of the influenza virus M2 proton channel is formed by a single tryptophan residue. J. Biol. Chem. 277, 39880–39886 [DOI] [PubMed] [Google Scholar]
- 7. Liao S. Y., Yang Y., Tietze D., and Hong M. (2015) The influenza M2 cytoplasmic tail changes the proton-exchange equilibria and the backbone conformation of the transmembrane histidine residue to facilitate proton conduction. J. Am. Chem. Soc. 137, 6067–6077 [DOI] [PMC free article] [PubMed] [Google Scholar]
- 8. Acharya R., Carnevale V., Fiorin G., Levine B. G., Polishchuk A. L., Balannik V., Samish I., Lamb R. A., Pinto L. H., DeGrado W. F., and Klein M. L. (2010) Structural mechanism of proton transport through the influenza A M2 protein. Proc. Natl. Acad. Sci. U.S.A. 107, 15075–15080 [DOI] [PMC free article] [PubMed] [Google Scholar]
- 9. Andreas L. B., Reese M., Eddy M. T., Gelev V., Ni Q. Z., Miller E. A., Emsley L., Pintacuda G., Chou J. J., and Griffin R. G. (2015) Structure and mechanism of the influenza A M218–60 dimer of dimers. J. Am. Chem. Soc. 137, 14877–14886 [DOI] [PMC free article] [PubMed] [Google Scholar]
- 10. Hu F., Luo W., and Hong M. (2010) Mechanisms of proton conduction and gating in influenza M2 proton channels from solid-state NMR. Science 330, 505–508 [DOI] [PMC free article] [PubMed] [Google Scholar]
- 11. Sharma M., Yi M., Dong H., Qin H., Peterson E., Busath D. D., Zhou H. X., and Cross T. A. (2010) Insight into the mechanism of the influenza A proton channel from a structure in a lipid bilayer. Science 330, 509–512 [DOI] [PMC free article] [PubMed] [Google Scholar]
- 12. Thomaston J. L., Alfonso-Prieto M., Woldeyes R. A., Fraser J. S., Klein M. L., Fiorin G., and DeGrado W. F. (2015) High-resolution structures of the M2 channel from influenza A virus reveal dynamic pathways for proton stabilization and transduction. Proc. Natl. Acad. Sci. U.S.A. 112, 14260–14265 [DOI] [PMC free article] [PubMed] [Google Scholar]
- 13. Williams J. K., Zhang Y., Schmidt-Rohr K., and Hong M. (2013) pH-dependent conformation, dynamics, and aromatic interaction of the gating tryptophan residue of the influenza M2 proton channel from solid-state NMR. Biophys. J. 104, 1698–1708 [DOI] [PMC free article] [PubMed] [Google Scholar]
- 14. Cady S. D., Schmidt-Rohr K., Wang J., Soto C. S., Degrado W. F., and Hong M. (2010) Structure of the amantadine binding site of influenza M2 proton channels in lipid bilayers. Nature 463, 689–692 [DOI] [PMC free article] [PubMed] [Google Scholar]
- 15. Cady S. D., Wang J., Wu Y., DeGrado W. F., and Hong M. (2011) Specific binding of adamantane drugs and direction of their polar amines in the pore of the influenza M2 transmembrane domain in lipid bilayers and dodecylphosphocholine micelles determined by NMR spectroscopy. J. Am. Chem. Soc. 133, 4274–4284 [DOI] [PMC free article] [PubMed] [Google Scholar]
- 16. Stouffer A. L., Acharya R., Salom D., Levine A. S., Di Costanzo L., Soto C. S., Tereshko V., Nanda V., Stayrook S., and DeGrado W. F. (2008) Structural Basis for the function and inhibition of an influenza virus proton channel. Nature 451, 596–599 [DOI] [PMC free article] [PubMed] [Google Scholar]
- 17. Williams J. K., Tietze D., Wang J., Wu Y., DeGrado W. F., and Hong M. (2013) Drug-induced conformational and dynamical changes of the S31N mutant of the influenza M2 proton channel investigated by solid-state NMR. J. Am. Chem. Soc. 135, 9885–9897 [DOI] [PMC free article] [PubMed] [Google Scholar]
- 18. Williams J. K., Tietze D., Lee M., Wang J., and Hong M. (2016) Solid-state NMR investigation of the conformation, proton conduction, and hydration of the influenza B virus M2 transmembrane proton channel. J. Am. Chem. Soc. 138, 8143–8155 [DOI] [PMC free article] [PubMed] [Google Scholar]
- 19. Wang J., Pielak R. M., McClintock M. A., and Chou J. J. (2009) Solution structure and functional analysis of the influenza B proton channel. Nat. Struct. Mol. Biol. 16, 1267–1271 [DOI] [PMC free article] [PubMed] [Google Scholar]
- 20. Otomo K., Toyama A., Miura T., and Takeuchi H. (2009) Interactions between histidine and tryptophan residues in the BM2 proton channel from influenza B virus. J. Biochem. 145, 543–554 [DOI] [PubMed] [Google Scholar]
- 21. Ma C., Soto C. S., Ohigashi Y., Taylor A., Bournas V., Glawe B., Udo M. K., Degrado W. F., Lamb R. A., and Pinto L. H. (2008) Identification of the pore-lining residues of the BM2 ion channel protein of influenza B virus. J. Biol. Chem. 283, 15921–15931 [DOI] [PMC free article] [PubMed] [Google Scholar]
- 22. Hong M., and DeGrado W. F. (2012) Structural basis for proton conduction and inhibition by the influenza M2 protein. Protein Sci. 21, 1620–1633 [DOI] [PMC free article] [PubMed] [Google Scholar]
- 23. Mould J. A., Paterson R. G., Takeda M., Ohigashi Y., Venkataraman P., Lamb R. A., and Pinto L. H. (2003) Influenza B virus BM2 protein has ion channel activity that conducts protons across membranes. Dev. Cell 5, 175–184 [DOI] [PubMed] [Google Scholar]
- 24. Hong M. (1999) Solid-state dipolar INADEQUATE NMR spectroscopy with a large double-quantum spectral width. J. Magn. Reson. 136, 86–91 [DOI] [PubMed] [Google Scholar]
- 25. Hu F., Schmidt-Rohr K., and Hong M. (2012) NMR Detection of pH-dependent histidine-water proton exchange reveals the conduction mechanism of a transmembrane proton channel. J. Am. Chem. Soc. 134, 3703–3713 [DOI] [PMC free article] [PubMed] [Google Scholar]
- 26. deAzevedo E., Hu W., Bonagamba T., and Schmidt-Rohr K. (1999) Centerband-only detection of exchange: efficient analysis of dynamics in solids by NMR. J. Am. Chem. Soc. 121, 8411–8412 [Google Scholar]
- 27. Schmidt-Rohr K., deAzevedo E., and Bonagamba T. (2007) Centerband-only detection of exchange (CODEX): efficient NMR analysis of slow motions in solids. eMagRes. 10.1002/9780470034590.emrstm0063 [DOI] [Google Scholar]
- 28. Goldberg R., Kishore N., and Lennen R. (2002) Thermodynamic quantities for the ionization reactions of buffers. J. Phys. Chem. Ref. Data 31, 231–370 [Google Scholar]
- 29. Luo W., Mani R., and Hong M. (2007) Side-Chain Conformation of the M2 transmembrane peptide proton channel of influenza A virus from 19F solid-state NMR. J. Phys. Chem. B 111, 10825–10832 [DOI] [PubMed] [Google Scholar]
- 30. Li S., and Hong M. (2011) Protonation, tautomerization, and rotameric structure of histidine: a comprehensive study by magic-angle-spinning solid-state NMR. J. Am. Chem. Soc. 133, 1534–1544 [DOI] [PMC free article] [PubMed] [Google Scholar]
- 31. Takegoshi K., Nakamura S., and Terao T. (2001) 13C-1H Dipolar-assisted rotational resonance in magic-angle spinning NMR. Chem. Phys. Lett. 344, 631–637 [Google Scholar]
- 32. Hohwy M., Rienstra C., Jaroniec C., and Griffin R. (1999) Fivefold symmetric homonuclear dipolar recoupling in rotating solids: application to double quantum spectroscopy. J. Chem. Phys. 110, 7983–7992 [Google Scholar]
- 33. Hong M., and Griffin R. (1998) Resonance assignments for solid peptides by dipolar-mediated 13C/15N correlation solid-state NMR. J. Am. Chem. Soc. 120, 7113–7114 [Google Scholar]
- 34. Luo W., and Hong M. (2006) Determination of the oligomeric number and intermolecular distances of membrane protein assemblies by anisotropic 1H-driven spin diffusion NMR spectroscopy. J. Am. Chem. Soc. 128, 7242–7251 [DOI] [PubMed] [Google Scholar]