

Abstract
Desmoid‐type fibromatosis (DF) is a rare mesenchymal lesion with high risk of local recurrence. Specific β‐catenin mutations (S45F) appeared to be related to this higher risk compared to T41A‐mutated or wild‐type (WT). We explored the influence of both mutations and WT on structure stability and affinity of β‐catenin for α‐catenin and the pattern of gene expression that may influence DF behavior. Using 33 surgically resected primary DFs harboring T41A (n = 14), S45F (n = 10), or WT (n = 9), we performed a comparative molecular analysis by protein/protein interaction modeling, gene expression by DASL microarrays, human inflammation gene panel, and assessment of immune system‐based biomarkers by immunohistochemistry. Mutated proteins were more stable than WT and formed a weaker complex with α‐catenin. Consensus unsupervised gene clustering revealed the presence of two DF group‐mutated (T41A + S45F) and WT (P = 0.0047). The gene sets ‘Inflammatory‐Defense‐Humoral Immune Response’ and ‘Antigen Binding’ were significantly enriched in T41A. The deregulation of 16 inflammation‐related genes was confirmed. Low numbers of T cells and tumor‐associated macrophages (TAM) infiltrating the tumors and low/absent PD‐1/PD‐L1 expression were also identified. We demonstrated that mutated DFs (T41A or S45F) and WT are two distinct molecular subgroups with regard to β‐catenin stability, α‐catenin affinity, and gene expression profiling. A different inflammation signature characterized the two mutated groups, suggesting mediation either by T41A or by S45F. Finally, all mutated cases showed a low number of TIL and TAM cells and a low or absent expression of PD‐1 and PD‐L1 consistent with β‐catenin activation insensitive to checkpoint blockade.
Keywords: desmoid‐type fibromatosis, gene expression, modeling, β‐catenin mutation
Abbreviations
- ADL
average dynamic length
- DF
desmoid‐type fibromatosis
- FDR
false discovery rate
- FFPE
formalin‐fixed paraffin‐embedded
- GSEA
gene set enrichment analysis
- MD
molecular dynamics
- NES
normalized enrichment score
- n
number
- PAR
progression arrest rate
- RFS
recurrence‐free survival
- TAM
tumor‐associated macrophages
- TIL
tumor‐infiltrating lymphocytes
- WT
wild‐type
1. Introduction
Desmoid‐type fibromatosis (DF) is a rare mesenchymal infiltrative lesion that exhibits high risk of local recurrence despite surgery with negative resection margins. The high propensity to relapse, the need for multiple surgeries with consequent functional and cosmetic impairment, the observation of prolonged stability in the absence of specific treatments, and the description of spontaneous regression have let the sarcoma community to change the management of this disease toward a more conservative tendency (Bonvalot et al., 2008; Fiore et al., 2009). Recently, guidelines have underlined the possibility of proposing a frontline observational approach to almost all patients with newly DF reserving specific treatments such as different drug regimens, radiotherapy, or surgery to selected cases including progressive disease (Kasper et al., 2015). Unfortunately, changing in the clinical practice has not been paralleled by increasing knowledge regarding the pathogenesis and progression of this rare disease. Accurate molecular predictors that can be used at the beginning of the clinical history to tailor specific treatments are not available to date. Mutations in CTNNB1 gene encoding for β‐catenin are typically carried by most sporadic DFs. Three different β‐catenin point mutations, T41A, S45F, and S45P, have been described in the vast majority of DFs and have been associated with the prevention of protein phosphorylation and subsequent protein stabilization with translocation to the nucleus, where β‐catenin regulates transcription through its interaction with TCF/LEF (Kundu et al., 2006). These β‐catenin mutations were evaluated for their impact on DF patients’ outcome. By comparing mutated and wild‐type (WT) surgical DFs, we and other groups observed a statistically significant association between CTNNB1 mutations and higher risk for local recurrence (van Broekhoven et al., 2015; Colombo et al., 2013; Dômont et al., 2010). In particular, the specific mutation S45F was associated with worse recurrence‐free survival (RFS) (van Broekhoven et al., 2015; Colombo et al., 2013; Lazar et al., 2008). However, this evidence was not confirmed by other groups who reported a statistically not significant trend of poorer outcome in patients harboring the S45F mutation (Dômont et al., 2010) or no correlation between the specific CTNNB1 mutation and RFS (Mullen et al., 2013; Romero et al., 2012). Regarding the impact of mutations on response to medical treatment, Nishida et al. did not find a correlation between the efficacy of methotrexate or vinblastine and specific CTNNB1 mutations (Nishida et al., 2015). On the other hand, only the S45F mutation was significantly associated with a poor response to meloxicam (Hamada et al., 2016) and with a progression arrest rate after imatinib treatment (Kasper et al., 2016).
In this scenario of contrasting evidence of the impact of CTNNB1 mutations and considering that these mutations map in the N‐terminal domain of β‐catenin that mediates both its degradation and interaction with α‐catenin in the cell–cell adhesions (Jiang and Struhl, 1998; Pokutta et al., 2014), we hypothesized that the mutation type could influence the stability of the β‐catenin structure, its affinity for α‐catenin, as well as the pattern of gene expression that in turn may guide the behavior of the disease. Thus, in this work, we performed a comparative molecular analysis of protein structure based on protein/protein interaction modeling and of gene and protein expression.
2. Materials and methods
2.1. Patients and samples
For this study, we selected 33 primary DFs surgically treated at our institution. All samples had the following characteristics: (a) DF diagnosis by an expert pathologist (SP); (b) known CTNNB1 mutational status assessed by direct sequencing as previously described (Colombo et al., 2013); (c) availability of the formalin‐fixed paraffin‐embedded (FFPE) surgical specimen; (d) availability of RNA amount and quality adequate for molecular analysis. The distribution of mutations was T41A (14 cases), S45F (10 cases), and WT (nine cases). Patients and disease characteristics are detailed in Table 1. Data retrieved were gender, age at surgery, anatomical site (abdominal wall, intra‐abdominal, and extra‐abdominal including extremity/girdle, head/neck, thoracic wall), size (cm), CTNNB1 mutational status, data of surgery, data of recurrence, data of last follow‐up, status at last follow‐up. All patients had a macroscopically complete (including R0 and R1 margins) surgical resection except one. All samples were obtained after informed consent from patients. The study was approved by the Independent Ethics Committee of Fondazione IRCCS Istituto Nazionale dei Tumori (Approval Number RF‐2009‐1511297).
Table 1.
Patients and disease characteristics
| No. | Age (years) | Anatomical site | Size (cm) | CTNNB1 status | Recurrence | Margins | Adjuvant RT | Status at last follow‐up |
|---|---|---|---|---|---|---|---|---|
| 1 | 60 | Extra‐abdominal | 4 | T41A | NO | R1 | Yes | NED |
| 2 | 39 | Abdominal wall | 5 | WT | NO | R0 | No | NED |
| 3 | 36 | Abdominal wall | 15 | S45F | NO | R0 | No | NED |
| 4 | 32 | Abdominal wall | 5 | T41A | NO | R0 | No | NED |
| 5 | 53 | Extra‐abdominal | 12 | S45F | 15/03/2007 | R0 | Yes | AWD |
| 6 | 49 | Intra‐abdominal | 4 | T41A | NO | R0 | No | NED |
| 7 | 16 | Extra‐abdominal | 3 | WT | NO | R0 | No | NED |
| 8 | 26 | Extra‐abdominal | 2 | WT | NO | R1 | No | NED |
| 9 | 19 | Abdominal wall | 10 | S45F | NO | R0 | No | NED |
| 10 | 33 | Extra‐abdominal | 5 | T41A | NO | R1 | No | NED |
| 11 | 67 | Extra‐abdominal | 4 | WT | NO | R0 | No | NED |
| 12 | 42 | Abdominal wall | 6 | S45F | NO | R0 | No | NED |
| 13 | 32 | Abdominal wall | 8 | S45F | NO | R0 | No | NED |
| 14 | 25 | Extra‐abdominal | 7 | T41A | NO | R1 | No | NED |
| 15 | 69 | Intra‐abdominal | 4 | T41A | NO | R0 | No | NED |
| 16 | 39 | Abdominal wall | 6 | WT | NO | R1 | No | NED |
| 17 | 70 | Extra‐abdominal | 6 | WT | NO | R0 | No | NED |
| 18 | 32 | Extra‐abdominal | 5 | T41A | YES | R1 | No | NED |
| 19 | 32 | Abdominal wall | 6 | T41A | NO | R0 | No | NED |
| 20 | 17 | Extra‐abdominal | 9 | T41A | NO | R0 | No | NED |
| 21 | 28 | Intra‐abdominal | 18 | T41A | NO | R0 | No | NED |
| 22 | 33 | Abdominal wall | 10 | S45F | NO | R0 | No | NED |
| 23 | 36 | Extra‐abdominal | 5 | WT | 15/07/2006 | R0 | No | AWD |
| 24 | 51 | Extra‐abdominal | – | T41A | NO | R1 | No | NED |
| 25 | 37 | Intra‐abdominal | 28 | WT | NO | R0 | No | NED |
| 26 | 25 | Abdominal wall | 15 | WT | NO | R0 | No | NED |
| 27 | 47 | Extra‐abdominal | 11 | S45F | NO | R1 | Yes | NED |
| 28 | 31 | Intra‐abdominal | – | T41A | NO | R2 | Yes | AWD |
| 29 | 45 | Intra‐abdominal | 3 | T41A | NO | R0 | No | DOC |
| 30 | 43 | Abdominal wall | 7 | T41A | NO | R0 | No | NED |
| 31 | 50 | Extra‐abdominal | 7 | S45F | NO | R0 | No | NED |
| 32 | 43 | Extra‐abdominal | 11 | S45F | 3/05/2007 | R1 | No | AWD |
| 33 | 24 | Extra‐abdominal | 6 | S45F | 5/10/2005 | R0 | No | AWD |
NED, not evidence of disease; AWD, alive with disease; DOC, dead for other cause.
2.2. Modeling
The optimized full‐length three‐dimensional (3D) models of WT and mutant isoforms of β‐catenin were obtained by a combination of homology modeling techniques with molecular dynamics (MD) refinements (Bozzi et al., 2013; Dileo et al., 2011; Laurini et al., 2011; Morgan et al., 2015). WT and mutant β‐catenin thermodynamic stability was determined by MD simulations in the molecular mechanics/Poisson Boltzmann surface area (MM/PBSA) framework of theory (Ferrone et al., 2006; Gibbons et al., 2014; Negri et al., 2009; Pierotti et al., 2010, 2011; Pricl et al., 2015). The available structure of β‐catenin (4IGG pdb) was used to build all WT and mutant β‐catenin/α‐catenin protein–protein complex and to determine the dynamics and energetics of their interactions via MM/PBSA MD simulations (see Data S1 for details).
2.3. RNA isolation and whole‐genome gene expression profiling
The sample areas containing more than 90% tumor cells without necrosis or surrounding normal tissue were chosen for the analysis and macrodissected. Total RNA was isolated using Qiagen RNeasy FFPE Kit (Qiagen, Valencia, CA, USA) following the manufacturer's instructions and quantified by Nanodrop‐1000 instrument (Thermo Fisher Scientific, Waltham, MA, USA). RNA quality was assessed by RT‐qPCR amplifying amplicons of different size for ACTB housekeeping gene (Mittempergher et al., 2011; Ravo et al., 2008). Two hundred nanogram of RNA from each sample was subjected to profiling on Human WG‐DASL Assay with Human HT12 v4.0 BeadChips (Illumina Inc., San Diego, CA, USA) that allows the expression profiling of 29 377 probes from degraded RNA, such as that extracted from FFPE samples (Vallacchi et al., 2014). Reverse transcription, oligo annealing, ligation, amplification, labeling, probe purification, hybridization, and chip's washing were performed following the manufacturer's instructions. Microarray chips were scanned with an Illumina BeadArray Reader. Primary data were extracted by genome studio software V.3 (Illumina Inc.), normalized by quantile algorithm, and exported without correcting for background or scale. All microarray data are MIAME compliant and the raw data were deposited into the NCBI's Gene Expression Omnibus (GEO) database (http://www.ncbi.nmlm.nih.gov/projects/geo/) with accession number GSE65021
2.4. Statistical and bioinformatic analyses
Statistical analysis was performed using R Development Core Team, 2007 version 2.15, BioConductor (Available online: www.bioconductor.org) and the BRB‐ArrayTool developed by Richard Simon and the BRB‐ArrayTools Development Team (v4.2.0; National Cancer Institute, USA). Unsupervised tumor subtype identification was performed by ConsensusClusterPlus (Wilkerson and Hayes, 2010). Supervised class comparison was made to define the differentially expressed genes imposing a significance threshold of false discovery rate (FDR) < 1% and |log2 (fold change)| > 1 between WT and mutated CTNNB1‐bearing samples. The probability of finding probe sets significant by chance (FDR at 0.01 level) was determined by the global test through 1000 permutations as computed by BRB tool using default parameters. Pathway analysis on 905 GO terms was performed using gene set enrichment analysis (GSEA). The degree of gene sets’ enrichment in the WT and mutated DF was represented by a normalized enrichment score (NES) and NES with FDR < 0.05 and > |1.5| was considered statistically significant. Graphical representation of GSEA findings was provided by GOBubble plot function of GOplot R package (Wencke et al., 2015), displaying information about the significance of the enrichment (−log10‐adjusted P‐value) and the z‐score of each gene set. For comparison purposes, the gene list derived from 14 sporadic DF (not characterized for CNTBB1 mutation) and five paired normal samples plus six solitary fibrous tumor specimens was analyzed (Colombo et al., 2011). The list of 636 and 119 genes, up and down (see Table S2 in Colombo et al., 2011) in DF, respectively, was imported in GSEA and used as custom gene sets and tested for enrichment in our gene expression dataset.
2.5. Nanostring nCounter System
The Nanostring nCounter System analysis was performed by Pharma Diagen (Padova, Italy) using the Human Inflammation panel (249 genes). Statistical analysis was conducted by comparing WT versus both mutated cases and then the mutation T41A versus S45F. Raw data from Nanostring platform were normalized by resorting to a two‐step strategy using the R NanoStringNorm package (Waggott et al., 2012). Firstly, by taking advantage of the negative and positive controls present in the Nanostring assay, a technical normalization was performed. A biological normalization was then implemented by using the housekeeping genes as endogenous controls. Subsequently, due to the limited sample size per group, we considered only that genes resulting expressed in all samples for the comparisons of interest. To analyze the normalized gene copies counts, a generalized linear model was implemented with a logarithmic link that takes into account overdispersion of the data (Agresti, 2007). Multiple testing adjustment, such as FDR correction (at 0.05 level), was used to manage the multiplicity problem. Statistical analyses were performed with r and sas software (version 9.2.; SAS Institute Inc., Cary, NC, USA).
2.6. Immunohistochemical analysis
Immunohistochemistry was performed on 2‐μm FFPE sections in an automated immunostainer (Autostainer Link48; Dako, Glostrup, Denmark) according to the manufacturer's instructions. The following antibodies were used: β‐catenin 14 (1 : 1000; BD Transduction, South San Francisco, CA, USA), CD3 polyclonal (1 : 400; Dako), CD4 4B12 (1 : 300; Dako), CD8 C8/144B (1 : 20; Dako), CD20 L26 (1 : 400; Dako), CD21 1F8 (1 : 50; Dako), CD56 123C3 (1 : 400; Dako), CD68 KP1 (1 : 3000; Dako), CD163 10D6 (1 : 200; Novocastra, Newcastle, UK), FOXP3 259D/C7 (1 : 200; BD Pharmingen), PD‐L1 SP142 (1 : 30; SPRING, Pleasanton, CA, USA), PD1 NAT105 (1 : 100; Biocare Medical, Pikenine, Concord, NC, USA), and EZH2 5246S (1 : 50; Cell Signaling, Leiden, Netherlands).
3. Results
3.1. CTNNB1‐mutated and WT DFs have different thermodynamic stability and affinity for α‐catenin
The N‐terminal domain of β‐catenin, which contains the residues T41 and S45, mediates protein degradation and interacts with α‐catenin in the cell–cell adhesions mechanically coupling the actin cytoskeletons of adjacent cells (Jiang and Struhl, 1998; Pokutta et al., 2014). In this scenario, we performed extensive MD simulations to investigate possible effects exerted by the two mutations T41A and S45F on the protein thermodynamic stability and on β‐catenin/α‐catenin dimer formation compared to β‐catenin WT. To the purpose, the 3D model of the full‐length β‐catenin (Fig. 1A) was built starting from the available crystallographic structures and linking the missing loops previously modeled by computational techniques.
Figure 1.
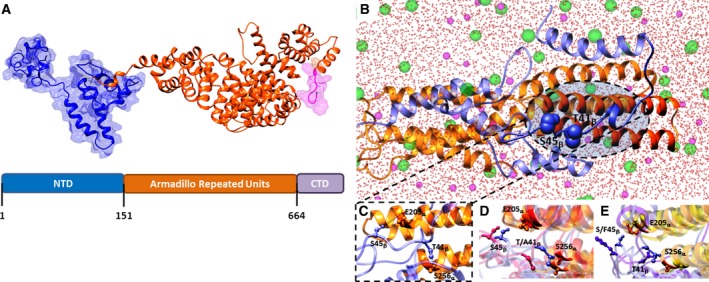
Wild‐type (WT) and mutated β‐catenins have different thermodynamic stability and affinity for α‐catenin. (A) Three‐dimensional structure of the β‐catenin WT protein. The different domains of β‐catenin are shown in different colors (same for 3D model and diagram): N‐terminal domain (NTD), blue; Armadillo repeated units, orange; C‐terminal domain (CTD), purple. (B) Overall and (C) zoomed view of an equilibrated MD snapshot of the WT β‐catenin/α‐catenin complex. The proteins are visualized in ribbon style and colored as follows: α‐catenin, cornflower blue; β‐catenin, orange. Oxygen water atoms are represented as red spheres, while chlorine and sodium are depicted as green and purple spheres, respectively. (D) Superposition of MD‐equilibrated snapshots of WT (cornflower blue) and the T41A (orange)‐mutant β‐catenin in complex with α‐catenin. (E) Superposition of MD‐equilibrated snapshots of WT (cornflower blue) and the S45F (purple)‐mutant β‐catenin in complex with α‐catenin.
Computer‐based simulations revealed that the thermodynamic stabilities (i.e., Gibbs free energy ΔG) of the two mutant T41A and S45F β‐catenin isoforms are comparable (ΔGT41A = −10 480.40 ± 0. 22 kcal·mol−1, ΔGS45F = −10 480.33 ± 0.25 kcal·mol−1); rather, both mutant proteins showed a slightly increased stability compared to the WT counterpart, the T41A and S45F being more stable than the WT β‐catenin by 1.33 kcal·mol−1 and 1.26 kcal·mol−1, respectively.
Concerning β‐catenin/α‐catenin complex formation, computer simulations showed that protein/protein interface involves the N‐terminal domain of β‐catenin and two α‐helices of α‐catenin spanning residues P200‐R229 and A234‐Q259, respectively (Fig. 1B). We also noted that residues T41 and S45 of β‐catenin play an active role in the complex formation, being involved in hydrogen bonds with the side chain of S256 and E205 α‐catenin residues, respectively (Fig. 1C). The free energy of interaction (ΔGbind) between α‐ and WT β‐catenin is shown in the first row of Table S1. In addition, in the WT β‐catenin, both hydrogen bonds connecting the two protein chains (through T41 on the β‐chain and S256 on the α‐chain, and S45 on the β‐chain and E205 on the α‐chain, respectively) were stable and characterized by an optimal average dynamic length (ADL) of 1.95 ± 0.03 and 1.96 ± 0.04 Å, respectively. The same simulation procedure applied to α‐catenin in complex with the two mutant β‐catenin chains showed that the affinity of both mutant isoforms for α‐catenin is strongly reduced compared to the WT protein (by 2.74 and 2.87 kcal·mol−1, respectively), ultimately resulting in the formation of a weaker complex (Table S1).
The presence of either missense substitutions (A and F at positions 41 and 45 of β‐catenin, respectively) results in a plummet of the stabilizing interactions of the corresponding α‐/β‐catenin complexes. Indeed, the substitution of two polar residues, both featuring an –OH group available for hydrogen binding, with two residues devoid of such feature led to global conformational changes, which involve protein regions at a distal position from the mutant loci (Fig. 1D,E). As further indication of the detrimental effect exerted by the two mutations on the α‐/β‐catenin complex formation, we detected that the residual hydrogen bonds (i.e., the one between T41 on the β‐catenin and S256 on α‐catenin and between S45 on β‐catenin and E205 on α‐catenin, respectively) are longer, and hence, weaker, than in the case of the WT β‐catenin/α‐catenin complex (ADL(T41β‐S256α) = 2.15 ± 0.04 Å for the T41A‐mutant and ADL(S45β‐E205α) = 2.14 ± 0.06 Å for the S45F‐mutant complexes).
Overall, both mutant proteins were more stable than the WT β‐catenin and formed a weaker complex with α‐catenin due to longer hydrogen bonds.
3.2. CTNNB1‐mutated and WT DFs have different gene expression profiles
We analyzed the gene expression profile of 33 primary surgical DFs entering our case material through DASL whole‐genome microarrays, resulting in the detection of 20 284 probe sets corresponding to 14 664 unique genes. In order to explore the inherent gene expression patterns present in our dataset, consensus unsupervised clustering was applied and revealed the presence of two main clusters of DF samples (Fig. 2A upper panel), essentially reflecting CTNNB1‐mutated cases (Cluster 1: 21/24 samples are mutated) and WT (Cluster 2: 6/9 samples are WT) (P = 0.0047 by χ2, Fig. 2A lower panel). By supervised analysis and class comparison, we identified 382 differentially expressed probe sets (See Table S2 for details). The probability of finding 382 probes significant by chance if there were no real differences between the classes was 0.003, as determined by the global test. As depicted in Fig. 2B, 48 probes are upregulated in WT, while 334 are upregulated in CTNNB1‐mutated DFs. The gene signatures derived from Colombo et al. (2011) comparing sporadic DFs (n = 14) and normal samples/solitary fibrous tumor specimens (n = 11) were applied to our dataset as custom gene sets in GSEA; this analysis identified in WT β‐catenin cases a significant enrichment of genes present in normal tissues (Fig. 2C) and in mutated cases a significant enrichment of genes present in sporadic DFs (Fig. 2D).
Figure 2.
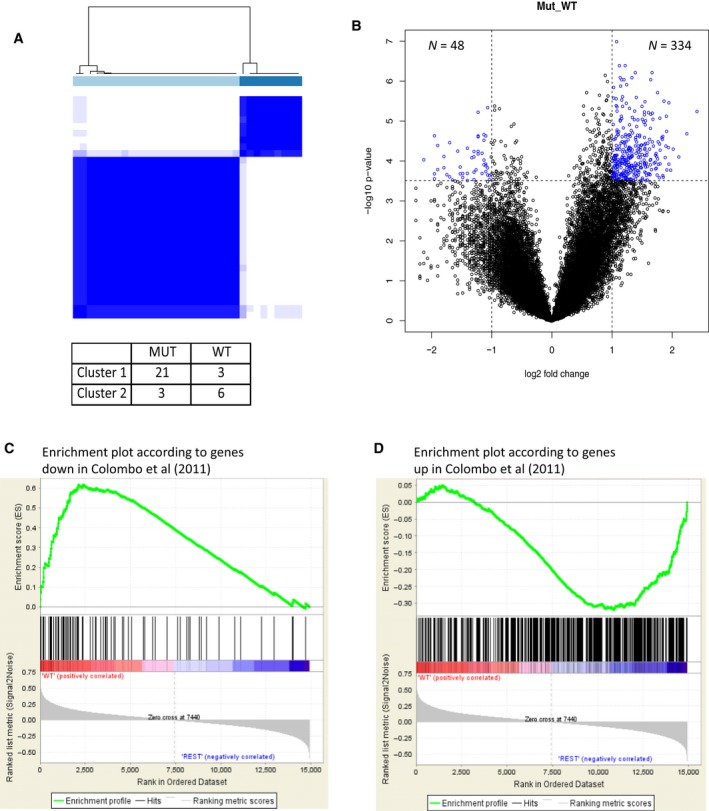
Mutated and wild‐type (WT) β‐catenin desmoid‐type fibromatosis (DFs) have different gene expression profiles. (A) Upper panel: consensus unsupervised clustering analysis of the gene expression of 33 DF samples (nine WT and 24 mutated); the heatmap depicts the consensus matrix imposing the presence of two clusters on the dataset. The values range from 0 (white, samples do not cluster together) to 1 (blue, samples showing high clustering affinity); lower panel: distribution of WT and mutated DF samples in the two clusters. (B) Volcano plot of log2 (fold changes) versus −log10 P‐value. The volcano plot shows transcriptional differences between the two groups of samples identified by consensus unsupervised clustering analysis. The dashed lines denote the FDR < 0.01 cutoff. (C, D) The list of genes, down (119) and up (636), in sporadic DFs (n = 14) as compared to normal samples/solitary fibrous tumors (n = 11) (31), when used as custom gene set in GSEA, identified in WT CTNNB1 cases (panel C) a significant enrichment of genes present in normal/solitary fibrous tissues, and in mutated CTNNB1 cases (panel D) a significant enrichment of genes present in sporadic DF.
To gain further insight into the biological pathways modulated by CTNNB1 mutational status, GSEA analysis was performed. This analysis revealed six gene sets significantly enriched in CTNNB1‐mutated DF as compared to WT DFs. The main difference between the WT and mutated tumors was associated with their contractile fiber status, being the WT DFs characterized by an enrichment of the genes sets ‘Contractile Fiber’, ‘Structural Constituent Muscle’, and ‘Myofibril’ (Fig. 3A). This is in line with the characteristics of DF in general where myofibroblasts are dismounted and collagen is increased.
Figure 3.
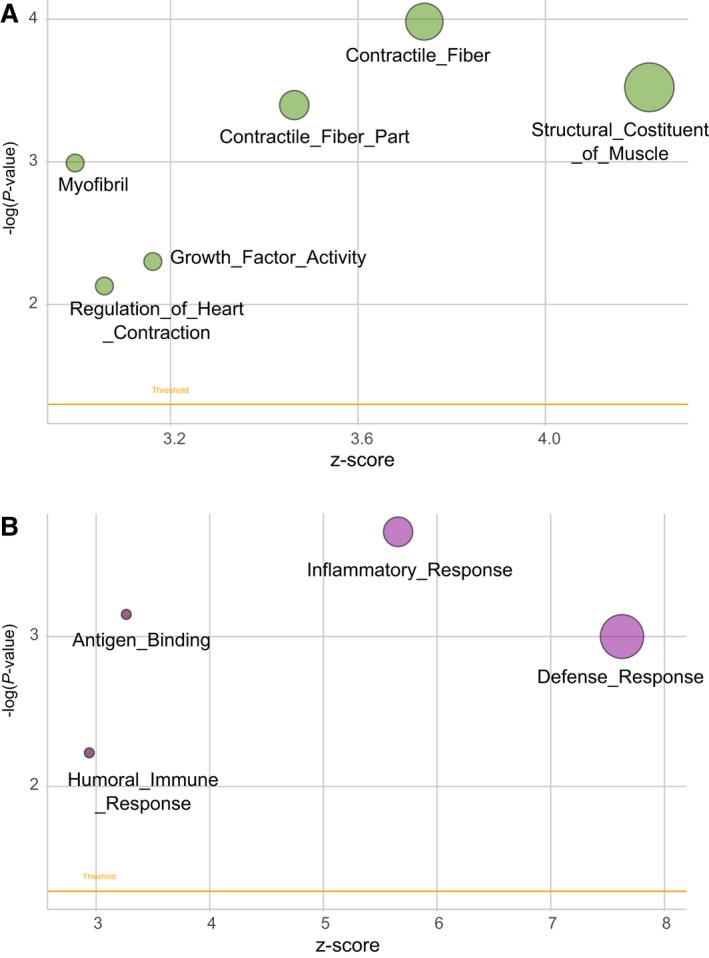
Biological pathways modulated by CTNNB1 mutational status. Bubble plot of gene sets significantly enriched in: (panel A) CTNNB1‐mutated DF as compared to WT DF; (panel B) CTNNB1 T41A DFs as compared to S45F. An overview of GSEA‐enriched networks is depicted. The x‐axis indicates the z‐score for each term, while the y‐axis is the negative logarithm of the adjusted P‐value. The area of the displayed circles is proportional to the number of genes assigned to each term. DF, desmoid‐type fibromatosis; WT, wild‐type.
3.3. T41A‐mutated DFs have an upregulation of gene sets belonging to inflammatory status
No differentially expressed genes were observed when the two specific mutations T41A and S45F were compared. However, GSEA revealed four gene sets significantly enriched in CTNNB1 T41A DFs when compared with S45F. The main difference between the two mutated tumor groups was associated with their inflammatory status, being the T41A DFs characterized by upregulation of genes of ‘Inflammatory Response’, ‘Defense Response’, ‘Humoral Immune Response’, and ‘Antigen Binding’ (Fig. 3B). In each of these four gene sets, the upregulated genes included mainly chemokine ligands and receptors and interleukins. This intriguing evidence suggested that the inflammation and immune response might play a role particularly in T41A cases.
3.4. T41A‐ and S45F‐mutated DFs have different expression of inflammation‐related genes
On the basis of the inflammation‐related gene set enrichment found in T41A cases, we further explored by nanostring the expression of 249 inflammation‐related biomarkers including chemokines, interleukins, growth factors, tool‐like receptors.
Comparing both mutated (T41A + S45F) versus WT DFs, among the 139 biomarkers resulted to be expressed in all the 33 samples, only HMGN1 was found statistically significantly overexpressed in mutated DFs (adjusted FDR P‐value = 0.009). This nucleosome‐binding protein HMGN1 is a potent alarmin that promotes T cell‐mediated antitumor immunity (Wei et al., 2014).
Further analysis comparing the two mutated groups demonstrated that 147 biomarkers were expressed in all the 24 samples; 16 of them were statistically significantly deregulated in the T41A compared with S45F cases (Table 2). In detail, 14 genes resulted to be overexpressed in T41A DFs (CREB1, MAPK3, CCL4, TLR2, HMGN1, MKNK1, MEF2A, IRF1, CD55, PPP1R12B, RAPGEF2, C2, PTGER2, TLR3) and TGF‐β2 and TGF‐β3 were downregulated.
Table 2.
Nanostring analysis comparison between T41A‐ and S45F‐mutated desmoid‐type fibromatosis
| Gene | Fold change | P‐value | Adjusted P‐value |
|---|---|---|---|
| CREB1 | 1.3269 | 0.00001 | 0.0010 |
| MAPK3 | 1.2038 | 0.00005 | 0.0037 |
| CCL4 | 3.2859 | 0.00037 | 0.0168 |
| TGFB2 | 0.5706 | 0.00055 | 0.0168 |
| TLR2 | 1.4818 | 0.00066 | 0.0168 |
| HMGN1 | 1.2573 | 0.00081 | 0.0168 |
| MKNK1 | 1.2910 | 0.00087 | 0.0168 |
| TGFB3 | 0.6707 | 0.00092 | 0.0168 |
| MEF2 | 1.2359 | 0.00149 | 0.0242 |
| IRF1 | 1.6080 | 0.0017 | 0.0242 |
| CD55 | 1.6027 | 0.00183 | 0.0242 |
| PPP1R12B | 1.6331 | 0.00198 | 0.0242 |
| RAPGEF2 | 1.1710 | 0.00312 | 0.0353 |
| C2 | 1.6592 | 0.00472 | 0.0495 |
| PTGER2 | 1.6147 | 0.00522 | 0.0498 |
| TLR3 | 1.9329 | 0.00542 | 0.0498 |
Interestingly, some of these upregulated markers are known to be associated with antitumor immunity, such as HMGN1 (Wei et al., 2014); the transcription factor CREB1 that plays a key role in NF‐kB inhibition, thereby limiting proinflammatory responses and enhancing host immune responses (Wen et al., 2010); IRF1 that contributes to tumor immune surveillance (Dou et al., 2014). Moreover, the lower levels of TGF‐β2 and TGF‐β3 we observed in T41A are intriguing due to the bifunctional role (pro‐ and anti‐inflammatory) of these two cytokines recently described in immune system (Okamura et al., 2015).
Cumulatively, the main differences dictated by the RNA analyses were the augment of secreted proteins enhancing tumor immune response of T41A compared to S45F mutation.
3.5. Host immunoscore system assessment in T41A‐ and S45F‐mutated DFs
We made immunoscore assessment of the immunosystem‐based biomarkers including CD3, CD4, CD8, FOXP3, CD20, CD56, CD21, CD163, and CD68. In terms of immunoprofile between the two types of mutations, no difference was observed. In all cases, the analysis revealed throughout the tumor proliferation a low number of T cells, CD3+, and CD8+ and of tumor‐associated macrophages (TAM), CD163+, and/or CD68+, distributed around the vessels (Fig. 4A–C). In addition, a more consistent number of tumor‐infiltrating lymphocytes (TILs), T cells, and/or TAMs were present at the boundaries, where the proliferation abutted the skeletal muscle, or in the area of entrapped muscle fibers which in all the cases exhibited marked regressive changes (Fig. 4D,E). No FOXP3‐, CD4‐, and CD56‐immunolabeled cells were observed. In addition to T cells, CD20+ B cells (Fig. 4F) were present in occasional small lymphoid aggregates that did not reach characteristics of tertiary lymphoid structures lacking CD21‐decorated dendritic follicular cells and/or EZH2‐positive (here applied as surrogate of activation) germinative centers (Fig. 4G) (Neyt et al., 2012).
Figure 4.
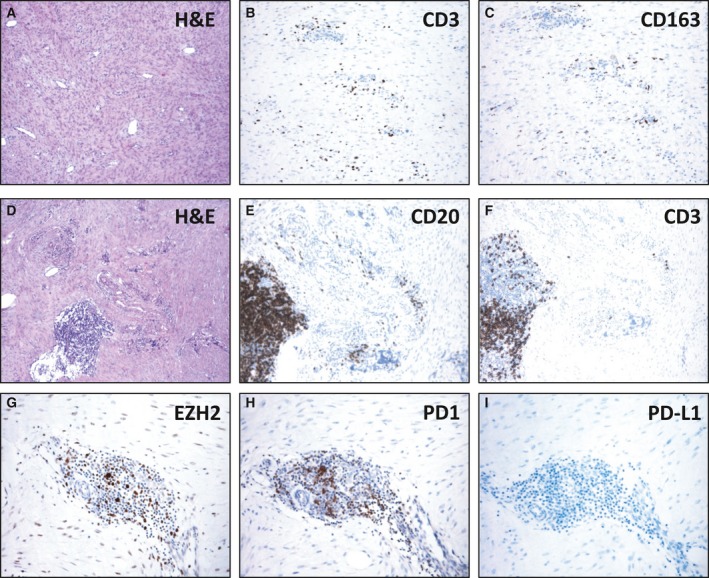
T cells and tumor‐associated macrophages (TAM) are rare in T41A‐ or S45F‐mutated desmoid‐type fibromatosis. In the tumor proliferation (A), a low number of CD3+ T cells (B) and CD163+ tumor‐associated macrophages (C) were distributed around the vessels. In occasional small lymphoid aggregates (D), CD20+ B cells (E), CD3+ T cells (F), and EZH2+ cells (G) were present. Few PD‐1‐decorated lymphocytes were restricted to lymphoid aggregates (H), and no immunolabeled PD‐L1 tumor‐associated inflammatory cell (I) was present.
Despite the lack of a sizable number of EZH2 expressing T lymphocytes, we explored the expression of the costimulatory molecule PD‐1 and its ligand PD‐L1 in order to identify potential treatment window of the host immune system being, as expected, tumor cells always negative. The analysis, performed on nine cases, showed only few PD‐1‐decorated lymphocytes, mostly restricted to lymphoid aggregates (Fig. 4H), and no immunolabeled PD‐L1 tumor‐associated inflammatory cells (Fig. 4I).
Altogether, the host cellular immunocomponent was very poor, suggesting that the observed modulation of the secreted cytokines/chemokines was sustained by tumor cellular component other than the resident TILs and TAMs. By contrast, in all mutated and WT cases, all the tumor cells were β‐catenin‐immunodecorated.
4. Discussion
We started from the hypothesis that CTNNB1 mutation types can influence the β‐catenin stability and its affinity for α‐catenin, besides the pattern of gene expression and consequently DF behavior.
The modeling results demonstrated that the presence of T41A or S45F mutation concurs in the stabilization of the mutated proteins compared to the WT, and in the reduction in the affinity binding with α‐catenin. The in silico results supported the assumption that both mutations shift the balance between membrane and cytoplasmic β‐catenin toward a cytoplasmic/nuclear pool, as showed by the nuclear and cytoplasmic immunoreactivity of β‐catenin in mutated DF (Signoroni et al., 2007).
Next, we investigated by gene expression analysis the influence of the two mutations on β‐catenin nuclear role as transcription factor. This analysis revealed that the group of T41A + S45F showed a distinct signature compared to WT DFs, suggesting that they are two distinct biological entities. Interestingly, the two different patterns of gene expression are in line with the clinical evidence that β‐catenin WT DFs are associated with a better prognosis than mutated ones (van Broekhoven et al., 2015; Colombo et al., 2013; Dômont et al., 2010).
Our profiling analysis is quite unique. Indeed, only a recent gene expression study compared mutated versus WT DFs, indicating that mutated DFs did not cluster separately and did not have a different clinical behavior from WT tumors (Crago et al., 2015). However, the authors of this study included in the ‘mutated’ group also tumors lacking CTNNB1 mutation but carrying other Wnt/β‐catenin signaling alterations, such as APC mutations and/or loss. Thus, their results – rather than elucidating possible differences between CTNNB1‐mutated and WT DFs – reflect the rarity of the ‘wild‐type’ Wnt/β‐catenin genotype. This prompted us to explore APC status in our series by next‐generation sequencing that revealed the absence of APC mutations in all but one CTNNB1 WT case (data not shown).
The other gene expression analyses on DFs reported in the literature are not comparable with our study because, regardless of tumor CTNNB1 mutational status, they compared DFs with nodular fasciitis, normal tissues, and/or solitary fibrous tumors in order to find specific gene signatures associated with DF biology or outcome (Bacac et al., 2006; Colombo et al., 2011; Denys et al., 2004; Salas et al., 2010; Skubitz and Skubitz, 2004). However, it should be mentioned that one of these studies comparing DFs with normal tissues identified two distinct subgroups of DFs on the basis of gene expression profiles that paralleled different clinical outcomes (Skubitz and Skubitz, 2004). Interestingly, the subsequent sequencing of the same samples revealed that these two subclusters showed different β‐catenin mutation distribution (Misemer et al., 2014), even if the exiguous number of analyzed cases did not allow drawing any definitive conclusion.
When the gene signatures previously obtained comparing sporadic DFs and normal/solitary fibrous samples were applied to our dataset as custom gene sets in GSEA, we found a significant enrichment of genes described in normal tissues in the group of WT β‐catenin DFs, and an enrichment of genes present in sporadic DFs in the mutated cases (Colombo et al., 2011). This evidence suggests that WT DFs share molecular characteristics with normal tissue that may explain their better prognosis than mutated DFs.
No differently expressed genes were observed when the two specific mutations T41A and S45F were compared, supporting that the two specific mutations dictate a similar transcriptional activity of the two corresponding mutant β‐catenin proteins. However, when the comparison between T41A and S45F was made using gene ontology enrichment analysis, a difference in specific pathways belonging to ‘Inflammatory Response’, ‘Defense Response’, ‘Humoral Immune Response’, and ‘Antigen Binding’ emerged. As DFs have unpredictable clinical course, an equilibrium between host and disease may be crucial. To further investigate a possible role of immune system/inflammation in DFs, the expression of human inflammation‐related biomarkers was assessed by Nanostring. According to gene ontology enrichment analysis, the comparison between the two mutated DFs revealed 16 genes statistically significant up‐ or downregulated in T41A compared with S45F DFs. Due to the known relationship between oncogene activation and inflammation according to which oncogenes can also regulate the inflammatory milieu in tumors (Dibra et al., 2014), we can speculate that by activating specific pro‐ and anti‐inflammatory mediators, the two CTNNB1 mutations may produce a different inflammatory milieu that can have different impact on DF behavior. Coherently, T41A cases, generally associated with better prognosis after surgery, showed overexpression of anti‐inflammatory markers associated with antitumor immunity, such as CREB1, HMGN1, MKNK1 and IRF1, as well as lower levels of TGF‐β3 and TGF‐β2 associated with proinflammatory activities. We believe that these biomarkers were mainly derived from tumor cells because throughout all tumor proliferations, from which RNA has been extracted for gene expression, only a low number of TILs and TAMs were observed and a more consistent number of TILs, T cells, and/or TAMs were all restricted to the boundaries of DFs, where the proliferation abutted the skeletal muscle or in the area of entrapped muscle fibers. This peculiar inflammatory microenvironment is in line with the hypothesis that β‐catenin signaling activation, from which DFs depend, results in T‐cell exclusion favoring the immune evasion. Indeed, by inhibiting T‐cell activation, β‐catenin activation is one of the mechanisms that melanoma can use to evade antitumor immunity (Spranger et al., 2015). Here, the PD1/PD‐L1 profile of DFs fell into the group defined ‘the noninflamed tumor type’, which is closely associated with the EMT/STEM‐like type controlled by oncogenic and epigenetic pathways including β‐catenin, and is predictive of no clinical response of DFs to immune‐based therapies (Zou et al., 2016). Rather, the pharmacological inhibition of β‐catenin activity for tumor therapy has come into the focus of drug development (Käfer et al., 2016). Moreover, the difference in the inflammatory milieu between the two mutated forms T41A and S45F deserves further study as it can be useful in guiding future tailored therapies.
In conclusion, our study demonstrated that DFs carrying T41A or S45F mutations and WT β‐catenin are two distinct molecular subgroups with regard to β‐catenin stability, α‐catenin affinity, and gene expression profiling. Particularly, WT DFs showed an expression profile more similar to normal tissues, in keeping with their better prognosis. Moreover, we provided evidence that a different inflammation signature characterized S45F‐ and T41A‐mutated cases, suggesting a specific inflammation setting mediated by the type of β‐catenin mutation. Finally, all mutated cases showed a low number of TIL and TAM cells and a low or absent expression of PD‐1 and PD‐L1, consistent with β‐catenin activation insensitive to checkpoint blockade. Considering the limitations of the study (small sample size, single‐center experience), further studies are needed to confirm our data.
Author contributions
CC, FP, Sabrina Pricl, and Silvana Pilotti involved in conception and design; CC, AB, NP, LD, EL, MF, and SB acquired data; FP, Sabrina Pricl, SC, and PV analyzed and interpreted the data; AG, Silvana Pilotti, SS, MF, and EP participated in revising the article. All the authors gave final approval of the version to be submitted.
Supporting information
Table S1. Binding free energies (ΔGbind) and binding free energy differences (ΔΔGbind) for the WT, T41A and S45F β‐catenin in complex with α‐catenin.
Table S2. List of the 382 genes differentially expressed between mutated‐ and wt‐DT patients.
Data S1. Computational details.
Acknowledgements
This work has been financially supported by Ministero della Salute, Ricerca Finalizzata 2009 (RF‐2009‐1511297, AG). The financial support from AIRC (IG 17413, Sabrina Pricl; MFAG 11758, Chiara Colombo), DTRF (Chiara Colombo), and the Research Fund of the University of Trieste (FRA 2016; Erik Laurini) is also gratefully acknowledged.
References
- Agresti A. (2007) Introduction to Categorical Data Analysis, 2nd edn. John Wiley & Sons, Inc., Hoboken, NJ. [Google Scholar]
- Bacac M, Migliavacca E, Stehle JC, McKee T, Delorenzi M, Coindre JM, Guillou L and Stamenkovic I (2006) A gene expression signature that distinguishes desmoid tumours from nodular fasciitis. J Pathol 208, 543–553. [DOI] [PubMed] [Google Scholar]
- Bonvalot S, Eldweny H, Haddad V, Rimareix F, Missenard G, Oberlin O, Vanel D, Terrier P, Blay JY, Le Cesne A et al (2008) Extra‐abdominal primary fibromatosis: aggressive management could be avoided in a subgroup of patients. Eur J Surg Oncol 34, 462–468. [DOI] [PubMed] [Google Scholar]
- Bozzi F, Conca E, Laurini E, Posocco P, Lo Sardo A, Jocollè G, Sanfilippo R, Gronchi A, Perrone F, Tamborini E et al (2013) In vitro and in silico studies of MDM2/MDMX isoforms predict Nutlin‐3A sensitivity in well/de‐differentiated liposarcomas. Lab Invest 93, 1232–1240. [DOI] [PubMed] [Google Scholar]
- van Broekhoven DL, Verhoef C, Grünhagen DJ, van Gorp JM, den Bakker MA, Hinrichs JW, de Voijs CM and van Dalen T (2015) Prognostic value of CTNNB1 gene mutation in primary sporadic aggressive fibromatosis. Ann Surg Oncol 22, 1464–1470. [DOI] [PubMed] [Google Scholar]
- Colombo C, Creighton CJ, Ghadimi MP, Bolshakov S, Warneke CL, Zhang Y, Lusby K, Zhu S, Lazar AJ, West RB et al (2011) Increased midkine expression correlates with desmoid tumour recurrence: a potential biomarker and therapeutic target. J Pathol 225, 574–582. [DOI] [PubMed] [Google Scholar]
- Colombo C, Miceli R, Lazar AJ, Perrone F, Pollock RE, Le Cesne A, Hartgrink HH, Cleton‐Jansen AM, Domont J, Bovée JV et al (2013) CTNNB1 45F mutation is a molecular prognosticator of increased postoperative primary desmoid tumor recurrence: an independent, multicenter validation study. Cancer 119, 3696–3702. [DOI] [PubMed] [Google Scholar]
- Crago AM, Chmielecki J, Rosenberg M, O'Connor R, Byrne C, Wilder FG, Thorn K, Agius P, Kuk D, Socci ND et al (2015) Near universal detection of alterations in CTNNB1 and Wnt pathway regulators in desmoid‐type fibromatosis by whole‐exome sequencing and genomic analysis. Genes Chromosom Cancer 54, 606–615. [DOI] [PMC free article] [PubMed] [Google Scholar]
- Denys H, Jadidizadeh A, Amini Nik S, Van Dam K, Aerts S, Alman BA, Cassiman JJ and Tejpar S (2004) Identification of IGFBP‐6 as a significantly downregulated gene by beta‐catenin in desmoid tumors. Oncogene 23, 654–664. [DOI] [PubMed] [Google Scholar]
- Dibra D, Mishra L and Li S (2014) Molecular mechanisms of oncogene‐induced inflammation and inflammation‐sustained oncogene activation in gastrointestinal tumors: an under‐appreciated symbiotic relationship. Biochim Biophys Acta 1846, 152–160. [DOI] [PMC free article] [PubMed] [Google Scholar]
- Dileo P, Pricl S, Tamborini E, Negri T, Stacchiotti S, Gronchi A, Posocco P, Laurini E, Coco P, Fumagalli E et al (2011) Imatinib response in two GIST patients carrying two hitherto functionally uncharacterized PDGFRA mutations: an imaging, biochemical and molecular modeling study. Int J Cancer 128, 983–990. [DOI] [PubMed] [Google Scholar]
- Dômont J, Salas S, Lacroix L, Brouste V, Saulnier P, Terrier P, Ranchère D, Neuville A, Leroux A, Guillou L et al (2010) High frequency of beta‐catenin heterozygous mutations in extra‐abdominal fibromatosis: a potential molecular tool for disease management. Br J Cancer 102, 1032–1036. [DOI] [PMC free article] [PubMed] [Google Scholar]
- Dou L, Liang HF, Geller DA, Chen YF and Chen XP (2014) The regulation role of interferon regulatory factor‐1 gene and clinical relevance. Hum Immunol 75, 1110–1114. [DOI] [PubMed] [Google Scholar]
- Ferrone M, Perrone F, Tamborini E, Paneni MS, Fermeglia M, Suardi S, Pastore E, Delia D, Pierotti MA, Pricl S et al (2006) Functional analysis and molecular modeling show a preserved wild‐type activity of p53(C238Y). Mol Cancer Ther 5, 1467–1473. [DOI] [PubMed] [Google Scholar]
- Fiore M, Rimareix F, Mariani L, Domont J, Collini P, Le Péchoux C, Casali PG, Le Cesne A, Gronchi A and Bonvalot S (2009) Desmoid‐type fibromatosis: a front‐line conservative approach to select patients for surgical treatment. Ann Surg Oncol 16, 2587–2593. [DOI] [PubMed] [Google Scholar]
- Gibbons DL, Pricl S, Posocco P, Laurini E, Fermeglia M, Sun H, Talpaz M, Donato N and Quintás‐Cardama A (2014) Molecular dynamics reveal BCR‐ABL1 polymutants as a unique mechanism of resistance to PAN‐BCR‐ABL1 kinase inhibitor therapy. Proc Natl Acad Sci U S A 111, 3550–3555. [DOI] [PMC free article] [PubMed] [Google Scholar]
- Hamada S, Urakawa H, Kozawa E, Arai E, Ikuta K, Sakai T, Ishiguro N and Nishida Y (2016) Characteristics of cultured desmoid cells with different CTNNB1 mutation status. Cancer Med 5, 352–360. [DOI] [PMC free article] [PubMed] [Google Scholar]
- Jiang J and Struhl G (1998) Regulation of the Hedgehog and Wingless signalling pathways by the F‐box/WD40‐repeat protein Slimb. Nature 391, 493–496. [DOI] [PubMed] [Google Scholar]
- Käfer R, Usanova S, Montermann E, Loquai C, Reske‐Kunz AB and Bros M (2016) Inhibitors of β‐catenin affect the immuno‐phenotype and functions of dendritic cells in an inhibitor‐specific manner. Int Immunopharmacol 32, 118–124. [DOI] [PubMed] [Google Scholar]
- Kasper B, Baumgarten C, Bonvalot S, Haas R, Haller F, Hohenberger P, Moreau G, van der Graaf WT, Gronchi A; Desmoid Working Group (2015) Management of sporadic desmoid‐type fibromatosis: a European consensus approach based on patients’ and professionals’ expertise – a sarcoma patients EuroNet and European Organisation for Research and Treatment of Cancer/Soft Tissue and Bone Sarcoma Group initiative. Eur J Cancer 51, 127–136. [DOI] [PubMed] [Google Scholar]
- Kasper B, Gruenwald V, Reichardt P, Bauer S, Hohenberger P and Haller F (2016) Correlation of CTNNB1 mutation status with progression arrest rate in RECIST progressive desmoid‐type fibromatosis treated with imatinib: translational research results from a Phase 2 Study of the German Interdisciplinary Sarcoma Group (GISG‐01). Ann Surg Oncol 23, 1924–1927. [DOI] [PubMed] [Google Scholar]
- Kundu JK, Choi KY and Surh YJ (2006) β‐Catenin‐mediated signaling: a novel molecular target for chemoprevention with anti‐inflammatory substances. Biochim Biophys Acta 1765, 14–24. [DOI] [PubMed] [Google Scholar]
- Laurini E, Col VD, Mamolo MG, Zampieri D, Posocco P, Fermeglia M, Vio L and Pricl S (2011) Homology model and docking‐based virtual screening for ligands of the σ1 receptor. ACS Med Chem Lett 2, 834–839. [DOI] [PMC free article] [PubMed] [Google Scholar]
- Lazar AJ, Tuvin D, Hajibashi S, Habeeb S, Bolshakov S, Mayordomo‐Aranda E, Warneke CL, Lopez‐Terrada D, Pollock RE and Lev D (2008) Specific mutations in the beta‐catenin gene (CTNNB1) correlate with local recurrence in sporadic desmoid tumors. Am J Pathol 173, 1518–1527. [DOI] [PMC free article] [PubMed] [Google Scholar]
- Misemer BS, Skubitz AP, Carlos Manivel J, Schmechel SC, Cheng EY, Henriksen JC, Koopmeiners JS, Corless CL and Skubitz KM (2014) Expression of FAP, ADAM12, WISP1, and SOX11 is heterogeneous in aggressive fibromatosis and spatially relates to the histologic features of tumor activity. Cancer Med 3, 81–90. [DOI] [PMC free article] [PubMed] [Google Scholar]
- Mittempergher L, de Ronde JJ, Nieuwland M, Kerkhoven RM, Simon I, Rutgers EJ, Wessels LF and Van't Veer LJ (2011) Gene expression profiles from formalin fixed paraffin embedded breast cancer tissue are largely comparable to fresh frozen matched tissue. PLoS One 6, 1467–1473. [DOI] [PMC free article] [PubMed] [Google Scholar]
- Morgan A, Gandin I, Belcaro C, Palumbo P, Palumbo O, Biamino E, Dal Col V, Laurini E, Pricl S, Bosco P et al (2015) Target sequencing approach intended to discover new mutations in non‐syndromic intellectual disability. Mutat Res 781, 32–36. [DOI] [PubMed] [Google Scholar]
- Mullen JT, DeLaney TF, Rosenberg AE, Le L, Iafrate AJ, Kobayashi W, Szymonifka J, Yeap BY, Chen YL, Harmon DC et al (2013) β‐Catenin mutation status and outcomes in sporadic desmoid tumors. Oncologist 18, 1043–1049. [DOI] [PMC free article] [PubMed] [Google Scholar]
- Negri T, Pavan GM, Virdis E, Greco A, Fermeglia M, Sandri M, Pricl S, Pierotti MA, Pilotti S and Tamborini E (2009) T670X KIT mutations in gastrointestinal stromal tumors: making sense of missense. J Natl Cancer Inst 101, 194–204. [DOI] [PubMed] [Google Scholar]
- Neyt K, Perros F, GeurtsvanKessel CH, Hammad H and Lambrecht BN (2012) Tertiary lymphoid organs in infection and autoimmunity. Trends Immunol 33, 297–305. [DOI] [PMC free article] [PubMed] [Google Scholar]
- Nishida Y, Tsukushi S, Urakawa H, Hamada S, Kozawa E, Ikuta K, Ando Y and Ishiguro N (2015) Low‐dose chemotherapy with methotrexate and vinblastine for patients with desmoid tumors: relationship to CTNNB1 mutation status. Int J Clin Oncol 20, 1211–1217. [DOI] [PubMed] [Google Scholar]
- Okamura T, Morita K, Iwasaki Y, Inoue M, Komai T, Fujio K and Yamamoto K (2015) Role of TGF‐β3 in the regulation of immune responses. Clin Exp Rheumatol 33, S63–S69. [PubMed] [Google Scholar]
- Pierotti MA, Negri T, Tamborini E, Perrone F, Pricl S and Pilotti S (2010) Targeted therapies: the rare cancer paradigm. Mol Oncol 4, 19–37. [DOI] [PMC free article] [PubMed] [Google Scholar]
- Pierotti MA, Tamborini E, Negri T, Pricl S and Pilotti S (2011) Targeted therapy in GIST: in silico modeling for prediction of resistance. Nat Rev Clin Oncol 8, 161–170. [DOI] [PubMed] [Google Scholar]
- Pokutta S, Choi HJ, Ahlsen G, Hansen SD, Weis WI (2014) Structural and thermodynamic characterization of cadherin β‐catenin α‐catenin complex formation. J Biol Chem 289, 13589–13601. [DOI] [PMC free article] [PubMed] [Google Scholar]
- Pricl S, Cortelazzi B, Dal Col V, Marson D, Laurini E, Fermeglia M, Licitra L, Pilotti S, Bossi P and Perrone F (2015) Smoothened (SMO) receptor mutations dictate resistance to vismodegib in basal cell carcinoma. Mol Oncol 9, 389–397. [DOI] [PMC free article] [PubMed] [Google Scholar]
- Ravo M, Mutarelli M, Ferraro L, Grober OM, Paris O, Tarallo R, Vigilante A, Cimino D, De Bortoli M, Nola E et al (2008) Quantitative expression profiling of highly degraded RNA from formalin‐fixed, paraffin‐embedded breast tumor biopsies by oligonucleotide microarrays. Lab Invest 88, 430–440. [DOI] [PubMed] [Google Scholar]
- Romero S, Szafranska J, Cabrera E, Gonzalez A, Peiró A, Llauger J, Ortega L, Bague S, Canet B, Espinosa I et al (2012) Role of tumor‐associated macrophages and angiogenesis in desmoid‐type fibromatosis. Virchows Arch 461, 117–122. [DOI] [PubMed] [Google Scholar]
- Salas S, Chibon F, Noguchi T, Terrier P, Ranchere‐Vince D, Lagarde P, Benard J, Forget S, Blanchard C, Dômont J et al (2010) Molecular characterization by array comparative genomic hybridization and DNA sequencing of 194 desmoid tumors. Genes Chromosom Cancer 49, 560–568. [DOI] [PubMed] [Google Scholar]
- Signoroni S, Frattini M, Negri T, Pastore E, Tamborini E, Casieri P, Orsenigo M, Da Riva L, Radice P, Sala P et al (2007) Cyclooxygenase‐2 and platelet‐derived growth factor receptors as potential targets in treating aggressive fibromatosis. Clin Cancer Res 13, 5034–5040. [DOI] [PubMed] [Google Scholar]
- Skubitz KM and Skubitz AP (2004) Gene expression in aggressive fibromatosis. J Lab Clin Med 143, 89–98. [DOI] [PubMed] [Google Scholar]
- Spranger S, Bao R and Gajewski TF (2015) Melanoma‐intrinsic catenin signaling prevents anti‐tumour immunity. Nature 523, 231–235. [DOI] [PubMed] [Google Scholar]
- Vallacchi V, Vergani E, Camisaschi C, Deho P, Cabras AD, Sensi M, De Cecco L, Bassani N, Ambrogi F, Carbone A et al (2014) Transcriptional profiling of melanoma sentinel nodes identify patients with poor outcome and reveal an association of CD30(+) T lymphocytes with progression. Cancer Res 74, 130–140. [DOI] [PubMed] [Google Scholar]
- Waggott D, Chu K, Yin S, Wouters BG, Liu F and Boutros PC (2012) NanoStringNorm: an extensible R package for the pre‐processing of NanoString mRNA and miRNA data. Bioinformatics 28, 1546–1548. [DOI] [PMC free article] [PubMed] [Google Scholar]
- Wei F, Yang D, Tewary P, Li Y, Li S, Chen X, Howard OM, Bustin M, Oppenheim JJ (2014) Alarmin HMGN1 contributes to antitumor immunity and is a potent immunoadjuvant. Cancer Res 74, 5989–5998. [DOI] [PMC free article] [PubMed] [Google Scholar]
- Wen AY, Sakamoto KM and Miller LS (2010) The role of the transcription factor CREB in immune function. J Immunol 185, 6413–6419. [DOI] [PMC free article] [PubMed] [Google Scholar]
- Wencke W, Sánchez‐Cabo F and Ricote M (2015) GOplot: an R package for visually combining expression data with functional analysis. Bioinformatics 31, 2912–2914. [DOI] [PubMed] [Google Scholar]
- Wilkerson MD and Hayes DN (2010) ConsensusClusterPlus: a class discovery tool with confidence assessments and item tracking. Bioinformatics 26, 1572–1573. [DOI] [PMC free article] [PubMed] [Google Scholar]
- Zou W, Wolchok JD, Chen L (2016) PD‐L1 (B7‐H1) and PD‐1 pathway blockade for cancer therapy: mechanisms, response biomarkers, and combinations. Sci Transl Med 8, 328rv4. [DOI] [PMC free article] [PubMed] [Google Scholar]
Associated Data
This section collects any data citations, data availability statements, or supplementary materials included in this article.
Supplementary Materials
Table S1. Binding free energies (ΔGbind) and binding free energy differences (ΔΔGbind) for the WT, T41A and S45F β‐catenin in complex with α‐catenin.
Table S2. List of the 382 genes differentially expressed between mutated‐ and wt‐DT patients.
Data S1. Computational details.