

Abstract
High throughput gene expression profiling has showed great promise in providing insight into molecular mechanisms. Metastasis‐related mRNAs may potentially enrich genes with the ability to predict cancer recurrence, therefore we attempted to build a recurrence‐associated gene signature to improve prognostic prediction of colorectal cancer (CRC). We identified 2848 differentially expressed mRNAs by analyzing CRC tissues with or without metastasis. For the selection of prognostic genes, a LASSO Cox regression model (least absolute shrinkage and selection operator method) was employed. Using this method, a 13‐mRNA signature was identified and then validated in two independent Gene Expression Omnibus cohorts. This classifier could successfully discriminate the high‐risk patients in discovery cohort [hazard ratio (HR) = 5.27, 95% confidence interval (CI) 2.30–12.08, P < 0.0001). Analysis in two independent cohorts yielded consistent results (GSE14333: HR = 4.55, 95% CI 2.18–9.508, P < 0.0001; GSE33113: HR = 3.26, 95% CI 2.16–9.16, P = 0.0176). Further analysis revealed that the prognostic value of this signature was independent of tumor stage, postoperative chemotherapy and somatic mutation. Receiver operating characteristic (ROC) analysis showed that the area under ROC curve of this signature was 0.8861 and 0.8157 in the discovery and validation cohort, respectively. A nomogram was constructed for clinicians, and did well in the calibration plots. Furthermore, this 13‐mRNA signature outperformed other known gene signatures, including oncotypeDX colon cancer assay. Single‐sample gene‐set enrichment analysis revealed that a group of pathways related to drug resistance, cancer metastasis and stemness were significantly enriched in the high‐risk patients. In conclusion, this 13‐mRNA signature may be a useful tool for prognostic evaluation and will facilitate personalized management of CRC patients.
Keywords: colorectal cancer, gene signature, prognosis, recurrence‐free survival
Abbreviations
- AJCC
American Joint Committee on Cancer
- AUC
area under receiver operating characteristic
- CI
confidence interval
- CRC
colorectal cancer
- DFS
disease‐free survival
- GEO
Gene Expression Ominus
- HR
hazard ratio
- LASSO
least absolute shrinkage and selection operator method
- RFS
recurrence‐free survival
- ROC
receiver operating characteristic
- ssGSEA
single‐sample gene‐set enrichment analysis
- TNM
TNM Classification of Malignant Tumours
1. Introduction
Colorectal cancer (CRC) is one of the most common cancers worldwide. It ranks as the fourth leading cause of cancer death after lung, liver, and stomach cancer (Ferlay et al., 2015). Currently, surgery and chemotherapy are the most common treatments, and the treatment selection is mainly based on the tumor stage. The American Joint Committee (AJCC) staging system on cancer has been widely used for cancer management clinically (Kawaguchi et al., 2013; Marrelli et al., 2012). However, the TNM Classification of Malignant Tumours staging method (TNM; AJCC 6th edn) cannot provide accurate information to clinicians for predicting patient survival time. The higher TNM stage is generally associated with a poorer outcome. However, the prognosis for stage IIb patients is significantly worse than for those with stage IIIa (O'Connell et al., 2004). Tumor stage can help guide chemotherapy for CRC patients, and adjuvant chemotherapy is accepted as standard regimen for these stage III patients (NIH Consensus Conference, 1990), but it is still debatable for those with stage II (Benson et al., 2004; Figueredo et al., 2008; Ratkin, 1997), indicating that the TNM staging system is not totally recommended for the management of CRC. These limitations have prompted a search for new biomarkers for discrimination of high‐risk patients to improve personalized cancer care.
CRC is of a high heterogeneity, originating from complex interactions between environmental and genetic factors (Lichtenstein et al., 2000). Some critical genes and/or associated signaling pathways, such as chromosomal instability, RAS, Wnt, and other pathways (Malumbres and Barbacid, 2003; Pino and Chung, 2010; Sparks et al., 1998) are implicated in the initiation, progression, and metastasis of CRC. Great efforts have been made to identify the molecular markers for prognosis prediction. However, a systemic analysis has found conflicting evidence as to the prognostic significance of genes commonly implicated in the pathogenesis of CRC (Anwar et al., 2004).
In recent years, many studies have focused on gene expression profiles in CRC; these have shown great promise for predicting prognosis in individual patients. A test approved by the US Food and Drug Administration (MammaPrint; Agendia, Amsterdam, the Netherlands) has been successfully developed for prognostic prediction in breast cancer (Glas et al., 2006; van ‘t Veer et al., 2002). Several gene signatures have also been established to distinguish the prognosis of patients beyond the CRC clinicopathological features; however, most of them are not used clinically (Agesen et al., 2012; Jensen et al., 2015; O'Connell et al., 2010; Oh et al., 2012; Schell et al., 2016; van der Stok et al., 2016). Thus, identifying a more powerful and practical gene signature for prognosis prediction is of great clinical significance.
We mined previously published gene expression microarray data from the Gene Expression Omnibus (GEO), and conducted mRNA profiling on large cohorts of CRC patients. The differentially expressed mRNAs were identified by analyzing the metastasized and non‐metastasized CRC tissues. According to the TNM staging system (AJCC 6th edn), non‐metastasized and metastasized patients belonged to different tumor stages and demonstrated significantly different outcomes (O'Connell et al., 2004). Thus these metastasis‐related expression changes might be enriched with genes with potential prognostic predictive value, useful for developing a gene signature for predication of recurrence of these mRNAs. For selection of prognostic genes, the least absolute shrinkage and selection operator method (LASSO) has been extensively applied in high‐dimensional microarray data (Gui and Li, 2005; Tibshirani, 1997; Zhang et al., 2013). By this way, we identified a 13‐mRNA signature in discovery set GSE17536 to predict recurrence‐free survival (RFS) for patients with CRC. RFS was defined as the incidence of recurrence after resection, which was also called disease‐free survival (DFS) (Jorissen et al., 2009; Kemper et al., 2012; Smith et al., 2010). We validated it in another two independent cohorts (GSE14333 and GSE33113) and assessed the prognostic value of this gene signature in discovery and validation datasets. Furthermore, a comparison was made between our 13‐mRNA signature and other three important gene signatures, including OncotypeDX colon cancer assay (Srivastava et al., 2014).
2. Materials and methods
2.1. CRC gene expression data
CRC gene expression data and corresponding clinical data used in this study are available on arrayexpress (http://www.ebi.ac.uk/arrayexpress/) and GEO (https://www.ncbi.nlm.nih.gov/geo/). All data with raw data CEL files were under the same chip platform (Affymetrix human genome u133 plus 2.0 chips). The raw data were downloaded and normalized using a robust multi‐array averaging method (Irizarry et al., 2003). We processed the Affymetrix data using ‘affy’ and ‘affycoretools’ packages of r software (version 3.3.1, R Foundation for Statistical Computing Vienna, Austria). This well‐defined process consisted of the following steps: first, importing the ‘raw’ data in.CEL format and the associated clinical information; secondly, summarizing the expression values for each probe set; the last step included background correction, normalization and summarizing. After excluding the samples without valuable clinical survival information, 556 patients in four datasets were used in this study, including GSE64256 (n = 125), GSE17536 (n = 145), GSE14333 (n = 197), GSE33113 (n = 89) (see Tables [Link], [Link], [Link]). Tumors in GSE14333 were recorded with Dukes’ stages, which were converted to AJCC stages based on the AJCC Colon and Rectum Cancer staging, 7th Edition, in order to maintain consistency with other datasets. GSE64256 dataset was used to identify the differentially expressed mRNAs between 26 metastasized samples and 99 non‐metastasized samples. Dataset GSE17536 was used as the discovery set to screen out the prognostic gene signature from the differentially expressed mRNAs. The gene signature was then validated in GSE14333 and GSE33113 datasets. The flowchart of this study was depicted in Fig. S1.
2.2. Identification and validation of the prognostic gene signature
At first, to construct the prognostic gene signature from the metastasis‐related mRNAs, the ‘limma’ package of r software (version 3.3.1) was used to generate the differentially expressed mRNAs whose parameter P‐value was less than 0.05 between metastasized samples and non‐metastasized samples in GSE64256. Then, r software (version 3.3.1) and the ‘glmnet’ package (R Foundation for Statistical Computing, Vienna, Austria) were used to perform the LASSO Cox regression model analysis in the discovery dataset GSE17536. The penalized Cox regression model with LASSO penalty was used to achieve shrinkage and variable selection simultaneously, and the optimal values of the penalty parameter lambda were determined through 10‐times cross‐validations (Goeman, 2010; Tibshirani, 1997). Based on the optimal lambda value, a list of prognostic genes with associated coefficients was screened out from the metastasis‐related mRNAs based on the gene expression profiling and RFS data. The risk score for each patient was then calculated based on the expression level of each prognostic mRNA and its associated coefficient. The patients in each dataset were split into a low‐risk and a high‐risk group according to the median risk score. The median value of the risk score was set as the cut‐off, since its clinical application is easy. Finally, the Kaplan–Meier estimator and the log‐rank test were introduced to assess RFS differences between the low‐risk and high‐risk groups. The gene signature was validated in two independent datasets. The risk scores were calculated using the same formula as in the discovery set. Each dataset was divided into two risk groups based on the median risk score and the RFS differences were analyzed as above.
2.3. Statistical analysis
Univariable and multivariable Cox regression were performed to investigate whether this gene signature was independent of age, gender and tumor stage. Receiver operating characteristic (ROC) analysis was used to assess the sensitivity and specificity of the survival prediction based on the multi‐mRNA risk score, tumor stage, combined model of risk score and tumor stage, and prognostic indexes of other gene signatures. An area under ROC curve (AUC) was used as a measure of the accuracy in diagnostic tests (Bunger and Mallet, 2016). We adopted the ‘pROC’ package for ROC analysis, and the method ‘delong’ was used to test the significance of differences between the ROC curves. For ROC analysis, it was necessary to exclude patients who had not had a recurrence at the time of the last follow‐up and in whom RFS duration was less than the median RFS. The remaining patients were classified into two subgroups based on the median RFS (Kang et al., 2012).
Survival times of patients were from the date of surgery to the time of recurrence or the date on which data were taken, based on the method of Kaplan–Meier. The curves were analyzed using the log rank test. A P‐value less than 0.05 was set as the significant difference for all the Cox regression analyses, log‐rank tests and ROC analyses.
2.4. Construction of nomogram
The nomogram and calibration plots were generated using the ‘rms’ package of r software (version 3.3.1). The predictive accuracy of a nomogram was assessed by a concordance index which investigated the level of consistency between the actual observed outcome frequencies and predicted probabilities (Wang et al., 2013). After the construction of nomogram model, cross‐validation was performed to address model overfitting; a bootstrap resampling method was adopted to generate the confidence interval (CI) for concordance indexes (Pencina and D'Agostino, 2004; Wang et al., 2013). A calibration plot was used to visualize the performance of the nomogram. Nomogram‐predicted recurrence and observed outcome were plotted on the x‐axis and y‐axis, respectively; the 45° line represented the best prediction.
2.5. Gene set enrichment analysis
To identify the differentially expressed gene sets between the low‐risk and high‐risk subgroups, single sample gene set enrichment analysis (ssGSEA) was performed. Enrichment scores in each sample were calculated using the ‘GSVA’ package of r software (version 3.3.1) and its ssGSEA method (http://www.bioconductor.org) (Hanzelmann et al., 2013). The enrichment score represented the degree of absolute enrichment of a certain gene set in each sample within a dataset (Barbie et al., 2009; Subramanian et al., 2005). The risk‐associated gene sets (adjusted P‐value < 0.001) were identified for further analysis. For correlation analysis, ‘corrplot’ package was used, and the correlation coefficients, CI and P‐values were calculated using r software.
3. Results
3.1. Development and validation of prognostic 13‐mRNA signature
A set of 2848 differentially expressed mRNAs between metastasized and non‐metastasized tumors was identified from dataset GSE64256. LASSO Cox regression model was applied for further analysis of these 2848 genes in the discovery set GSE17536 (see Fig. S2). We identified a 13‐mRNA signature that was significantly correlated with RFS in CRC patients. Table S4 shows a list of probes with associated coefficients which were generated from the LASSO analysis.
The risk score for each patient was calculated based on the expression levels of all 13 genes in the multivariate model and their associated coefficients (see Table S5). Among the 13‐mRNAs, 11 genes had positive coefficients – THBS2, CAV2, SCG2, SLC6A1, SAV1, EZ6L2, ERO1A, RAB3B, OBSL1, CD109, and PTPN14. The coefficients for the other two genes (MRPL35, LRPAP1) were negative. For the CRC patients, the higher risk score meant a poorer prognosis; thus the higher expression levels of genes with a positive weighting coefficient indicated higher risk scores, and an increased risk of recurrence. Conversely, the higher expression levels of genes with a negative coefficient were associated with a better outcome.
The 13‐mRNA signature risk score for each patient was calculated in the discovery set GSE17536 (min: 13.18, median: 13.98, max: 15.48). In survival analysis, a dichotomous score was adopted. The patients were divided into a low‐risk group (n = 73) and a high‐risk group (n = 72) based on the median risk score. Patients in the high‐risk group demonstrated a worse outcome compared with those in the low‐risk group (HR = 5.27, 95% CI 2.30–12.08, P < 0.0001) (Fig. 1A). The univariable and multivariable Cox regression analyses also showed that the 13‐mRNA risk score was significantly associated with RFS as a continuous variable (P < 0.0001) (Fig. 2A,B). The distribution of risk score, the recurrence status of the CRC patients, and the mRNA expression profiling were analyzed and the results showed that significantly more patients had a recurrence in the high‐risk group than in the low‐risk group, and the expression levels of genes with positive coefficients were higher in high‐risk patients (Fig. S3).
Figure 1.

Kaplan–Meier estimates of the patients’ recurrence using the 13‐mRNA signature. The Kaplan–Meier plots were used to visualize the patients’ recurrence probabilities for the low‐risk versus high‐risk group of patients based on the median risk score from corresponding GEO datasets. (A) Kaplan–Meier curves for discovery dataset GSE17536 patients (n = 145). (B) Kaplan–Meier curves for GSE14333 patients (n = 197). (C) Kaplan–Meier curves for GSE33113 patients (n = 89). The tick marks on the Kaplan–Meier curves represent the subjects studied. The differences between the two curves were determined by the two‐sided log‐rank test.
Figure 2.

Forest plot summary of analyses of recurrence‐free survival (RFS). Univariable and multivariable analyses of the 13‐mRNA risk score, age, gender, and tumor stage on GSE17536 (A,B) and GSE14333 (C,D) datasets. The blue squares on the transverse lines represent the hazard ratio (HR), and the red transverse lines represent 95% CI. Risk score and age are continuous variables, gender and tumor stage are discontinuous variables.
The efficacy of the 13‐mRNA signature for prognosis prediction of CRC patients was further validated in two independent datasets (GSE14333 and GSE33113). Patients were classified into a high‐risk and a low‐risk group using the same risk score‐based classifier; the median risk score in each dataset was taken as the cut‐off value. Consistent with the findings described above, high‐risk patients in the GSE14333 cohort had a significantly shorter median RFS compared with low‐risk patients (HR = 4.55, 95% CI 2.18–9.50, P < 0.0001) (Fig. 1B). Analysis in the GSE33113 dataset produced similar results (HR = 3.26, 95% CI 1.16–9.16, P = 0.0176) (Fig. 1C). The univariable and multivariable Cox regression analyses also showed that the association of 13‐mRNA risk score with RFS was statistically significant as a continuous variable in the GSE14333 cohort (Fig. 2C,D).
We also performed a Chi‐square test to investigate whether the recurrence status was associated with risk stratification (low‐risk group versus high‐risk group). Results showed that the P‐values in all three cohorts were less than 0.05. Moreover, more samples in the patients with recurrence fell into the high‐risk group, in which the range and median of RFS were shorter than that in low‐risk group (Table S2).
3.2. Prognostic value of the 13‐mRNA signature
To investigate whether the prognostic value of the 13‐mRNA signature was independent of tumor stage, the univariable and multivariable Cox regression analyses were performed using the risk score, age, gender, and tumor stage as covariates. We found that both the risk score and tumor stage were significantly associated with RFS even when adjusted by other clinical factors in GSE17536; there were no stage IV patients in GSE14333 (Fig. 2A–D). Then the stratification analysis was introduced based on tumor stage. Patients were stratified into two subgroups where AJCC stage I and II were fictitiously defined as early‐stage stratum and AJCC stage III and IV as late‐stage stratum. Regardless of the stratum, the 13‐mRNA signature still had the capability to distinguish high‐risk patients. Figure 3A showed that the prognosis of high‐risk patients was significantly worse than that of low‐risk patients in the early‐stage stratum of the GSE17536 cohort (HR = 6.52, 95% CI 1.53–27.8, P = 0.0009), consistent with the results in the late‐stage stratum of the GSE17536 cohort (HR = 2.46, 95% CI 1.28–4.75, P = 0.0042) (Fig. 3B). Stratification analysis of another dataset, GSE14333, yielded similar results; Fig. 3C shows the results in the early‐stage stratum of this cohort (HR = 3.55, 95% CI 1.46–8.63, P = 0.0014), and Fig. 3D the results in the late‐stage (HR = 2.28, 95% CI 1.20–4.35, P = 0.0081). These results indicate that the prognostic value of the 13‐mRNA signature was independent of tumor stage. We also assessed the prognostic ability of 13‐mRNA signature in patients based on postoperative chemotherapy, somatic mutation, and tumor location in dataset GSE14333. The patients were stratified into different subgroups, including patients with postoperative chemotherapy, patients without postoperative chemotherapy, patients with BRAF gene mutation, patients whose KRAS gene and BRAF gene were both wild‐type, patients with left‐sided CRC, patients with right‐sided CRC, and patients with rectum carcinoma. Interestingly, we found that except for the subgroup of rectum carcinoma, high‐risk patients in all the subgroups were inclined to have unfavorable RFS (Figs 3E–H, S4).
Figure 3.

Kaplan–Meier survival analysis to evaluate the independence of the 13‐mRNA signature from AJCC stage, postoperative chemotherapy, and somatic muation. The patients from GSE62254 and GSE14333 were stratified into subgroups. The 13‐mRNA signature was applied to the low‐stage patients (A,C), high‐stage patients (B,D), patients with postoperative chemotherapy (E), patients without postoperative chemotherapy (F), patients with Braf gene mutation (G) or patients whose Kras gene and Braf genes were both wild type (H), separately.
We also performed ROC analysis to demonstrate the sensitivity and specificity of survival prediction in GSE17536 and GSE14333 sets. AUC was evaluated and compared between the 13‐mRNA risk score model and tumor stage. Figure 4A showed that the 13‐mRNA risk score model possessed a stronger predictive power than AJCC stage for the prognostic evaluation of CRC patients in the discovery cohort GSE17536 (0.8861 versus 0.6687, 95% CI 0.8197–0.9525 versus 0.5726–0.7647, P < 0.0001). When the 13‐mRNA risk score model was combined with tumor stage, no significant difference was found between the combined model and the 13‐mRNA risk score model (0.9190 versus 0.8861, 95% CI 0.8671–9710 versus 0.8197–0.9525, P = 0.0757). Analysis in the validation cohort GSE14333 produced similar results (Fig. 4B). The results from the validation dataset further confirmed the reliable predictive ability of the 13‐mRNA risk score model.
Figure 4.

Receiver operating characteristic (ROC) analysis of the sensitivity and specificity of the recurrence prediction by the 13‐lncRNA risk score, tumor stage, oncotypeDX colon, ColoGuideEx, and Sang_signature in GSE17536 (n = 145) and GSE14333 (n = 197). P‐values were from the comparisons of the area under the ROC (AUC) of 13‐mRNA risk score combined with AJCC stage versus AUC of 13‐mRNA risk score, AJCC stage, oncotypeDX colon, ColoGuideEx, and Sang_signature separately.
3.3. Construction of nomogram based on 13‐mRNA signature
To develop a practical method for clinicians to predict the probability of CRC recurrence, a nomogram was constructed which integrated the 13‐mRNA signature, tumor stage, and tumor differentiation (Fig. 5A). Figure 5B showed that the line‐segment in the calibration plots was very close to the 45° line which represented the best prediction, indicating that the nomogram did quite well. The predictive accuracy of the nomogram was calculated through ROC analysis: the AUC of nomogram is 0.9206, as shown in Fig. 5C.
Figure 5.

The nomogram to predict risk of cancer recurrence in GSE17536. (A) The nomogram for predicting proportion of patients with recurrence‐free survival. (B) The calibration plots for predicting recurrence at 3 years. Nomogram‐predicted probability of recurrence is plotted on the x‐axis; actual recurrence is plotted on the y‐axis. The solid line represents our nomogram and the vertical bars represent 95% CIs. (C) ROC curve based on the nomogram for recurrence probability.
3.4. Comparison with other known gene signatures
To further investigate the predictive power of the 13‐mRNA risk score model, some important gene signatures for prognosis prediction in CRC were analyzed in GSE17536 and GSE14333, including oncotypeDX colon cancer assay, ColoGuideEx, and Sang_signature (Agesen et al., 2012; Oh et al., 2012; Srivastava et al., 2014). Our study was not a comprehensive review of all biomarkers associated with CRC; the three selected signatures represented a purposive convenience sample. According to the associated formula, the prognostic indexes were calculated respectively (Table S5). We performed the univariable Cox regression analysis to investigate the association between each prognostic index and RFS, using the prognostic indexes as continuous variables. Figure S5 showed that except for the 13‐mRNA risk score model, only the oncotypeDX colon cancer assay was significantly associated with RFS. Moreover, the hazard ratio of the 13‐mRNA risk score model was significantly larger than that of oncotypeDX colon cancer assay. In the GSE17536 and GSE14333 datasets, the median RFS was 37.31 and 38.07 months, respectively. The patients whose follow‐up duration was less than median RFS were excluded if they still did not recur in the most recent follow‐up. ROC analysis was then performed (Fig. 4A,B); the AUC of the 13‐mRNA risk score model was significantly greater than that of other gene signatures. Remarkably, the selected gene signatures above mainly applied to prognosis predictions for stage II and III patients (Agesen et al., 2012; You et al., 2015). For a fair comparison, ROC analysis was carried out for stage II and III patients in dataset GSE17536, and yielded the similar results (Fig. S6), indicating that the 13‐mRNA risk score model outperformed other classifiers.
3.5. Identification of 13‐mRNA signature‐associated biological pathways
We performed ssGSEA analysis in dataset GSE17536 to identify the 13‐mRNA‐associated signaling pathways. The patients were divided into low‐ or high‐risk groups based on the 13‐mRNA model. Figure 6A showed that a group of pathways related to drug resistance, cancer metastasis, and stemness were significantly more activated in the high‐risk patients than low‐risk ones. Interestingly, these pathways and the risk score showed the same trend; with the increase of the risk score, the degree of enrichment gradually increased in the associated pathways. The association between the risk score and the pathways was further validated through correlation analysis, and the results confirmed the close relevance between them (P < 0.0001) (Fig. 6B, Table S6).
Figure 6.
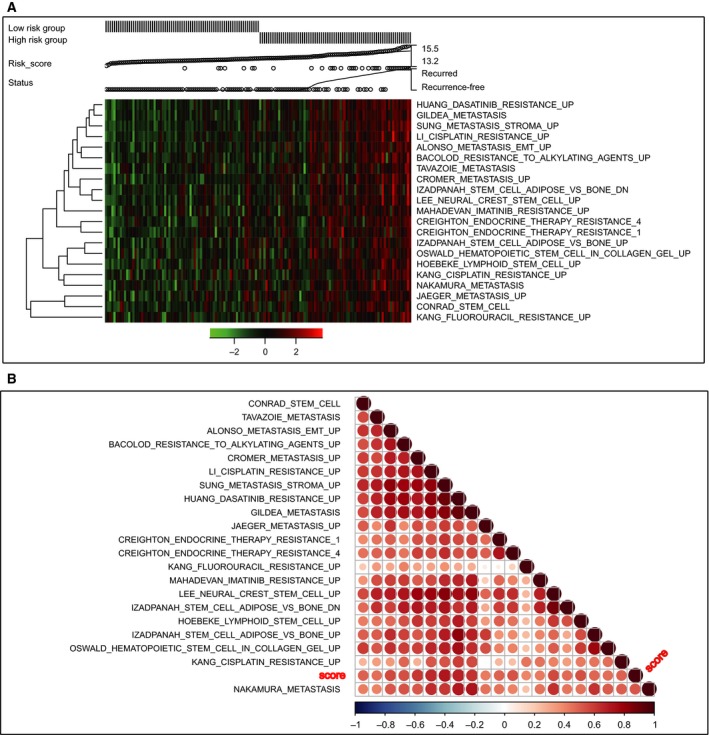
Pathway profiles across dataset GSE17536. Rows represent pathways, and columns represent patients. Each grid represents a score of pathway activity calculated by single‐sample GSEA. No further adjustment of the ssGSEA score was performed. The upper horizontal bar marked the information related to every patient, including the risk group, risk score (from low to high), and the recurrence status.
4. Discussion
Microarray profiling has received much attention in recent years, and has shown great promise in gaining an insight into molecular mechanisms through the analysis of thousands of genes (Cristescu et al., 2015; De Sousa et al., 2013). In our study, a 13‐mRNA signature was constructed for prognostic predication in CRC. When stratified by important clinicopathological factors, the 13‐mRNA signature retained a strong prognostic ability. Moreover, it outperformed other known gene signatures, indicating that it could improve the prediction of disease recurrence in CRC with considerable reliability and robustness.
For survival analysis, the Cox proportional hazards regression analysis is wide used at present. However, it is not suitable for high‐dimensional microarray data (Simon and Altman, 1994). Overfitting is one common limitation in modeling high‐dimensional microarray data for the selection of prognostic genes. The LASSO method could remove this limitation and was applied in our study for optimal selection of genes (Goeman, 2010; Tibshirani, 1997). Using this method, a 13‐mRNA signature was created by exploring the correlation between gene expression profiles and clinical outcome of CRC patients in the discovery dataset and was verified in two independent datasets, indicating favorable reproducibility.
The current TNM staging system (AJCC 6th edn) was closely associated with patient prognosis (O'Connell et al., 2004). The univariable and multivariable Cox regression analyses in our study consistently showed that tumor stage was a significant prognostic factor in the discovery and validation cohorts. Stratification analysis was therefore performed to investigate whether this 13‐mRNA signature was independent of tumor stage. The results showed that it could also discriminate the high‐risk patients from the stratified groups in the discovery and validation cohorts.
One important question should be mentioned here. The ethnicity in these three cohorts differed, as well as the constitution of tumor stages. Our discovery dataset (GSE17536) contained patients in all four AJCC stages; however, one validation dataset (GSE14333) had no AJCC stage IV patients; and another validation dataset (GSE33113) consisted only of AJCC stage II patients. The inconsistency in the constitution of tumor stages might increase the difficulty of validating our signature. The successful validation indicated that our gene signature was not only across populations, but was also independent of tumor stage, which was in accordance with the results of the stratification analysis above. As our signature was independent of tumor stage, it could be considered that the discrepancy in constitution of tumor stages did not affect the representativeness of these cohorts. Thus, the conclusions in our analyses were convincing.
Sporadic CRCs occurred through the accumulation of somatic genetic and epigenetic events (Carethers and Jung, 2015). Coincidentally, GSE14333 provided the information about KRAS and BRAF mutations, which were associated with a poor outcome in CRC. Moreover, the emergence of KRAS/NRAS mutations might underlie acquired resistance to target therapy in CRC (Dienstmann et al., 2015; Van Cutsem et al., 2011). Another important prognostic factor was adjuvant chemotherapy, which could significantly improve the outcome of CRC patients, especially for stage III patients (Ratkin, 1997); however, a study indicated that adjuvant FOLFOX for primary CRC was associated with a high frequency of somatic mutations in liver metastases and poor prognosis (Andreou et al., 2012). The interaction between these factors made it complex even for the prognostic prediction in CRC, necessitating further analysis to confirm the independence of our 13‐mRNA signature. Thus the CRC patients were also stratified into subgroups based on postoperative chemotherapy and somatic mutation. In accordance with the results above, the 13‐mRNA signature retained the ability to predict recurrence in all subgroups, indicating that this 13‐mRNA signature was independent of tumor stage, postoperative chemotherapy, and somatic mutation, and might complement clinicopathological features. Recent studies have shown that right‐ and left‐sided CRCs had different epidemiologic and histological characteristics, as well as underlying biologic mechanisms (Benedix et al., 2010; Bufill, 1990; Lee et al., 2017). However, when we stratified the patients by tumor location in GSE14333, we found that our 13‐mRNA signature could not discriminate high‐risk patients from the subgroup of rectum carcinoma. This result indicated that our signature may only apply to left‐sided or right‐sided CRCs. Note that there were only 23 patients with rectum carcinoma, so bias might have occurred in the stratification analysis. It is necessary to enlarge the sample size to generate more reliable results.
ROC analysis showed that our 13‐mRNA signature was superior to tumor stage for prognostic evaluation. To further improve the ability of prognostic prediction, we combined the 13‐mRNA risk model with tumor stage. There was no significant difference between the combined model and our gene signature, indicating that our 13‐mRNA signature could yield results by itself.
As a result of poor reproducibility, most established signatures have not been used clinically for prognostic prediction in CRC. The reasons of poor reproducibility are manifold. In early studies, small sample series and lack of validation in independent samples limited the strength of the conclusions. Besides, some gene signatures use too many genes for the construction of a model, which inhibits the clinical utility. Importantly, most studies of gene signatures are retrospective; the good reproducibility is still hampered by the lack of validation in prospective multicenter studies. To confirm further the availability of our 13‐mRNA signature, we chose three important gene signatures for comparison analysis in the discovery and validation datasets. Among them, both OncotypeDX colon cancer assay and ColoGuideEx have now been used clinically for CRC survival analysis (Agesen et al., 2012; O'Connell et al., 2010). As a new diagnostic test for determining the likelihood of recurrence in stage II colon cancer patients after surgical resection, OncotypeDX colon cancer assay has been commercially available worldwide since 2010 (Clark‐Langone et al., 2010; Webber et al., 2010). Specially, the effectiveness of the Oncotype DX colon cancer assay has been validated in a prospective multicenter study for the prediction of recurrence risk in stage II colon cancer patients (Brenner et al., 2016; Srivastava et al., 2014). Yothers et al. (2013) also found that incorporating the OncotypeDX colon cancer assay might better inform adjuvant therapy decisions in stage II and III colon cancer. Sang_signature could discriminate patient prognosis, as well as predict the response to adjuvant chemotherapy (Oh et al., 2012). Both Oncotype DX colon cancer assay and ColoGuideEx measured RFS risk as outcome, and Sang_signature used DFS, which was the same as RFS. So the three signatures were suitable for comparison with our signature. The results revealed that the 13‐mRNA signature was more significantly associated with RFS, and had more powerful ability for prognostic predication compared with the other gene signatures. Considering that Oncotype DX colon cancer assay and ColoGuideEx were more suitable for the stage II and III patients, these patients were selected for further comparison in discovery dataset GSE17536. Interestingly, our gene signature still significantly outperformed other gene signatures. The results indicated that this 13‐mRNA signature might be a useful tool for the management of CRC patients. As our study was retrospective, its reliability still needs further validation in a large prospective study.
As the 13‐mRNA signature showed considerable ability to discriminate the high‐risk patients based on risk score, the underlying molecular mechanism needs to be investigated. Studies revealed that cancer metastasis, drug resistance, and cancer stemness exerted an adverse impact on patient prognosis, and posed significant confusion among clinicians (Chau et al., 2004; Di Franco et al., 2014; Wicki et al., 2016). Coincidentally, the results of ssGSEA demonstrated that the 13‐mRNA signature was significantly associated with these pathways, which were highly enriched in the high‐risk group. A correlation analysis further confirmed this result, indicating these signaling pathways might underlie the carcinogenesis and progression of CRC, and providing a potential therapeutic target for clinic intervention.
The findings from ssGSEA analysis not only shed some light on the biogenesis of CRC, but also verified that it is reasonable to use our gene signature for prognostic prediction. The ssGSEA analysis demonstrated that our 13‐mRNA signature was closely associated with cancer metastasis, drug resistance, and cancer stemness, which are important prognostic factors (Chau et al., 2004; Di Franco et al., 2014; Wicki et al., 2016). Patients with these activated signaling pathways tend to have adverse outcomes. Thus using the 13‐mRNA signature for prognostic predication in CRC was quite logical and reliable. Meanwhile, the reason why our signature outperformed other signatures could perhaps be due partly to the appropriateness of our gene signature.
The biological functions of 13‐mRNA have been reported in previous research; however, only a few genes were investigated in CRC. THBS2 has been shown to function as a potent inhibitor of tumor growth and angiogenesis, and was associated with many kinds of diseases. Some studies indicated that it might be a biomarker for prognosis prediction of gastric and CRC (Jeong et al., 2015; Sun et al., 2014; Wang et al., 2016). CAV2 was a major component of the inner surface of caveolae, and the expression of CAV2 was necessary for the control of E2‐dependent cellular proliferation in breast cancer (Totta et al., 2016). SCG2 was a member of the chromogranin/secretogranin family of neuroendocrine secretory proteins, and it might contribute to the neuroendocrine differentiation by promoting the formation of secretory granules and the proliferation of prostate cancer cells (Courel et al., 2014). The SLC6A1 gene encoded a gamma‐aminobutyric acid (GABA) transporter, which removes GABA from the synaptic cleft (Hirunsatit et al., 2009), but there have been no studies in relation to cancer as of now. SAV is a scaffold protein containing a WW domain; SAV1 was reported to interact with HAX1 and attenuated its protective role against apoptosis in MCF‐7 breast cancer cells (Luo et al., 2011). MRPL35 encoded Mammalian mitochondrial ribosomal protein, whose impact on cancers has rarely been reported (Koc et al., 2001). SEZ6L2 encoded a seizure‐related protein, which was up‐regulated in lung cancer and was considered to be a novel prognostic marker (Ishikawa et al., 2006). ERO1A has previously been reported to be induced by hypoxia in cervical cancer cell lines (Halle et al., 2012), and it was considered to be a predictive biomarker in pancreatic ductal adenocarcinoma (Li et al., 2017). RAB3B was a member of the RAS oncogene family, which has been demonstrated to be closely implicated in CRC (Cha et al., 2016; Hoogwater et al., 2010). OBSL1 encoded a cytoskeletal adaptor protein, which was a member of the Unc‐89/obscurin family, and studies showed that 3M Syndrome was associated with this gene (Keskin et al., 2017; Marshall et al., 2015). CD109 encoded a glycosyl phosphatidylinositol‐linked glycoprotein, and some reports indicated it was concerned with the prognosis in CRC (Ashktorab et al., 2013; Yi et al., 2011). PTPN14 is a member of the protein tyrosine phosphatase family, and it has been reported to be a regulator of lymphatic function and choanal development (Au et al., 2010; Mendola et al., 2013). LRPAP1 interacts with the low density lipoprotein receptor‐related protein, and reports have shown that this gene was associated with myopia and Parkinson's disease (Khan et al., 2016; Singh et al., 2014). Up to now, most of the 13 mRNA have not been studied in CRC. Our study indicates that our method may be a new way to identify cancer‐associated genes. Studies on these prognostic genes might reveal new mechanisms underlying the carcinogenesis and development in CRC. In a word, the underlying molecular mechanism remains unclear, and the roles of these genes deserve further investigation in CRC.
Studies have shown that the benefit of adjuvant chemotherapy remains controversial in stage II CRC patients, which has created a great deal of difficulty for treatment in the clinic (O'Connell et al., 2004). Our signature possesses good power to discriminate high‐risk patients from low‐risk ones. Furthermore, pathway analysis indicated a close relation between our gene signature and drug resistance, and it therefore could help clinicians to assess the risk of recurrence and guide therapeutic regimens. In future studies, the ability of the 13‐mRNA model to assess the benefit of adjuvant chemotherapy deserves further investigation. To improve the utility in the clinic, we plan to validate our gene signature through RT‐PCR. RT‐PCR is much cheaper and easy to operate than gene microarray. This PCR‐based risk score method is the trend of the future, and will improve the management in CRC patients greatly.
The innovation of our research rests on the following aspects. First, the AUC of our 13‐mRNA signature is fairly large (> 0.8), indicating a good prognostic ability. Secondly, our study is a relatively systematic examination of prognostic gene signatures in CRC. Three representative gene signatures, including OncotypeDx, were selected for comparison analysis to verify further the prognostic power; our signature was demonstrated to be superior to all three. Thirdly, our study is of high methodological rationality. Our signature is derived from metastasis‐related mRNA, thus this signature is closely related to metastasis and should be suitable for prognostic assessment. The results of survival analyses are concordant with this hypothesis; in addition, pathway analysis confirms once again that our 13‐mRNA signature is closely associated with cancer metastasis.
There are some limitations to our study. First, one of our validation datasets, GSE33113, consisted only of stage II patients, which is not in agreement with the other two datasets. It is therefore not suitable for further analyses. Secondly, our study is retrospective and the sample size is limited, so the robustness and utility of the 13‐mRNA signature for prognostic prediction needs further validation in large prospective clinic trials, through which we can carry out a comprehensive evaluation of our signature. Thirdly, some of our analyses were hampered by a lack of detailed clinical information, which can be addressed in future through integrated data collection and detailed experimental design. Fourthly, there is still one more step to complete before clinical application. PCR‐based validation in large perspective trials will be of great clinical significance. Finally, more experimental data about these mRNA is required to elucidate the inherent association between the 13‐mRNA signature and CRC prognosis.
5. Conclusions
An innovative prognostic 13‐mRNA signature in CRC has been generated by exploring and analyzing the currently published microarray datasets. This 13‐mRNA signature is independent of tumor stage, postoperative chemotherapy, and somatic mutation. Moreover, it outperforms other known gene signatures, indicating that the 13‐mRNA signature may be a useful tool for clinicians and will facilitate personalized management of CRC patients.
Data accessibility
Research data pertaining to this article is located at figshare.com: https://doi.org/10.6084/m9.figshare.5311105
Author contributions
XT and XZ contributed equally to the work. XT drafted the manuscript. XZ and XT analyzed and interpreted all the data. TY, CY, and CS prepared the figures and tables. JH, HC, and JF reviewed and revised the manuscript. All authors approved the final manuscript.
Supporting information
Fig. S1. Schematic diagram of work flow.
Fig. S2. Cross‐validation for tuning parameter selection in the LASSO model.
Fig. S3. 13‐mRNA risk score analysis of GSE17536.
Fig. S4. Kaplan–Meier survival analysis to evaluate the independence of the 13‐mRNA signature from tumor location.
Fig. S5. Forest plot summary of the analyses of prognostic classifiers in colorectal cancer (CRC).
Fig. S6. Receiver operating characteristic (ROC) analysis of the sensitivity and specificity of the recurrence prediction by the 13‐mRNA risk score, AJCC stage, prognostic indexes of oncotypeDX and ColoGuideEx in stage II and III patients of GSE17536 (n = 145).
Table S1. The raw clinic information data for the three datasets.
Table S2. Basic characteristics of patients in three datasets.
Table S3. Extra information on the three datasets.
Table S4. mRNA significantly associated with the recurrence‐free survival in the test series patients (n = 145).
Table S5. Calculation of prognostic indexes.
Table S6. Correlation analyses between risk score and associated pathways.
Acknowledgements
This project was supported by grants from the National Natural Science Foundation of China (Grant Nos 81421001, 81320108024, 31371420, 81530072, 81402347, 81602518, and 31371273) as well as The Program for Professor of Special Appointment (2015 Youth Eastern Scholar NO. QD2015003) at Shanghai Institutions of Higher Learning; Shanghai Municipal Education Commission‐Gaofeng Clinical Medicine Grant Support (NO. 20161309); and Chenxing Project of Shanghai Jiao‐Tong University (to HC).
Contributor Information
Jie Hong, Email: jiehong97@shsmu.edu.cn.
Haoyan Chen, Email: haoyanchen@shsmu.edu.cn.
Jing‐Yuan Fang, Email: jingyuanfang@sjtu.edu.cn.
References
- Agesen TH, Sveen A, Merok MA, Lind GE, Nesbakken A, Skotheim RI and Lothe RA (2012) ColoGuideEx: a robust gene classifier specific for stage II colorectal cancer prognosis. Gut 61, 1560–1567. [DOI] [PubMed] [Google Scholar]
- Andreou A, Kopetz S, Maru DM, Chen SS, Zimmitti G, Brouquet A, Shindoh J, Curley SA, Garrett C, Overman MJ et al (2012) Adjuvant chemotherapy with FOLFOX for primary colorectal cancer is associated with increased somatic gene mutations and inferior survival in patients undergoing hepatectomy for metachronous liver metastases. Ann Surg 256, 642–650. [DOI] [PMC free article] [PubMed] [Google Scholar]
- Anwar S, Frayling IM, Scott NA and Carlson GL (2004) Systematic review of genetic influences on the prognosis of colorectal cancer. Br J Surg 91, 1275–1291. [DOI] [PubMed] [Google Scholar]
- Ashktorab H, Rahi H, Wansley D, Varma S, Shokrani B, Lee E, Daremipouran M, Laiyemo A, Goel A, Carethers JM et al (2013) Toward a comprehensive and systematic methylome signature in colorectal cancers. Epigenetics 8, 807–815. [DOI] [PMC free article] [PubMed] [Google Scholar]
- Au AC, Hernandez PA, Lieber E, Nadroo AM, Shen YM, Kelley KA, Gelb BD and Diaz GA (2010) Protein tyrosine phosphatase PTPN14 is a regulator of lymphatic function and choanal development in humans. Am J Human Genet 87, 436–444. [DOI] [PMC free article] [PubMed] [Google Scholar]
- Barbie DA, Tamayo P, Boehm JS, Kim SY, Moody SE, Dunn IF, Schinzel AC, Sandy P, Meylan E, Scholl C et al (2009) Systematic RNA interference reveals that oncogenic KRAS‐driven cancers require TBK1. Nature 462, 108–112. [DOI] [PMC free article] [PubMed] [Google Scholar]
- Benedix F, Kube R, Meyer F, Schmidt U, Gastinger I, Lippert H, Colon/Rectum Carcinomas Study, G. (2010) Comparison of 17,641 patients with right‐ and left‐sided colon cancer: differences in epidemiology, perioperative course, histology, and survival. Dis Colon Rectum 53, 57–64. [DOI] [PubMed] [Google Scholar]
- Benson AB 3rd, Schrag D, Somerfield MR, Cohen AM, Figueredo AT, Flynn PJ, Krzyzanowska MK, Maroun J, McAllister P, Van Cutsem E et al (2004) American Society of Clinical Oncology recommendations on adjuvant chemotherapy for stage II colon cancer. J Clin Oncol 22, 3408–3419. [DOI] [PubMed] [Google Scholar]
- Brenner B, Geva R, Rothney M, Beny A, Dror Y, Steiner M, Hubert A, Idelevich E, Gluzman A, Purim O et al (2016) Impact of the 12‐gene colon cancer assay on clinical decision making for adjuvant therapy in stage ii colon cancer patients. Value Health 19, 82–87. [DOI] [PubMed] [Google Scholar]
- Bufill JA (1990) Colorectal cancer: evidence for distinct genetic categories based on proximal or distal tumor location. Ann Intern Med 113, 779–788. [DOI] [PubMed] [Google Scholar]
- Bunger R and Mallet RT (2016) Metabolomics and receiver operating characteristic analysis: a promising approach for sepsis diagnosis. Crit Care Med 44, 1784–1785. [DOI] [PMC free article] [PubMed] [Google Scholar]
- Carethers JM and Jung BH (2015) Genetics and genetic biomarkers in sporadic colorectal cancer. Gastroenterology 149, 1177–1190.e1173 [DOI] [PMC free article] [PubMed] [Google Scholar]
- Cha ST, Tan CT, Chang CC, Chu CY, Lee WJ, Lin BZ, Lin MT and Kuo ML (2016) G9a/RelB regulates self‐renewal and function of colon‐cancer‐initiating cells by silencing Let‐7b and activating the K‐RAS/beta‐catenin pathway. Nat Cell Biol 18, 993–1005. [DOI] [PubMed] [Google Scholar]
- Chau I, Norman AR, Cunningham D, Waters JS, Oates J and Ross PJ (2004) Multivariate prognostic factor analysis in locally advanced and metastatic esophago‐gastric cancer – pooled analysis from three multicenter, randomized, controlled trials using individual patient data. J Clin Oncol 22, 2395–2403. [DOI] [PubMed] [Google Scholar]
- Clark‐Langone KM, Sangli C, Krishnakumar J and Watson D (2010) Translating tumor biology into personalized treatment planning: analytical performance characteristics of the Oncotype DX Colon Cancer Assay. BMC Cancer 10, 691. [DOI] [PMC free article] [PubMed] [Google Scholar]
- Courel M, El Yamani FZ, Alexandre D, El Fatemi H, Delestre C, Montero‐Hadjadje M, Tazi F, Amarti A, Magoul R, Chartrel N et al (2014) Secretogranin II is overexpressed in advanced prostate cancer and promotes the neuroendocrine differentiation of prostate cancer cells. Eur J Cancer 50, 3039–3049. [DOI] [PubMed] [Google Scholar]
- Cristescu R, Lee J, Nebozhyn M, Kim KM, Ting JC, Wong SS, Liu J, Yue YG, Wang J, Yu K et al (2015) Molecular analysis of gastric cancer identifies subtypes associated with distinct clinical outcomes. Nat Med 21, 449–456. [DOI] [PubMed] [Google Scholar]
- De Sousa EMF, Wang X, Jansen M, Fessler E, Trinh A, de Rooij LP, de Jong JH, de Boer OJ, van Leersum R, Bijlsma MF et al (2013) Poor‐prognosis colon cancer is defined by a molecularly distinct subtype and develops from serrated precursor lesions. Nat Med 19, 614–618. [DOI] [PubMed] [Google Scholar]
- Di Franco S, Todaro M, Dieli F and Stassi G (2014) Colorectal cancer defeating? Challenge accepted!. Mol Aspects Med 39, 61–81. [DOI] [PubMed] [Google Scholar]
- Dienstmann R, Salazar R and Tabernero J (2015) Overcoming resistance to anti‐EGFR therapy in colorectal cancer. Am Soc Clin Oncol Educ Book e149–e156 American Society of Clinical Oncology. Meeting. [DOI] [PubMed] [Google Scholar]
- Ferlay J, Soerjomataram I, Dikshit R, Eser S, Mathers C, Rebelo M, Parkin DM, Forman D and Bray F (2015) Cancer incidence and mortality worldwide: sources, methods and major patterns in GLOBOCAN 2012. Int J Cancer 136, E359–E386. [DOI] [PubMed] [Google Scholar]
- Figueredo A, Coombes ME, Mukherjee S (2008) Adjuvant therapy for completely resected stage II colon cancer. Cochrane Database Syst Rev (3), CD005390. [DOI] [PMC free article] [PubMed] [Google Scholar]
- Glas AM, Floore A, Delahaye LJ, Witteveen AT, Pover RC, Bakx N, Lahti‐Domenici JS, Bruinsma TJ, Warmoes MO, Bernards R et al (2006) Converting a breast cancer microarray signature into a high‐throughput diagnostic test. BMC Genom 7, 278. [DOI] [PMC free article] [PubMed] [Google Scholar]
- Goeman JJ (2010) L1 penalized estimation in the Cox proportional hazards model. Biom J 52, 70–84. [DOI] [PubMed] [Google Scholar]
- Gui J and Li H (2005) Penalized Cox regression analysis in the high‐dimensional and low‐sample size settings, with applications to microarray gene expression data. Bioinformatics 21, 3001–3008. [DOI] [PubMed] [Google Scholar]
- Halle C, Andersen E, Lando M, Aarnes EK, Hasvold G, Holden M, Syljuasen RG, Sundfor K, Kristensen GB, Holm R et al (2012) Hypoxia‐induced gene expression in chemoradioresistant cervical cancer revealed by dynamic contrast‐enhanced MRI. Cancer Res 72, 5285–5295. [DOI] [PubMed] [Google Scholar]
- Hanzelmann S, Castelo R and Guinney J (2013) GSVA: gene set variation analysis for microarray and RNA‐seq data. BMC Bioinformatics 14, 7. [DOI] [PMC free article] [PubMed] [Google Scholar]
- Hirunsatit R, George ED, Lipska BK, Elwafi HM, Sander L, Yrigollen CM, Gelernter J, Grigorenko EL, Lappalainen J, Mane S et al (2009) Twenty‐one‐base‐pair insertion polymorphism creates an enhancer element and potentiates SLC6A1 GABA transporter promoter activity. Pharmacogenet Genomics 19, 53–65. [DOI] [PMC free article] [PubMed] [Google Scholar]
- Hoogwater FJ, Nijkamp MW, Smakman N, Steller EJ, Emmink BL, Westendorp BF, Raats DA, Sprick MR, Schaefer U, Van Houdt WJ et al (2010) Oncogenic K‐Ras turns death receptors into metastasis‐promoting receptors in human and mouse colorectal cancer cells. Gastroenterology 138, 2357–2367. [DOI] [PubMed] [Google Scholar]
- Irizarry RA, Hobbs B, Collin F, Beazer‐Barclay YD, Antonellis KJ, Scherf U and Speed TP (2003) Exploration, normalization, and summaries of high density oligonucleotide array probe level data. Biostatistics 4, 249–264. [DOI] [PubMed] [Google Scholar]
- Ishikawa N, Daigo Y, Takano A, Taniwaki M, Kato T, Tanaka S, Yasui W, Takeshima Y, Inai K, Nishimura H et al (2006) Characterization of SEZ6L2 cell‐surface protein as a novel prognostic marker for lung cancer. Cancer Sci 97, 737–745. [DOI] [PMC free article] [PubMed] [Google Scholar]
- Jensen NF, Stenvang J, Beck MK, Hanakova B, Belling KC, Do KN, Viuff B, Nygard SB, Gupta R, Rasmussen MH et al (2015) Establishment and characterization of models of chemotherapy resistance in colorectal cancer: towards a predictive signature of chemoresistance. Mol Oncol 9, 1169–1185. [DOI] [PMC free article] [PubMed] [Google Scholar]
- Jeong SY, Ha J, Lee M, Jin HJ, Kim DH, Choi SJ, Oh W, Yang YS, Kim JS, Kim BG et al (2015) Autocrine action of thrombospondin‐2 determines the chondrogenic differentiation potential and suppresses hypertrophic maturation of human umbilical cord blood‐derived mesenchymal stem cells. Stem Cells 33, 3291–3303. [DOI] [PubMed] [Google Scholar]
- Jorissen RN, Gibbs P, Christie M, Prakash S, Lipton L, Desai J, Kerr D, Aaltonen LA, Arango D, Kruhoffer M et al (2009) Metastasis‐associated gene expression changes predict poor outcomes in patients with Dukes Stage B and C colorectal cancer. Clin Cancer Res 15, 7642–7651. [DOI] [PMC free article] [PubMed] [Google Scholar]
- Kang J, D'Andrea AD and Kozono D (2012) A DNA repair pathway‐focused score for prediction of outcomes in ovarian cancer treated with platinum‐based chemotherapy. J Natl Cancer Inst 104, 670–681. [DOI] [PMC free article] [PubMed] [Google Scholar]
- Kawaguchi T, Komatsu S, Ichikawa D, Kubota T, Okamoto K, Shiozaki A, Fujiwara H, Konishi H, Morimura R, Murayama Y et al (2013) Comparison of prognostic compatibility between seventh AJCC/TNM of the esophagus and 14th JCGC staging systems in Siewert type II adenocarcinoma. Anticancer Res 33, 3461–3465. [PubMed] [Google Scholar]
- Kemper K, Versloot M, Cameron K, Colak S, de Sousa e Melo F, de Jong JH, Bleackley J, Vermeulen L, Versteeg R, Koster J et al (2012) Mutations in the Ras‐Raf Axis underlie the prognostic value of CD133 in colorectal cancer. Clin Cancer Res 18, 3132–3141. [DOI] [PubMed] [Google Scholar]
- Keskin M, Muratoglu Sahin N, Kurnaz E, Bayramoglu E, Savas Erdeve S, Aycan Z and Cetinkaya S (2017) A rare cause of short stature: 3M Syndrome in a patient with novel mutation in OBSL1 gene. J Clin Res Pediatr Endocrinol 9, 91–94. [DOI] [PMC free article] [PubMed] [Google Scholar]
- Khan AO, Aldahmesh MA and Alkuraya FS (2016) Clinical characterization of LRPAP1‐related pediatric high myopia. Ophthalmology 123, 434–435. [DOI] [PubMed] [Google Scholar]
- Koc EC, Burkhart W, Blackburn K, Moyer MB, Schlatzer DM, Moseley A and Spremulli LL (2001) The large subunit of the mammalian mitochondrial ribosome. Analysis of the complement of ribosomal proteins present. J Biol Chem 276, 43958–43969. [DOI] [PubMed] [Google Scholar]
- Lee MS, Menter DG and Kopetz S (2017) Right versus left colon cancer biology: integrating the consensus molecular subtypes. J Natl Compr Canc Netw 15, 411–419. [DOI] [PubMed] [Google Scholar]
- Li H, Wang X, Fang Y, Huo Z, Lu X, Zhan X, Deng X, Peng C and Shen B (2017) Integrated expression profiles analysis reveals novel predictive biomarker in pancreatic ductal adenocarcinoma. Oncotarget, https://doi.org/10.18632/oncotarget.16732. [DOI] [PMC free article] [PubMed] [Google Scholar]
- Lichtenstein P, Holm NV, Verkasalo PK, Iliadou A, Kaprio J, Koskenvuo M, Pukkala E, Skytthe A and Hemminki K (2000) Environmental and heritable factors in the causation of cancer–analyses of cohorts of twins from Sweden, Denmark, and Finland. N Engl J Med 343, 78–85. [DOI] [PubMed] [Google Scholar]
- Luo X, Li Z, Li X, Wang G, Liu W, Dong S, Cai S, Tao D, Yan Q, Wang J et al (2011) hSav1 interacts with HAX1 and attenuates its anti‐apoptotic effects in MCF‐7 breast cancer cells. Int J Mol Med 28, 349–355. [DOI] [PubMed] [Google Scholar]
- Malumbres M and Barbacid M (2003) RAS oncogenes: the first 30 years. Nat Rev Cancer 3, 459–465. [DOI] [PubMed] [Google Scholar]
- Marrelli D, Morgagni P, de Manzoni G, Coniglio A, Marchet A, Saragoni L, Tiberio G, Roviello F, Italian Research Group for Gastric Cancer (IRGGC) (2012) Prognostic value of the 7th AJCC/UICC TNM classification of noncardia gastric cancer: analysis of a large series from specialized Western centers. Ann Surg 255, 486–491. [DOI] [PubMed] [Google Scholar]
- Marshall CR, Farrell SA, Cushing D, Paton T, Stockley TL, Stavropoulos DJ, Ray PN, Szego M, Lau L, Pereira SL et al (2015) Whole‐exome analysis of foetal autopsy tissue reveals a frameshift mutation in OBSL1, consistent with a diagnosis of 3‐M Syndrome. BMC Genom 16(Suppl 1), S12. [DOI] [PMC free article] [PubMed] [Google Scholar]
- Mendola A, Schlogel MJ, Ghalamkarpour A, Irrthum A, Nguyen HL, Fastre E, Bygum A, van der Vleuten C, Fagerberg C, Baselga E et al (2013) Mutations in the VEGFR3 signaling pathway explain 36% of familial lymphedema. Mol Syndromol 4, 257–266. [DOI] [PMC free article] [PubMed] [Google Scholar]
- NIH Consensus Conference (1990) Adjuvant therapy for patients with colon and rectal cancer. JAMA 264, 1444–1450. [PubMed] [Google Scholar]
- O'Connell MJ, Lavery I, Yothers G, Paik S, Clark‐Langone KM, Lopatin M, Watson D, Baehner FL, Shak S, Baker J et al (2010) Relationship between tumor gene expression and recurrence in four independent studies of patients with stage II/III colon cancer treated with surgery alone or surgery plus adjuvant fluorouracil plus leucovorin. J Clin Oncol 28, 3937–3944. [DOI] [PMC free article] [PubMed] [Google Scholar]
- O'Connell JB, Maggard MA, Ko CY (2004) Colon cancer survival rates with the new American Joint Committee on Cancer sixth edition staging. J Natl Cancer Inst 96, 1420–1425. [DOI] [PubMed] [Google Scholar]
- Oh SC, Park YY, Park ES, Lim JY, Kim SM, Kim SB, Kim J, Kim SC, Chu IS, Smith JJ et al (2012) Prognostic gene expression signature associated with two molecularly distinct subtypes of colorectal cancer. Gut 61, 1291–1298. [DOI] [PMC free article] [PubMed] [Google Scholar]
- Pencina MJ and D'Agostino RB (2004) Overall C as a measure of discrimination in survival analysis: model specific population value and confidence interval estimation. Stat Med 23, 2109–2123. [DOI] [PubMed] [Google Scholar]
- Pino MS and Chung DC (2010) The chromosomal instability pathway in colon cancer. Gastroenterology 138, 2059–2072. [DOI] [PMC free article] [PubMed] [Google Scholar]
- Ratkin GA (1997) Adjuvant therapy for colon and rectal cancer. Am Fam Physician 55, 2487–2492, 2495–2496. [PubMed] [Google Scholar]
- Schell MJ, Yang M, Missiaglia E, Delorenzi M, Soneson C, Yue B, Nebozhyn MV, Loboda A, Bloom G and Yeatman TJ (2016) A composite gene expression signature optimizes prediction of colorectal cancer metastasis and outcome. Clin Cancer Res 22, 734–745. [DOI] [PMC free article] [PubMed] [Google Scholar]
- Simon R and Altman DG (1994) Statistical aspects of prognostic factor studies in oncology. Br J Cancer 69, 979–985. [DOI] [PMC free article] [PubMed] [Google Scholar]
- Singh NK, Banerjee BD, Bala K, Mitrabasu, Dung Dung AA and Chhillar N (2014) APOE and LRPAP1 gene polymorphism and risk of Parkinson's disease. Neurol Sci 35, 1075–1081. [DOI] [PubMed] [Google Scholar]
- Smith JJ, Deane NG, Wu F, Merchant NB, Zhang B, Jiang A, Lu P, Johnson JC, Schmidt C, Bailey CE et al (2010) Experimentally derived metastasis gene expression profile predicts recurrence and death in patients with colon cancer. Gastroenterology 138, 958–968. [DOI] [PMC free article] [PubMed] [Google Scholar]
- Sparks AB, Morin PJ, Vogelstein B and Kinzler KW (1998) Mutational analysis of the APC/beta‐catenin/Tcf pathway in colorectal cancer. Cancer Res 58, 1130–1134. [PubMed] [Google Scholar]
- Srivastava G, Renfro LA, Behrens RJ, Lopatin M, Chao C, Soori GS, Dakhil SR, Mowat RB, Kuebler JP, Kim G et al (2014) Prospective multicenter study of the impact of oncotype DX colon cancer assay results on treatment recommendations in stage II colon cancer patients. Oncologist 19, 492–497. [DOI] [PMC free article] [PubMed] [Google Scholar]
- van der Stok EP, Smid M, Sieuwerts AM, Vermeulen PB, Sleijfer S, Ayez N, Grunhagen DJ, Martens JW and Verhoef C (2016) mRNA expression profiles of colorectal liver metastases as a novel biomarker for early recurrence after partial hepatectomy. Mol Oncol 10, 1542–1550. [DOI] [PMC free article] [PubMed] [Google Scholar]
- Subramanian A, Tamayo P, Mootha VK, Mukherjee S, Ebert BL, Gillette MA, Paulovich A, Pomeroy SL, Golub TR, Lander ES et al (2005) Gene set enrichment analysis: a knowledge‐based approach for interpreting genome‐wide expression profiles. Proc Natl Acad Sci U S A 102, 15545–15550. [DOI] [PMC free article] [PubMed] [Google Scholar]
- Sun R, Wu J, Chen Y, Lu M, Zhang S, Lu D and Li Y (2014) Down regulation of Thrombospondin2 predicts poor prognosis in patients with gastric cancer. Mol Cancer 13, 225. [DOI] [PMC free article] [PubMed] [Google Scholar]
- Tibshirani R (1997) The lasso method for variable selection in the Cox model. Stat Med 16, 385–395. [DOI] [PubMed] [Google Scholar]
- Totta P, Gionfra F, Busonero C and Acconcia F (2016) Modulation of 17beta‐estradiol signaling on cellular proliferation by Caveolin‐2. J Cell Physiol 231, 1219–1225. [DOI] [PubMed] [Google Scholar]
- Van Cutsem E, Kohne CH, Lang I, Folprecht G, Nowacki MP, Cascinu S, Shchepotin I, Maurel J, Cunningham D , Tejpar S et al (2011) Cetuximab plus irinotecan, fluorouracil, and leucovorin as first‐line treatment for metastatic colorectal cancer: updated analysis of overall survival according to tumor KRAS and BRAF mutation status. J Clin Oncol 29, 2011–2019. [DOI] [PubMed] [Google Scholar]
- van ‘t Veer LJ, Dai H, van de Vijver MJ, He YD, Hart AA, Mao M, Peterse HL, van der Kooy K, Marton MJ, Witteveen AT et al (2002) Gene expression profiling predicts clinical outcome of breast cancer. Nature 415, 530–536. [DOI] [PubMed] [Google Scholar]
- Wang Y, Li J, Xia Y, Gong R, Wang K, Yan Z, Wan X, Liu G, Wu D, Shi L et al (2013) Prognostic nomogram for intrahepatic cholangiocarcinoma after partial hepatectomy. J Clin Oncol 31, 1188–1195. [DOI] [PubMed] [Google Scholar]
- Wang X, Zhang L, Li H, Sun W, Zhang H and Lai M (2016) THBS2 is a potential prognostic biomarker in colorectal cancer. Sci Rep 6, 33366. [DOI] [PMC free article] [PubMed] [Google Scholar]
- Webber EM, Lin JS and Evelyn PW (2010) Oncotype DX tumor gene expression profiling in stage II colon cancer. Application: prognostic, risk prediction. PLoS Curr 2, pii: RRN1177. [DOI] [PMC free article] [PubMed] [Google Scholar]
- Wicki A, Mandala M, Massi D, Taverna D, Tang H, Hemmings BA and Xue G (2016) Acquired resistance to clinical cancer therapy: a twist in physiological signaling. Physiol Rev 96, 805–829. [DOI] [PubMed] [Google Scholar]
- Yi JM, Dhir M, Van Neste L, Downing SR, Jeschke J, Glockner SC, de Freitas Calmon M, Hooker CM, Funes JM, Boshoff C et al (2011) Genomic and epigenomic integration identifies a prognostic signature in colon cancer. Clin Cancer Res 17, 1535–1545. [DOI] [PMC free article] [PubMed] [Google Scholar]
- Yothers G, O'Connell MJ, Lee M, Lopatin M, Clark‐Langone KM, Millward C, Paik S, Sharif S, Shak S and Wolmark N (2013) Validation of the 12‐gene colon cancer recurrence score in NSABP C‐07 as a predictor of recurrence in patients with stage II and III colon cancer treated with fluorouracil and leucovorin (FU/LV) and FU/LV plus oxaliplatin. J Clin Oncol 31, 4512–4519. [DOI] [PMC free article] [PubMed] [Google Scholar]
- You YN, Rustin RB and Sullivan JD (2015) Oncotype DX((R)) colon cancer assay for prediction of recurrence risk in patients with stage II and III colon cancer: a review of the evidence. Surg Oncol 24, 61–66. [DOI] [PubMed] [Google Scholar]
- Zhang JX, Song W, Chen ZH, Wei JH, Liao YJ, Lei J, Hu M, Chen GZ, Liao B, Lu J et al (2013) Prognostic and predictive value of a microRNA signature in stage II colon cancer: a microRNA expression analysis. Lancet Oncol 14, 1295–1306. [DOI] [PubMed] [Google Scholar]
Associated Data
This section collects any data citations, data availability statements, or supplementary materials included in this article.
Supplementary Materials
Fig. S1. Schematic diagram of work flow.
Fig. S2. Cross‐validation for tuning parameter selection in the LASSO model.
Fig. S3. 13‐mRNA risk score analysis of GSE17536.
Fig. S4. Kaplan–Meier survival analysis to evaluate the independence of the 13‐mRNA signature from tumor location.
Fig. S5. Forest plot summary of the analyses of prognostic classifiers in colorectal cancer (CRC).
Fig. S6. Receiver operating characteristic (ROC) analysis of the sensitivity and specificity of the recurrence prediction by the 13‐mRNA risk score, AJCC stage, prognostic indexes of oncotypeDX and ColoGuideEx in stage II and III patients of GSE17536 (n = 145).
Table S1. The raw clinic information data for the three datasets.
Table S2. Basic characteristics of patients in three datasets.
Table S3. Extra information on the three datasets.
Table S4. mRNA significantly associated with the recurrence‐free survival in the test series patients (n = 145).
Table S5. Calculation of prognostic indexes.
Table S6. Correlation analyses between risk score and associated pathways.
Data Availability Statement
Research data pertaining to this article is located at figshare.com: https://doi.org/10.6084/m9.figshare.5311105