Abstract

Saposin B (SapB) is a human lysosomal protein, critical for the degradation of O-sulfogalactosylceramide (sulfatide). SapB binds sulfatide and presents it to the active site of the enzyme arylsulfatase A. Deficiency of SapB leads to fatal activator-deficient metachromatic leukodystrophy. Given the conformational flexibility and the large hydrophobic “pocket” produced upon (physiologically relevant) homodimerization, SapB may have broader substrate diversity than originally thought. Herein, we present evidence using fluorescence spectroscopy and computational docking studies that SapB binds a wide variety of ligands at KD values varying from micromolar to nanomolar, with entropy being the primary driving force. We further demonstrate, for the first time, that SapB has two binding sites that can sequentially (and in a preferred order) accommodate up to two ligands at once.
1. Introduction
Saposin B (SapB) is an intralysosomal, heat-stable human glycoprotein that functions as a nonenzymatic cofactor in the degradation of O-sulfogalactosylceramide (sulfatide) by presenting the lipid to the active site of the enzyme arylsulfatase A (ASA).1,2 SapB was the first of four saposins to be discovered and is a product of the post-translational cleavage of prosaposin, along with SapA, SapC, and SapD.1 All four saposins are nonenzymatic.1,2 SapB has been extensively investigated due to its role in the lethal lysosomal storage disease activator-deficient metachromatic leukodystrophy (AD-MLD), the result of a buildup of sulfatides in the lysosome.1,3 SapB favors a dimeric structure, has a variable degree of α-helical character across pH ranges (∼53% at ∼lysosomal pH pf 5; ∼68% at pH 7.0), three disulfide bonds, and a hydrophobic binding pocket, consistent with its role in lipid binding.1,2,4,5
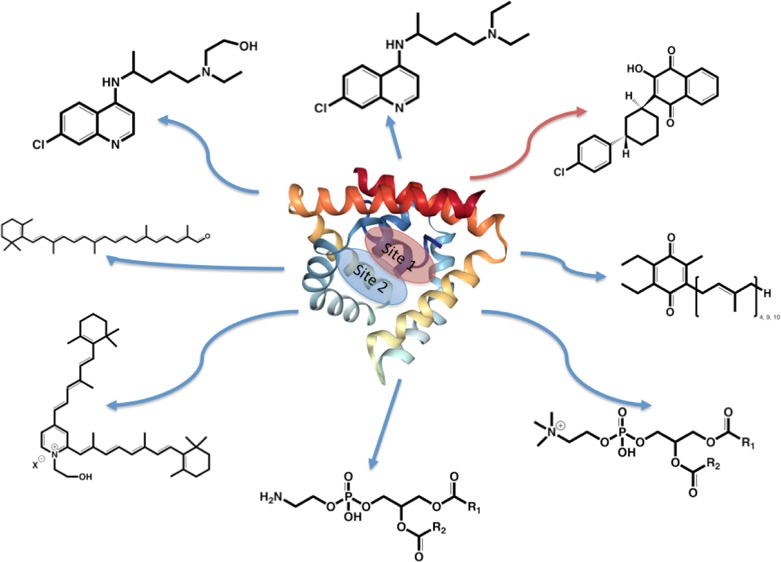
Previous work has almost exclusively focused on SapB interaction with lipids, lipidlike molecules, and ASA. Recently, our group and others have shown that SapB can bind ligands beyond sulfatide. It has been shown that SapB binds coenzyme Q10 (CoQ10) and serves as a binding and transfer protein for the coenzyme, with [SapB-CoQ10]complex being detected in human urine.6,7 It has also been shown that SapB binds the lysosomotropic antimalarial drugs atovaquone6 (ATO) and chloroquine5 (CQ), as well as the bisretinoid N-retinylidene-N-retinylethanolamine8 (A2E), which accumulates in the lysosome of patients with macular degeneration.9−11
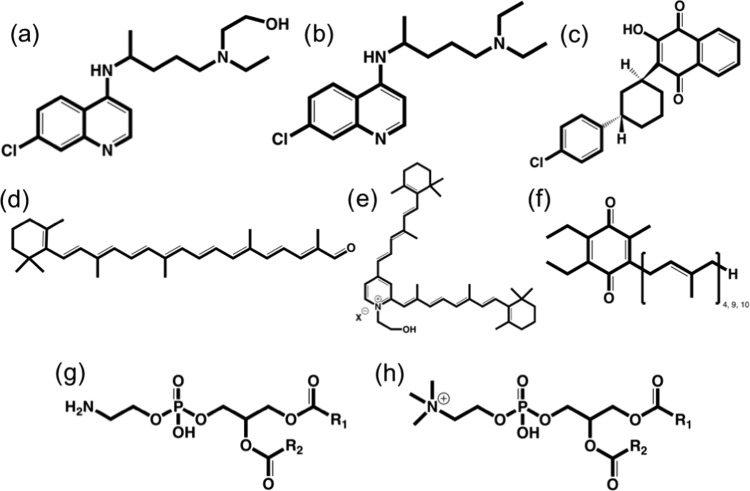
The critical importance of SapB as a lysosomal activator and transporter protein and its multiligand binding characteristics beyond sulfatide degradation raise important questions about the driving forces and factors that influence such a wide range of ligand interactions. Herein, we present evidence using fluorescence spectroscopy and computational docking studies, supported by our prior work using isothermal titration calorimetry (ITC)5,6 and protein crystallography,5 that SapB binds a wide variety of ligands with KD values ranging from micromolar to nanomolar (see Scheme 1 and Figure 1). Furthermore, we demonstrate that a ligand’s calculated partition coefficient (c Log P) can be used to predict binding affinity with SapB and that SapB-ligand binding is driven principally by entropic factors. We hypothesize that deviation from this general binding model, as in the case of the [SapB-ATO]complex, is likely due to the presence of a second and strong binding site for ATO (and perhaps for other ligands as well) on the surface of the protein. Such superficial binding is shown to block access of other ligands to the deeper binding pocket inside SapB.
Scheme 1. Structures of Some SapB Binding Ligands.
(a) Hydroxychloroquine (HCQ), (b) CQ, (c) ATO, (d) apocarotenal (ACar), (e) A2E, (f) coenzyme Q4, Q9 (CoQ4, CoQ9), or CoQ10, (g) phosphatidylethanolamine (PEth), and (h) phosphatidylcholine (PCho).
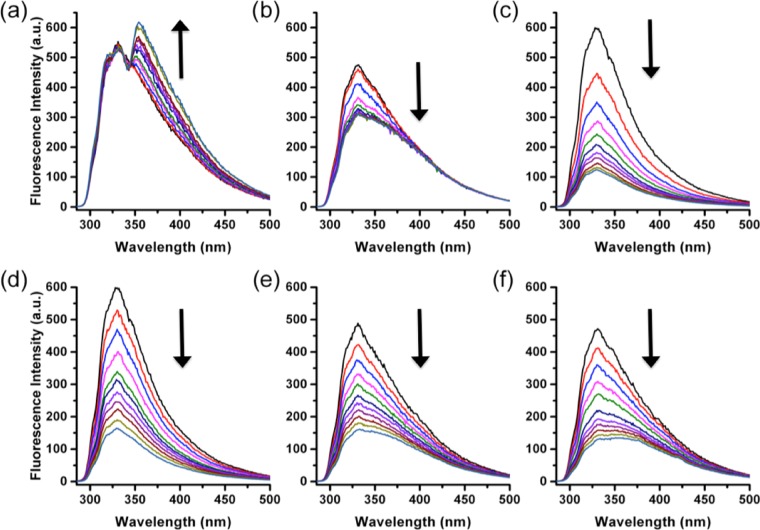
Figure 1.
Spectrophotometric titrations of SapB with different ligands. (a) HCQ, (b) ACar, (c) PEth, (d) PCho, (e) CoQ4, (f) CoQ9. Conditions: 40 μM SapB in 50 mM phosphate buffer, pH 5.5 with 2 μL injections of 2 mM ligand (only HCQ was dissolved in 50 mM phosphate buffer, pH 5.5; all other ligands were prepared in 100% dimethylformamide (DMF)), conducted at room temperature. Because of HCQ’s own fluorescence emission of around 360 nm, minimal fluorescence quenching was observed upon HCQ binding to SapB. The data was analyzed using the double logarithmic Stern–Volmer equation, as previously described.5,8 SapB was prepared and structurally validated, as previously described.12
2. Results and Discussion
The interaction of SapB, prepared as previously described,12 with a variety of ligands was followed by monitoring the quenching of the fluorescence intensities of the protein’s tyrosine residues8 upon binding (Figure 1a–f). An excitation wavelength of 278 nm was used and the fluorescence emission was monitored between 285 and 500 nm.
For each ligand tested, the quenching of the protein’s fluorescence intensity was monitored at the maximum emission wavelength of 330 nm (see Figure 1) and the data was analyzed using double logarithmic Stern–Volmer plots5,8,13 (Supporting eq 1 and Supporting Figure 1a–f). The log of the binding affinity (KA) for each ligand is reported in Table 1 and shows a general increase in the KA value as the ligand hydrophobicity increases, consistent with the known primary function of SapB as a binder and extractor of lipids within the lysosome. Interestingly, a plot of Log KA versus c Log P (Figure 2) shows a strong correlation (i.e., R2 > 0.9) and a clear linear trend of all ligands tested with the exception of [SapB-ATO]complex, suggesting that [SapB-Ligand]complex formation is primarily driven by entropy. To support this idea, we measured the thermodynamic binding parameters ΔS° and ΔH° for six of the bound substrates shown in Scheme 1 (see Table 2). As can be observed, with the exception of ATO, the binding interactions are both enthalpically and entropically favored, although the entropic contributions are much more pronounced (i.e., −20.6 kJ mol–1 < −TΔS < −47.9 kJ mol–1 vs −1.8 kJ mol–1 < ΔH < −8.6 kJ mol–1) than their enthalpic counterparts. Notably, the strongest entropy of binding observed for ATO, postulated to bind at an alternate “second” binding site, offers further insights into the deviation from the Log KA versus c Log P plot linearity, as mentioned earlier (see Figure 2).
Table 1. Log KA for the Binding of Several Ligands by SapB and the Log of the Calculated Partition Coefficient (c Log P).
| ligand | Log KA | c Log Pa |
|---|---|---|
| hydroxychloroquine | 3.809 | 3.90 |
| chloroquine | 4.620 | 4.70 |
| atovaquone | 6.950 | 5.80 |
| A2E | 4.680 | 8.20 |
| coenzyme Q4 | 5.103 | 8.72 |
| apocarotenal | 4.618 | 9.40 |
| phosphatidylethanolamine | 5.227 | 10.4 |
| phosphatidylcholine | 6.075 | 12.9 |
| coenzyme Q9 | 6.196 | 15.5 |
| coenzyme Q10 | 7.382 | 21.0 |
Figure 2.

Plot of Log KA against ligands’ calculated c Log P for several ligands binding to SapB at pH 5.5. Each fluorescence quenching experiment was performed in triplicate with each point on the plot representing the average of three runs. The data was fitted using a linear least squares regression, excluding the data point for ATO. The slope and intercept of the best-fit line (R2 = 0.934) are 0.191 and 3.28, with standard errors of 0.017 and 0.190, respectively. The shaded area denotes the upper and lower 95% confidence intervals.
Table 2. Thermodynamic Parameters for the Binding of Several Ligands by SapB (See Also Supporting Figure 3).
| ligand | ΔS° (J mol–1 K–1) | ΔH° (kJ mol–1) | ΔG° (kJ mol–1) |
|---|---|---|---|
| ATO | 161.01 ± 4.07 | 8.32 ± 1.24 | –39.68 ± 1.74 |
| CQ | 69.27 ± 5.15 | –5.68 ± 1.58 | –26.34 ± 2.20 |
| CoQ4 | 112.39 ±4.07 | –8.57 ± 1.25 | –42.08 ± 1.74 |
| PEth | 95.73 ± 4.65 | –6.06 ± 1.41 | –34.61 ± 1.89 |
| PCho | 91.32 ± 1.16 | –1.87 ± 0.33 | –29.10 ± 0.48 |
| CoQ10 | 95.90 ± 0.66 | –1.76 ± 0.17 | –30.36 ±0.26 |
The previously published crystal structures of SapB4 and [SapB-CQ]complex5 show a v-shaped, hydrophobic pocket for SapB suitable for lipid and/or small molecules binding. However, NMR solution structure studies19 of SapB have proven challenging, with molecular dynamics modeling revealing20 an inherently flexible SapB dimer, with at least three separate conformations postulated. Additional work has shown that this dimeric flexibility might play a role in overall SapB function because mutants with more rigidity have led to a decline in function.4 This suggests that a mechanism underlying the broad binding specificity of SapB reported herein, and its ability to bind a variety of hydrophobic molecules, is likely due to the inherent conformational flexibility of the protein.19,20
To probe the adaptability of the pocket and its ability to accept multiple ligands, we conducted “order of addition” fluorescence binding experiments using preformed [SapB-Ligand]complexes, followed by direct titrations of a second ligand (ligand = ATO or A2E; see Scheme 1c, 1e, respectively). Titration of A2E into a preformed solution of [SapB-ATO]complex resulted in no A2E binding compared to SapB binding of A2E alone, as a control (Supporting Figure 4, green and black curves, respectively). This lack of A2E binding indicates a blocking effect for ATO consistent with the computational docking studies21−23 shown in Figure 3a, suggesting that ATO is more surface bound than “buried” inside the SapB hydrophobic pocket. However, titration of ATO into a preformed [SapB-A2E]complex solution resulted in a clear binding of ATO to SapB (see Supporting Figure 5). The inability of the SapB dimer to accommodate two ATO molecules at the same time is due to the surface-bound nature of the ATO molecule and the subsequent asymmetric structure of the SapB dimer (Figure 3a). These observations are in agreement with a recent ITC study suggesting one ATO molecule binds per SapB dimer.6 On the contrary, SapB dimer is able to initially bind one A2E molecule followed by another molecule of ATO (Figure 3b and Supporting Figure 5) presumably because A2E binds into a deeper pocket buried inside the hydrophobic cavity of the SapB dimer.
Figure 3.

(a) Computational models of (a) [SapB-ATO]complex and (b) [SapB-ATO-A2E]complex.
3. Conclusions
In conclusion, we demonstrate that (a) SapB binds a broad range of ligands, (b) such binding is primarily driven by entropic forces, and (c) can be predicted from the log KA versus ligand’s c Log P plot, and (d) that SapB can accommodate certain ligands in a specific and sequential order. Such a preferred order of binding is likely due to the large hydrophobic pocket produced upon the homodimerization and conformational flexibility of SapB as previously described.20
4. Experimental Section
4.1. Materials and Methods
Saposin B (SapB) was prepared and purified according to literature reports.12 All SapB solutions in this study were prepared in 50 mM phosphate buffer, pH 5.5. Protein concentration was determined spectrophotometrically using a molar absorptivity value of 2950 M–1 cm–1 at 280 nm. Ligand solutions were prepared in 100% dimethylformamide (DMF) to a concentration of 2 mM, with the exception of hydoxychloroquine (HCQ), which was prepared in 50 mM phosphate buffer, pH 5.5. The concentrations of all the ligands were determined via ultraviolet–visible spectroscopy using molar absorptivity values of: 36 900 M–1 cm–1 at 440 nm for A2E; 7500 M–1 cm–1 at 331 nm for CQ; 226.9 M–1 cm–1 at 329 for HCQ; 27 300 M–1 cm–1 at 253 nm for ATO; 22 540 M–1 cm–1 at 279 nm for PEth; 27 500 M–1 cm–1 at 280 nm for PCho; 4150 M–1 cm–1 at 283 for CoQ4; and 3750 M–1 cm–1 at 282 nm for CoQ9.
4.2. Fluorescence Spectroscopy
Fluorescence quenching measurements were performed on a Varian Cary Eclipse fluorimeter equipped with a QNW Peltier temperature controller. The binding experiments were conducted at 25.00 ± 0.01 °C in 50 mM phosphate buffer, pH 5.5, using 278 nm excitation wavelength for SapB emission spectra at 330 nm (Figure 1a–f) with excitation and emission monochromators bandwidth of 5 nm each. Temperature sensitive binding experiments were performed between 20.00 ± 0.01 and 40.00 ± 0.01 °C using 278 nm excitation wavelength for SapB emission spectra at 331 nm, with excitation and emission monochromators bandwidth of 5 nm each. The fluorescence quenching data were analyzed using OriginLab software version 8.
4.3. Docking Studies
Studies were performed with SwissDock using the structure of SapB-CQ (PDB 4V2O) as a model. The orientation of the ATO ligand was checked manually using Coot and optimized for putative hydrogen bonding interactions.21−23
Acknowledgments
This work is supported by funding from New York State through the Center for Advanced Systems and Engineering, a NYSTAR-designated center at Syracuse University, Ichor Therapeutics (Lafayette, NY) (R.P.D.), in-part by the Cottrell College Science Award (ID # 7892) from Research Corporation, and the National Institute of General Medical Sciences of the National Institutes of Health Award R15GM104879 (F.B.-A.) and an ATIP-Avenir grant (C.Z.).
Supporting Information Available
The Supporting Information is available free of charge on the ACS Publications website at DOI: 10.1021/acsomega.7b01334.
Detailed experimental descriptions, van’t Hoff plots, Stern–Volmer plots, spectrophotometric titration plots (PDF)
The authors declare the following competing financial interest(s): R.P.D. sits on the scientific advisory of Ichor Therapeutics (Lafayette, NY).
Supplementary Material
References
- Kishimoto Y.; Hiraiwa M.; O’Brien J. S. J. Lipid Res. 1992, 33, 1255. [PubMed] [Google Scholar]
- Louis A. I.; Fluharty A. L. Dev. Neurosci. 1991, 13, 41. 10.1159/000112139. [DOI] [PubMed] [Google Scholar]
- Kiser P. D.; Palczewski K. Annu. Rev. Visual Sci. 2016, 2, 197. 10.1146/annurev-vision-111815-114407. [DOI] [PMC free article] [PubMed] [Google Scholar]
- Ahn V. E.; Faull K. F.; Whitelegge J. P.; Fluharty A. L.; Privé G. G. Proc. Natl. Acad. Sci. U.S.A. 2003, 100, 38. 10.1073/pnas.0136947100. [DOI] [PMC free article] [PubMed] [Google Scholar]
- Huta B. P.; Mehlenbacher M. R.; Nie Y.; Lai X.; Zubieta C.; Bou-Abdallah F.; Doyle R. P. ChemMedChem 2016, 11, 277. 10.1002/cmdc.201500494. [DOI] [PMC free article] [PubMed] [Google Scholar]
- Huta B. P.; Roberts A. M.; Waters E. S.; Yu V. Y.; Doyle R. P.; Mehlenbacher M. R.; Bou-Abdallah F. Med. Chem. Commun. 2014, 5, 787. 10.1039/C3MD00373F. [DOI] [Google Scholar]
- Jin G.; Kubo H.; Kashiba M.; Horinouchi R.; Hasegawa M.; Suzuki M.; Sagawa T.; Oizumi M.; Fujisawa A.; Tsukamoto H.; Yoshimura S.; Yamamoto Y. J. Clin. Biochem. Nutr. 2008, 42, 167. 10.3164/jcbn.2008024. [DOI] [PMC free article] [PubMed] [Google Scholar]
- Tinklepaugh J.; Smith B. M.; Nie Y.; Moody K.; Grohn K.; Bou-Abdallah F.; Doyle R. P. ChemPhotoChem 2017, 1, 256. 10.1002/cptc.201700039. [DOI] [PMC free article] [PubMed] [Google Scholar]
- Jarrett S. G.; Boulton M. E. Mol. Aspects Med. 2012, 33, 399. 10.1016/j.mam.2012.03.009. [DOI] [PMC free article] [PubMed] [Google Scholar]
- Iriyama A.; Fujiki R.; Inoue Y.; Takahashi H.; Tamaki Y.; Takezawa S.; Takeyama K.; Jang W.-D.; Kato S.; Yanagi Y. J. Biol. Chem. 2008, 283, 11947. 10.1074/jbc.M708989200. [DOI] [PubMed] [Google Scholar]
- Yonekawa Y.; Miller J. W.; Kim I. K. J. Clin. Med. 2015, 4, 343. 10.3390/jcm4020343. [DOI] [PMC free article] [PubMed] [Google Scholar]
- Dixson D. D.; Yu V. Y.; Doyle R. P. Anal. Biochem. 2011, 419, 145–152. 10.1016/j.ab.2011.08.042. [DOI] [PubMed] [Google Scholar]
- Biswas A.; Swarnkar R. K.; Hussain B.; Sahoo S. K.; Pradeepkumar P. I.; Patwari G. N.; Anand R. J. Phys. Chem. B 2014, 118, 10035. 10.1021/jp503589h. [DOI] [PubMed] [Google Scholar]
- Tetko I. V.; Poda G. I. J. Med. Chem. 2004, 47, 5601. 10.1021/jm049509l. [DOI] [PubMed] [Google Scholar]
- Tetko I. V.; Bruneau P. J. Pharm. Sci. 2004, 93, 3103. 10.1002/jps.20217. [DOI] [PubMed] [Google Scholar]
- Tetko I. V.; Tanchuk V. Y.; Villa A. E. P. J. Chem. Inf. Comput. Sci. 2001, 41, 1407. 10.1021/ci010368v. [DOI] [PubMed] [Google Scholar]
- Tetko I. V.; Tanchuk V. Y.; Kasheva T. N.; Villa A. E. P. J. Chem. Inf. Comput. Sci. 2001, 41, 1488. 10.1021/ci000392t. [DOI] [PubMed] [Google Scholar]
- Petrauskas A. A.; Kolovanov E. A. Perspect. Drug Discov. Des. 2000, 19, 99. 10.1023/A:1008719622770. [DOI] [Google Scholar]
- John M.; Wendeler M.; Heller M.; Sandhoff K.; Kessler H. Biochemistry 2006, 45, 5206. 10.1021/bi051944+. [DOI] [PubMed] [Google Scholar]
- Stokeley D.; Bemporad D.; Gavaghan D.; Sansom M. S. P. Biochemistry 2007, 46, 13573. 10.1021/bi701320a. [DOI] [PubMed] [Google Scholar]
- Grosdidier A.; Zoete V.; Michielin O. Nucleic Acids Res. 2011, 39, W270. 10.1093/nar/gkr366. [DOI] [PMC free article] [PubMed] [Google Scholar]
- Grosdidier A.; Zoete V.; Michielin O. J. Comput. Chem. 2011, 32, 2149. 10.1002/jcc.21797. [DOI] [PubMed] [Google Scholar]
- Emsley P.; Lohkamp B.; Scott W. G.; Cowtan K. Acta Crystallogr., Sect. D: Biol. Crystallogr. 2010, 66, 486. 10.1107/S0907444910007493. [DOI] [PMC free article] [PubMed] [Google Scholar]
Associated Data
This section collects any data citations, data availability statements, or supplementary materials included in this article.


