Abstract
Ultrafast plane wave microvessel imaging significantly improves ultrasound Doppler sensitivity by increasing the number of Doppler ensembles that can be collected within a short period of time. The rich spatiotemporal plane wave data also enables more robust clutter filtering based on singular value decomposition (SVD). However, due to the lack of transmit focusing, plane wave microvessel imaging is very susceptible to noise. This study was designed to: 1) study the relationship between ultrasound system noise (primarily time gain compensation-induced) and microvessel blood flow signal; 2) propose an adaptive and computationally cost-effective noise equalization method that is independent of hardware or software imaging settings to improve microvessel image quality.
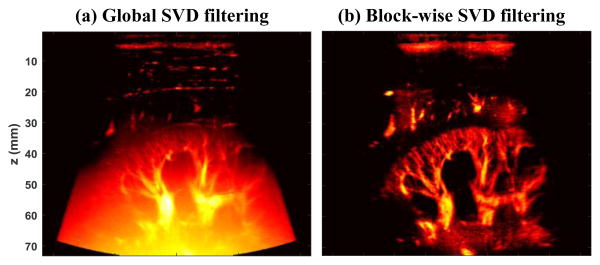
Ultrasound plane wave microvessel imaging has recently emerged as a promising technique for high sensitivity blood flow imaging without the use of contrast microbubbles [1-7]. The large number of ensembles that can be collected with ultrafast plane wave imaging significantly boosts the Doppler sensitivity [1]. The rich spatiotemporal information of ultrafast plane wave data also allows more robust tissue clutter rejection using advanced clutter filters based on singular value decomposition (SVD) [8, 9]. The use of plane waves, however, may limit the penetration of microvessel imaging due to the lack of transmit focusing. As we previously reported in [9], the background noise becomes significant in the mid-to-deep range of the microvessel image when filtered with global SVD clutter filters (Fig. 1(a)), which hinders the visibility of the microvessels. A block-wise adaptive SVD clutter filter can effectively suppress noise by rejecting high-order singular values [9], thus improving the signal-to-noise-ratio (SNR) and the contrast of the microvessel images (Fig. 1(b)). However, the block-wise SVD clutter filter is now computationally expensive and needs significant implementation advances to enable real-time usage. In [9], we also showed the feasibility of using a reference phantom data to equalize the background noise and improve the visual appearance of microvessel images. Although this equalization does not change the intrinsic SNR or contrast-to-noise-ratio (CNR) of the image data, it nonetheless is a simple, cheap, and arguably quite effective way to enable robust use of efficient global SVD-based clutter filters. The reference phantom method, however, is not adaptive and can be cumbersome in practice because new reference phantom data has to be acquired each time an imaging parameter changes (e.g., time gain compensation (TGC), frequency, transmit waveforms, etc.). Also, it was not well understood how ultrasound system analog gains such as TGC impact the SNR and CNR of microvessel imaging. This study was intended to: 1) investigate the source of the ramp-shaped background noise profile shown in Fig. 1(a) by a blood flow phantom study; and 2) introduce an adaptive noise equalization method that is imaging sequence and ultrasound system independent using a noise profile derived from the SVD clutter filtering process itself.
Figure 1.
Power Doppler microvessel images filtered by a global SVD clutter filter (a), and a block-wise adaptive SVD clutter filter (b).
To study the effect of noise on microvessel imaging, we used a Gammex ultrasound Doppler phantom (Model 1425A, Gammex Inc., Middleton, WI) with tissue and blood mimicking materials (ultrasound attenuation ∼0.7 dB/cm/MHz for the background tissue). The oblique vessel tube (diameter = 5 mm, 40° angle) was constantly perfused with a steady flow of speed of 15 cm/s. A Verasonics Vantage ultrasound system (Verasonics Inc., Kirkland, WA) and a linear array transducer L11-4v (Verasonics Inc., Kirkland, WA) were used to image the phantom. For the purpose of investigating the source of the ramp-shaped background noise and eliminating confounding factors that may cause inhomogeneous noise distribution across the field-of-view (FOV), no angular spatial compounding was used and the Verasonics' reconstruction sensitivity cutoff was set to zero for pixel-oriented beamforming (i.e., fixed aperture size and apodization for the beamforming process and each spatial pixel will use all 128 channels with equal weight for delay-and-sum beamforming) [10]. The later proposed noise equalization method does not need these controls to be turned off.
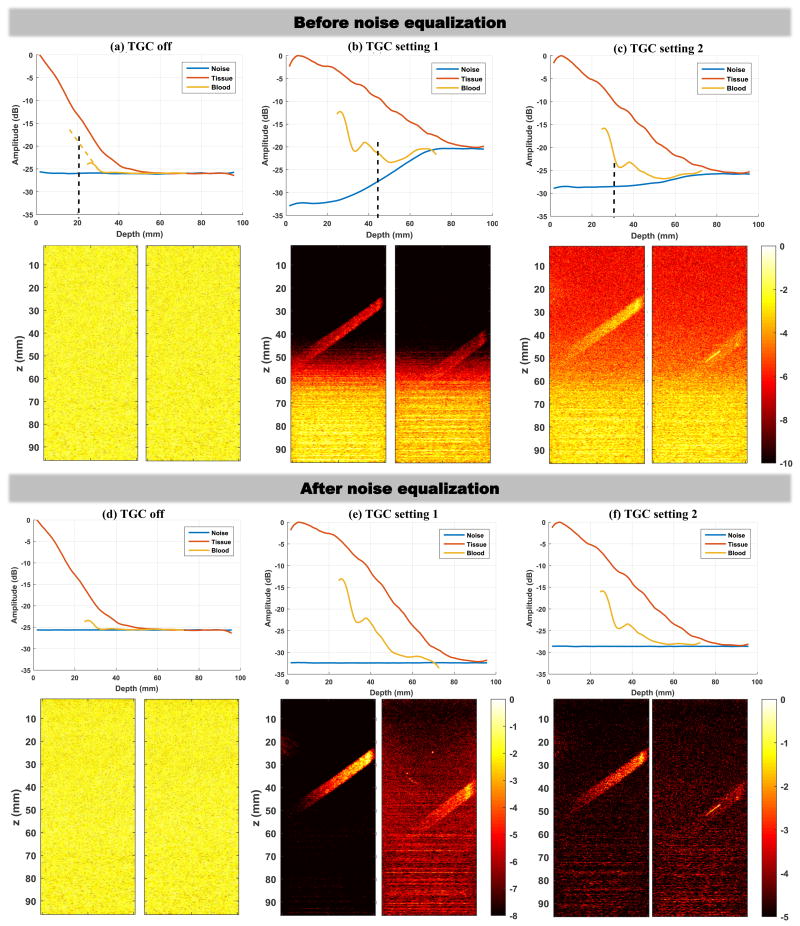
Ultrasound system noise, tissue signal and blood signal were measured under three different TGC settings, as shown in Fig. 2. TGC setting 1 is what is normally used for ultrafast microvessel imaging, and TGC setting 2 reduces the gain for deeper imaging regions (attempting to reduce the saturation for lower part of the microvessel images as in Fig. 1(a)). Noise was measured by turning off the ultrasound transmit voltage (i.e., receive only). Tissue signal was measured by imaging a homogeneous region (no blood flow) of the phantom. Blood signal was measured by imaging the oblique vessel tube at two different positions (i.e., the two different power Doppler images in each subpanel of Fig. 3) to obtain continuous blood signal measurement from approximately 25 mm (shallowest possible for this phantom) to 70 mm. Each curve in Fig. 3 was generated by first spatially averaging the signal (absolute value of the IQ data for noise, tissue, and blood) along the lateral direction in a 3.5 mm window, and then averaging along the temporal direction using 50 ensembles (pulse-repetition-frequency (PRF) = 500 Hz). The same transmit voltage and frequency (5 MHz) were used for all tissue and blood signal measurements.
Figure 2.
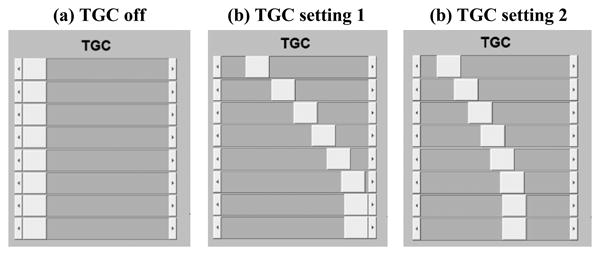
Different TGC settings of the Verasonics Vantage system that were used in this study.
Figure 3.
Noise, tissue, and blood signal measurements under different TGC settings (upper panel in each column), together with corresponding power Doppler images (lower panel in each column). The two power Doppler images in each subpanel were acquired separately to obtain continuous blood signal measurements from 25 mm to 70 mm depth. (a)-(c) results before noise equalization. (d)-(f) results after noise equalization. All power Doppler images from (a) to (d) were displayed under the same dynamic range (color bars are in unit of dB). Dynamic range was fine tuned for the best visual appearance of the blood signal for the power Doppler images shown in (e) and (f). The yellow dashed line in (a) indicates extrapolation of the curve in order to show the depth where the signal amplitude should have been 6dB greater than noise.
Figures 3(a)-(c) show the tissue, blood, and noise measurements under the three different TGC settings. The corresponding power Doppler images (SVD clutter filtered) are also shown in the lower panel under each column. It is clear that the high TGC setting 1 delivers the best power Doppler image with the best contrast. However, it is also clear that the high TGC setting at the deeper region of the FOV significantly elevated the noise level, which produces the ramp-shaped background profile with the lower part saturated. The ramp-shaped background does not normally appear in B-mode images because tissue signal, as shown in Fig. 3, has much higher amplitude than noise. Blood signal, on the other hand, has much lower amplitude than tissue, and therefore is more susceptible to noise. When the difference between blood signal and noise drops below 6 dB (indicated by the black dashed lines in Figs. 3(a)-(c)), the blood signal is submerged by noise and becomes indiscernible. When lowering the TGC setting (i.e., TGC setting 2), the ramp-shaped background noise became less pronounced but the blood signal contrast also diminished. The situation exacerbated with TGC turned off, and no blood signal could be detected at all despite the uniform background noise profile (Fig. 3(a)). Therefore, in practice, the use of higher TGC is still beneficial to improve plane wave microvessel imaging contrast. Note that in this experiment setup beyond the depth marked by the black dashed line which indicates SNR lower than 6 dB, the blood signal begins to follow the noise curve. This suggests that when the blood signal amplitude drops to a certain level that is close to the amplitude of noise, what is displayed is essentially noise and cannot be further improved by increasing the gain.
A simple and cheap solution to alleviate the ramp-shaped background and improve the visual appearance of the power Doppler images is to equalize the background noise profile. As shown in Figs. 3(d)-(f), this can be achieved by dividing (or subtracting if using logarithm scale) the signal curve by the normalized noise curve (i.e., normalize the noise curve to the minimum value of the noise). After equalization, all noise profiles became flat and all the background noise ramps disappeared. The high noise value in the deeper region of the image is effectively reduced to the same level as in the shallow region, which provides a “quieter” background that offers better visualization of the blood signal. However, note that the distance between the signal (both tissue and blood) and the noise remains the same before and after equalization, which shows that the SNR is not actually being improved by equalization. This makes sense because the data is simply being divided by a depth-dependent value, so noise is not rejected and signal is not elevated during the equalization process.
To perform the noise equalization process in the examples in Fig. 3, the noise profile needs to be experimentally measured as described above. While this can be done in practice by transiently turning off the transmit power (or transmitting a waveform with 0% duty cycle or other equivalent approaches that allow receive only) and obtaining the noise profile, or by pre-collecting the noise profiles for all possible imaging settings (including different transducers, imaging depths, spatial compounding angles, receive apodization, TGC, beamforming settings such as sensitivity cutoff etc.), it would be much more advantageous and practical to be able to derive the noise field in a manner that is independent of the imaging settings (both hardware and software). Here we propose to use the lowest order singular values and singular vectors to derive such a noise field that can be used for noise equalization.
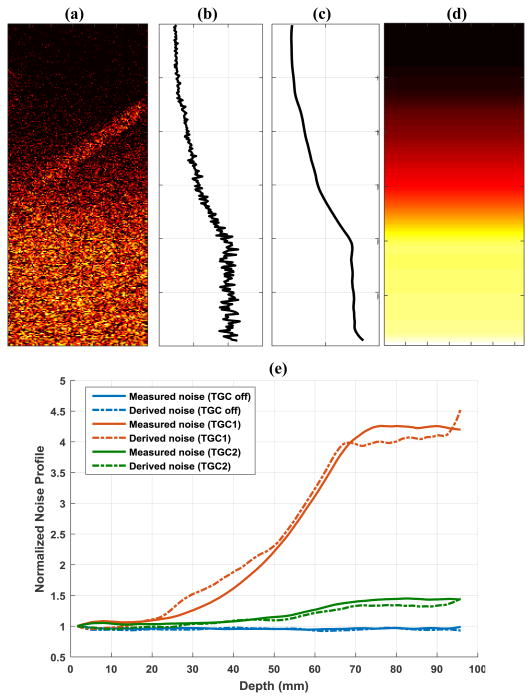
As shown in Fig. 4(a), a noise field (N) can be derived from the last order of singular values and singular vectors obtained by SVD clutter filter. Specifically:
Figure 4.
(a) Noise field derived from the last rank singular value and singular vectors from SVD clutter filter. (b) 1-D noise profile obtained by averaging all pixels in (a) along lateral direction at each depth. (c) Smoothed 1-D noise profile. (d) Final equalization noise field obtained by replicating (c) along the lateral dimension. (e) Comparisons of derived noise profiles and measured noise profiles under different TGC settings.
| (1) |
where U is the left singular vectors and V is the right singular vectors obtained from SVD of the ultrasound IQ data that is reshaped into Casorati matrix form [8], and DN is all-zero except the last few elements which represent last N smallest singular values from SVD. The rationale behind this noise field derivation is that while tissue signal is represented by the large singular values and blood signal is represented by the intermediate singular values, noise mostly resides in the small singular values, which represent the least coherent or least significant signal from the data. In this study N was set to equal to 1 (i.e., only the smallest singular value was used for noise estimation). By averaging this derived noise field (Fig. 4(a)) along the lateral direction (Fig. 4(b)), followed by smoothing (Fig. 4(c), e.g., using a sliding averaging filter) and replicating back to the original dimension (Fig. 4(d)), one can obtain a robust noise profile that can be used for equalization. Figure 4(e) shows good agreement between the derived noise profiles and the experimentally measured noise profiles under different TGC settings. Note that even for the smallest singular value, there can still be blood signal (Fig. 4(a)), which is primarily from the fast flow signal represented by the high-rank singular vectors. The averaging and smoothing process will minimize the influence of blood flow signal on noise field estimation. Also, using the median value across the lateral direction may further reduce the influence of the residual blood signal. Meanwhile, in this study only 50 ensembles were collected. A higher number of ensembles should provide higher-ranked singular values that can better represent noise. Nevertheless, the smallest singular value provides the closest approximation to noise and should be used to derive the noise field.
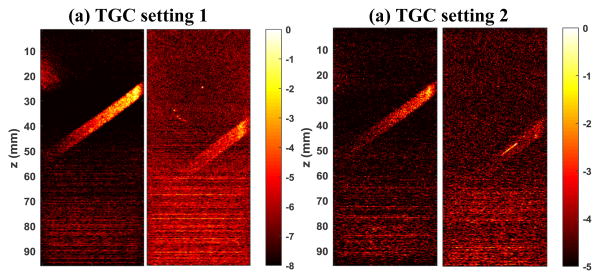
Figure 5 shows the noise equalized power Doppler images using the derived noise field. The images were displayed using the same scale as the ones in Figs. 3(e) and (f). One can see that the background ramp-shaped noise profile could be effectively suppressed using the derived noise field. The noise equalization in Fig. 5(a) is slightly inferior to the one in Fig. 3(e) in the deeper region. This could be attributed to the slightly underestimated noise level with the derived noise method, as shown in Fig. 4(e). Nevertheless, the equalization using the derived noise provides significant improvement over the original non-equalized images.
Figure 5.
Noise-equalized power Doppler maps using the derived noise field. All color bars are in unit of dB.
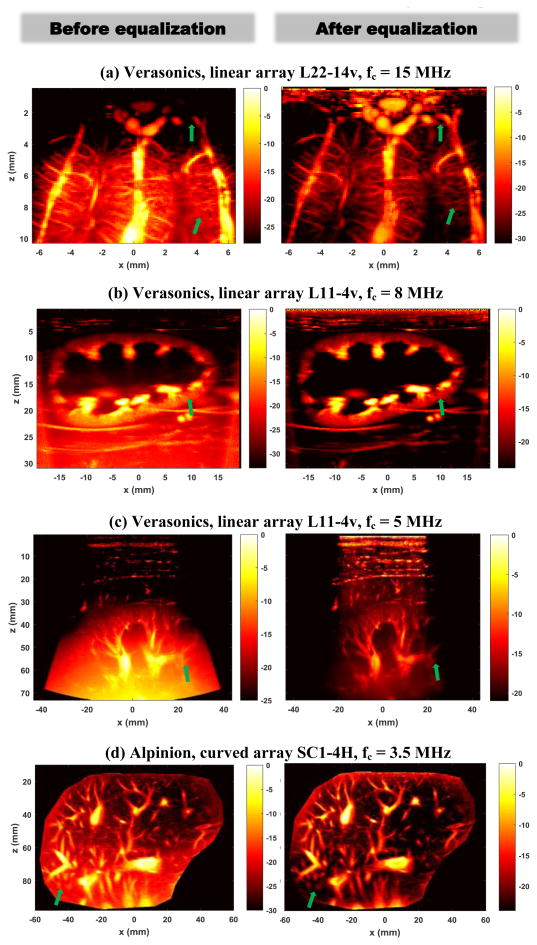
Figure 6 shows more examples of using the proposed noise equalization method with different imaging systems, transducers, and imaging frequencies on different tissues with different imaging depths. Figure 6(a) was obtained from an in vivo open-skull pig brain with the Verasonics Vantage system and a linear array L22-14v transducer (Verasonics Inc., Kirkland, WA) with center imaging frequency of 15 MHz (15-angle compounding with a post-compounding PRF of 500 Hz); Fig. 6(b) was obtained from an in vivo rabbit kidney with the Verasonics Vantage system and the L11-4v transducer with center imaging frequency of 8 MHz (10-angle compounding with a post-compounding PRF of 500 Hz); Fig. 6(c) was obtained from an in vivo human kidney with the Verasonics Vantage system and the L11-4v transducer with center imaging frequency of 5 MHz (10-angle compounding with a post-compounding PRF of 500 Hz); and Fig. 6(d) was obtained from an in vivo human liver using an Alpinion ECUBE-12R ultrasound system and a curved array transducer SC1-4H (Alpinion USA, Bothell, WA), with a center imaging frequency of 3.5 MHz (7-angle compounding with a post-compounding PRF of 500 Hz). All experiments were approved by Mayo Clinic Institutional Animal Care and Use Committee and Institutional Review Board. All power Doppler images were processed by a global SVD clutter filter. The display dynamic range was carefully adjusted for each image to best visualize microvessel blood signal. From Fig. 6 one can see that the noise equalization could significantly improve the visibility of microvessels throughout the FOV. Several examples are indicated by the green arrows in Fig. 6, in which one can hardly see these vessels before equalization, while after equalization these vessels become more discernible.
Figure 6.
Power Doppler images before (left column) and after (right column) noise equalization obtained from various ultrasound systems, transducers, and imaging frequencies. All color bars are in unit of dB.
An alternative approach to derive the 2D noise profile for equalization is to directly use the 2D noise field derived from Eq. (1), provided that the amount of residual blood flow signal is negligible and can be removed by methods such as spatial smoothing filters. Figure 7 shows an example of applying a 2D median filter (13 mm × 13 mm) on the noise map (Fig. 7(a)) to obtain a 2D noise profile (Fig. 7(b)) for equalization (Fig. 7(c)). The advantage of directly using the 2D noise map is that it provides a more accurate estimate of the noise field, facilitating more robust noise equalization. As shown in Fig. 6(c), when using the averaging and smoothing approach (Fig. 4 (a-d)), the arc-shaped noise field induced by sensitivity cutoff control of the Verasonics system could not be accounted for, resulting in over-equalization on the left and right edges of the power Doppler image (i.e., darker edges). This issue could be alleviated with the noise profile directly obtained from the 2D noise field, as shown in Fig. 7(c).
Figure 7.
An example of directly using the 2D noise field derived from the last singular value and vector to perform noise equalization. (a) Original 2D noise map; (b) Heavily-smoothed noise map with a 2D median filter; (c) equalized power Doppler image using (b).
In summary, in this paper we investigated the source of the ramp-shaped background noise issue for ultrafast plane wave microvessel imaging, and proposed a noise equalization method based on the noise field derived from the lowest-rank singular values and singular vectors that can be obtained from the SVD clutter filtering process. Unlike traditional power Doppler imaging where interleaved line-by-line scanning is used with focused ultrasound beams, plane wave microvessel imaging is more vulnerable to noise due to lack of transmit focusing and the resulting low blood signal amplitude. As shown in the phantom study as well as previously reported by Mace et al. [1], when the intensity of the blood signal fails to exceed the noise floor, blood signal becomes undetectable and what is being displayed is essentially noise. Consequently when spatial noise distribution is uneven (i.e., ramp-shaped, which can be caused by factors such as TGC, spatially variant beamforming settings such as aperture size and apodization, etc.), the power Doppler image appears saturated which hinders visibility of microvessel signals. We demonstrated the effectiveness of the proposed noise equalization method in improving the visual appearance of the microvessel power Doppler images under different imaging systems, transducers, frequencies, and tissues. The proposed noise equalization method is independent of hardware and software imaging settings and can be conveniently derived from the SVD clutter filtering process, which is becoming a commonly used clutter filter for ultrafast microvessel imaging. One limitation of the proposed method is the residual fast blood flow signal in the high-rank singular vectors (particularly under aliasing conditions), which causes imperfect derivation of the noise field. Although the influence of the residual flow signal could be minimized by the proposed averaging and smoothing process, a high imaging PRF would be needed to fully remove it. Increasing PRF, however, may cause practical concerns such as increased computational load (e.g., beamforming and clutter filtering, and consequently increased burden for real-time imaging) and elevated transducer and tissue heating that need to be considered. Also, a lower PRF is sometimes preferred to image small vessel with slow flows. The “zero-transmit” approach that was used to experimentally measure noise profile in this study, on the other hand, does not suffer from the residual blood flow signal as in the SVD-based equalization method. It can also be implemented on non-plane wave imagers. One caveat as mentioned above is the necessity of transmitting a blank pulse (or several blank pulses to perform temporal averaging as was done in this study to obtain a smooth noise profile) to measure the noise floor after setting changes. However, this may not be a significant disadvantage in practice because discarding a single frame or even several frames (for temporal averaging) may be trivial. In the case of a single blank pulse transmission, the same smoothing process as introduced in the 1D case in Fig. 4 or the 2D case as in Fig. 7 may be utilized to derive equalization profiles. In practice, one needs to balance the trade-offs of each method and choose the most feasible one for noise equalization. In this study, we found that although noise equalization did not actually improve SNR, it improved visibility of microvessels. The noise field estimation process has very low computational cost and offers a simple and cheap solution that is suitable for real-time microvessel imaging. Future research direction will be focused on achieving actual improvement of microvessel imaging SNR by increasing the signal level of blood with methods such as coded excitation [11], decreasing the noise level of the ultrasound system by improving the TGC noise characteristics, or by improving the computational performance of advanced clutter filtering methods such as the block-wise adaptive clutter filter – which performs the equalization above implicitly, and also truly improves SNR – so that they become feasible for real-time imaging.
Acknowledgments
Research reported in this publication was supported in part by the Mayo Clinic Children's Research Center through the Pediatric Team Science Award FP00083774; and in part by the National Cancer Institute of the National Institutes of Health under Award Number K99CA214523. The content is solely the responsibility of the authors and does not necessarily represent the official views of the National Institutes of Health.
Contributor Information
Pengfei Song, Department of Radiology, Mayo Clinic College of Medicine, Rochester, MN 55905 USA.
Armando Manduca, Department of Physiology and Biomedical Engineering, Mayo Clinic College of Medicine, Rochester, MN 55905 USA.
Joshua D. Trzasko, Department of Radiology, Mayo Clinic College of Medicine, Rochester, MN 55905 USA
Shigao Chen, Department of Radiology, Mayo Clinic College of Medicine, Rochester, MN 55905 USA.
References
- 1.Mace E, Montaldo G, Osmanski B, Cohen I, Fink M, Tanter M. Functional ultrasound imaging of the brain: theory and basic principles. IEEE Transactions on Ultrasonics, Ferroelectrics and Frequency Control. 2013;60:492–506. doi: 10.1109/TUFFC.2013.2592. [DOI] [PubMed] [Google Scholar]
- 2.Mace E, Montaldo G, Cohen I, Baulac M, Fink M, Tanter M. Functional ultrasound imaging of the brain. Nature Methods. 2011;8:662–U85. doi: 10.1038/nmeth.1641. [DOI] [PubMed] [Google Scholar]
- 3.Urban A, Dussaux C, Martel G, Brunner C, Mace E, Montaldo G. Real-time imaging of brain activity in freely moving rats using functional ultrasound. Nat Methods. 2015 Sep;12:873–8. doi: 10.1038/nmeth.3482. [DOI] [PubMed] [Google Scholar]
- 4.Provost J, Papadacci C, Demene C, Gennisson JL, Tanter M, Pernot M. 3-D ultrafast doppler imaging applied to the noninvasive mapping of blood vessels in Vivo. IEEE Transactions on Ultrasonics, Ferroelectrics, and Frequency Control. 2015 Aug;62:1467–72. doi: 10.1109/TUFFC.2015.007032. [DOI] [PMC free article] [PubMed] [Google Scholar]
- 5.Tanter M, Fink M. Ultrafast imaging in biomedical ultrasound. IEEE Transactions on Ultrasonics, Ferroelectrics and Frequency Control. 2014;61:102–119. doi: 10.1109/TUFFC.2014.6689779. [DOI] [PubMed] [Google Scholar]
- 6.Osmanski BF, Pezet S, Ricobaraza A, Lenkei Z, Tanter M. Functional ultrasound imaging of intrinsic connectivity in the living rat brain with high spatiotemporal resolution. Nature communications. 2014;5:5023. doi: 10.1038/ncomms6023. [DOI] [PMC free article] [PubMed] [Google Scholar]
- 7.Osmanski BF, Martin C, Montaldo G, Laniece P, Pain F, Tanter M, Gurden H. Functional ultrasound imaging reveals different odor-evoked patterns of vascular activity in the main olfactory bulb and the anterior piriform cortex. NeuroImage. 2014 Jul 15;95:176–84. doi: 10.1016/j.neuroimage.2014.03.054. [DOI] [PubMed] [Google Scholar]
- 8.Demene C, Deffieux T, Pernot M, Osmanski BF, Biran V, Gennisson JL, Sieu LA, Bergel A, Franqui S, Correas JM, Cohen I, Baud O, Tanter M. Spatiotemporal Clutter Filtering of Ultrafast Ultrasound Data Highly Increases Doppler and fUltrasound Sensitivity. IEEE Transactions on Medical Imaging. 2015 Nov;34:2271–85. doi: 10.1109/TMI.2015.2428634. [DOI] [PubMed] [Google Scholar]
- 9.Song P, Manduca A, Trzasko JD, Chen S. Ultrasound Small Vessel Imaging With Block-Wise Adaptive Local Clutter Filtering. IEEE Trans Med Imaging. 2017 Jan;36:251–262. doi: 10.1109/TMI.2016.2605819. [DOI] [PubMed] [Google Scholar]
- 10.Daigle RE. Ultrasound imaging system with pixel oriented processing. 2009 US20090112095A1. [Google Scholar]
- 11.Chiao RY. Method and apparatus for flow imaging using Golay codes. 2001 6,312,384. [Google Scholar]


