

SUMMARY
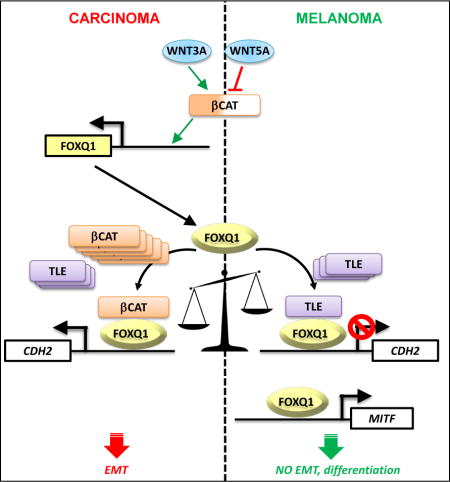
Opposite lineage-specific regulation of tumor progression by the same transcription factor is an understudied phenomenon. Here, we report that levels of a carcinoma oncogenic transcription factor FOXQ1 are decreased during melanoma progression. Moreover, in melanoma cells, FOXQ1 suppresses the same processes it activates in carcinoma cells: epithelial-to-mesenchymal transition, invasion, and metastasis. We identify that lineage-specific tumor suppressor or oncogenic functions of FOXQ1 in large part depend on its ability to repress or activate expression of the same gene (N-cadherin, (CDH2)) in melanoma or carcinoma cells, respectively. Mechanistically, we demonstrate that FOXQ1 interacts with nuclear β-catenin and TLE proteins, and that repression of CDH2 by FOXQ1 occurs in the presence of TLE and absence of nuclear β-catenin, levels of which are lower in human melanomas than carcinomas. Accordingly, FOXQ1-dependent phenotypes can be manipulated by altering nuclear β-catenin or TLE proteins levels. Our data identify a novel melanoma suppressor and establish a unique mechanism underlying inverse lineage-specific transcriptional regulation of transformed phenotypes.
Keywords: Melanoma, carcinoma, FOXQ1, N-cadherin, β-catenin
Graphical abstract
INTRODUCTION
Metastatic melanoma is one of the most deadly forms of cancer with rising incidence (Schadendorf et al., 2015; Shain and Bastian, 2016). The invasive and metastatic potential of melanoma cells is determined by their ability to undergo a process that resembles the epithelial to mesenchymal transition (EMT) (Alonso et al., 2007; Caramel et al., 2013; Tulchinsky et al., 2014). EMT underlies the acquisition of enhanced migratory and invasive properties by epithelial cells which are often associated with poor prognosis and a high risk of metastasis (Heerboth et al., 2015; Lamouille et al., 2014). Mechanistically, EMT is characterized by a cadherin switch, wherein the junctional adhesion protein E-cadherin (CDH1) is replaced by the neural subtype N-cadherin (CDH2) (Wheelock et al., 2008). This transition is orchestrated by a network of EMT transcription factors (EMT-TFs), including members of SNAI, ZEB, TWIST and FOX families (Caramel et al., 2013; Lamouille et al., 2014). Although melanoma cells are not epithelial in nature, an EMT-like transition, including a cadherin switch, promotes melanoma invasion and metastasis (Alonso et al., 2007; Caramel et al., 2013; Li et al., 2015; Wheelock et al., 2008). Consistently, primary cutaneous melanomas that give rise to metastases demonstrate an increase in the mesenchymal marker N-cadherin and a decrease in the epithelial marker, E-cadherin, compared to tumors not progressing to metastases (Alonso et al., 2007).
In melanoma cells, lineage-specific microphthalmia associated transcription factor (MITF), the master regulator of melanocytic differentiation and development, has also been characterized as a major suppressor of the EMT-like process and invasion (Bianchi-Smiraglia et al., 2016; Carreira et al., 2006b; Hartman and Czyz, 2015; Hoek et al., 2008). Although the MITF gene has been reported to undergo amplification in ~15% of melanomas (Garraway et al., 2005), a significant body of literature demonstrates that strong downregulation of MITF, sometimes even below detection, correlates with poor prognosis and disease progression in patients (Carreira et al., 2006a; Salti et al., 2000; Selzer et al., 2002; Wellbrock and Marais, 2005).
Previously, two carcinoma EMT-TFs (ZEB2 and SNAI2) have been demonstrated to suppress EMT in melanoma cells via transcriptional upregulation of MITF-associated differentiation. Yet the molecular factors regulating the EMT-like processes in melanoma cells independently of MITF or in cells with low or undetectable levels of MITF remain understudied.
Forkhead transcription factor FOXQ1, has been characterized as a major promoter of EMT, invasion and metastasis in cells from several carcinomas including breast, colon, ovarian, and lung, where its levels correlate with poor prognosis (Li et al., 2016). FOXQ1 has been shown to exert oncogenic activity in large part by promoting the E/N cadherin switch (Zhang et al., 2011). Here, we report mechanisms underlying the ability of FOXQ1 to inhibit the same processes in melanoma cells.
RESULTS
FOXQ1 expression levels decrease during melanomagenesis
We were interested in identifying the expression pattern of FOXQ1 during melanoma progression. Surprisingly, we observed that the amounts of FOXQ1 mRNA and protein were significantly decreased in cells from the vast majority of melanoma cell lines as compared to normal human melanocytes (NHM) (Figure 1A). Moreover, assessment of FOXQ1 expression in human melanoma specimens via immunohistochemistry demonstrated a statistically significant decrease in FOXQ1 levels in metastatic versus primary melanomas (Figure 1B, Figure S1A). Consistently, analysis of the “TCGA cutaneous melanoma RNAseq” dataset (http://cancergenome.nih.gov/) revealed a significant drop in FOXQ1 mRNA levels in metastatic versus primary melanoma specimens (Figure 1C). Similarly, FOXQ1 levels decreased in melanoma progression according to a separate gene expression database (Figure S1B, GSE4587 (Smith et al., 2005)). Taken together these data suggest that, unlike in carcinoma progression, FOXQ1 expression levels decrease in melanoma progression.
Figure 1. FOXQ1 levels decrease in melanoma progression.
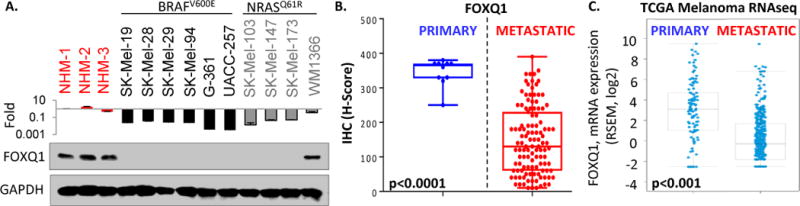
A. Indicated cells were probed in Q-RT-PCR (FOXQ1/ACTB signal ratios are shown) (top), or in immunoblotting with the indicated antibodies (bottom). B. Expression of FOXQ1 in primary melanomas (individual tissue sections) and melanoma metastases (TMA). See Supplemental Materials for sample description and analysis. C. FOXQ1 mRNA expression (RSEM counts) in Skin cutaneous melanoma TCGA database.
FOXQ1 negatively affects multiple transformed phenotypes in melanoma cells
To reveal the functional role of FOXQ1 downregulation, we restored its levels in cells from several melanoma cell lines approximately to the levels in NHM via lentiviral vector-based transduction of FOXQ1 cDNA. This caused a wide spectrum of tumor suppressor phenotypes ranging from prominent inhibition of proliferation and induction of differentiation (SK-Mel-19, −29, Figure 2A–C), to a modest suppression of proliferation and a substantial decrease in invasion, tumorigenicity and experimental metastasis (SK-Mel-103, SK-Mel-147, or Colo679, Figure 2D–I). Importantly, transduction of the same FOXQ1-expressing vector in breast (HMLER) or ovarian (SCOV3) carcinoma cells increased their invasion and enhanced tumorigenicity and experimental metastases over cells transduced with control vecor (Figure S2A–G). Therefore, unlike in carcinoma cells, FOXQ1 induces tumor suppressor phenotypes in melanoma cells.
Figure 2. FOXQ1 exerts tumor suppressive phenotypes in melanoma.
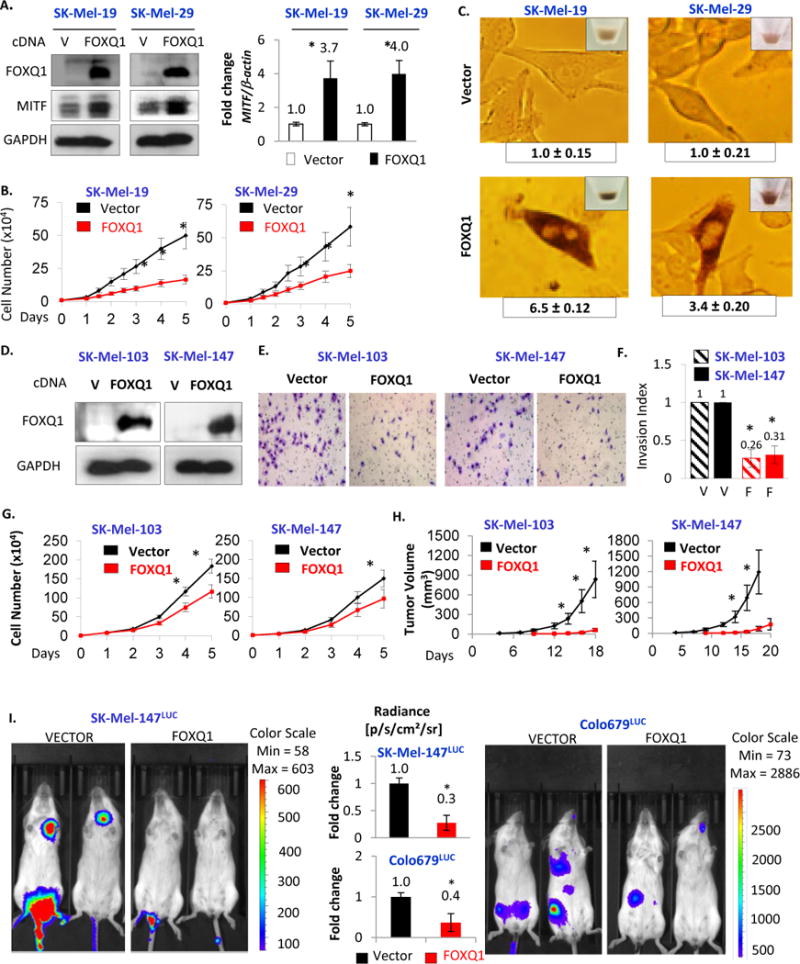
A. Cells transduced with the indicated constructs were probed in immunoblotting with the indicated antibodies (left) or in Q-RT-PCR with indicated primers (right). B. Cells described in (A) were counted daily starting 48hrs after infection. C. Representative images of cells described in (A). Images were taken 96hrs after infection. D. Cells expressing vector (V) or FOXQ1 were probed in immunoblotting with the indicated antibodies. E. Representative images of cells described in (D) after completion of Boyden invasion chambers assay. F. Quantification of (E). G. Cells described in (D) were counted at indicated days or H. subjected to tumorigenicity assay in SCID mice (n=5). I. SK-Mel-147LUC and Colo679LUC cells stably expressing luciferase were transduced with the indicated constructs and tail-vein injected into SCID mice (n=6). Mice were assayed for bioluminescence via IVIS three weeks post-injection. Representative images shown, Bar diagram demonstrates data quantification. All data represent mean ± s.e.m. Statistical significance was assessed using two-tailed Student’s t-tests. A p<0.05 (*) was considered significant.
FOXQ1 represses CDH2 in melanoma cells with various levels of MITF
MITF is a major transcriptional repressor of melanoma cell invasion (Carreira et al., 2006). We were intrigued by the observation that FOXQ1 suppressed invasion in melanoma cells not expressing MITF protein (SK-Mel-103 and SK-Mel-147, Figure S3A). In carcinoma cells, FOXQ1 transcriptionally activates several genes involved in EMT (Qiao et al., 2011; Zhang et al., 2011; Meng et al., 2015) including those encoding ZEB2, TWIST1, vimentin and N-cadherin (CDH2), and represses transcription of E-cadherin (CDH1) gene. Therefore, we assessed the levels of these proteins in SK-Mel-103 and SK-Mel-147 cells transduced with empty vector or FOXQ1-expressing vector. Levels of TWIST1, ZEB2 and vimentin remained unchanged, whereas E-cadherin levels were undetectable in these cells (Figure 3A). Therefore, the above proteins are unlikely to account for FOXQ1 tumor suppressor functions in melanoma cells. At the same time, these genes demonstrated FOXQ1-dependent pattern of regulation in carcinoma cells, consistent with FOXQ1 role in carcinoma (Figure 3A).
Figure 3. FOXQ1 differentially regulates CDH2 in melanoma and carcinoma cells.
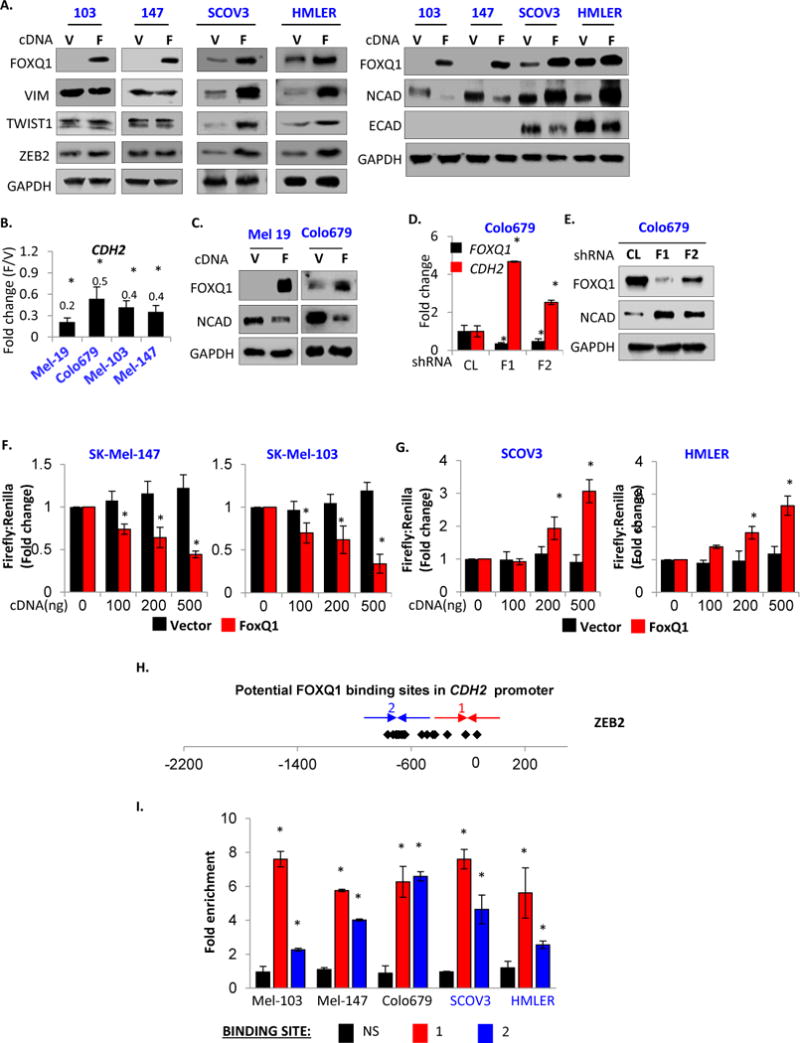
A. Cells transduced with the vector (V) or FOXQ1 (F) were probed in immunoblotting with indicated antibodies. B. CDH2/ACTB QRT-PCR signals obtained in cells transduced with FOXQ1 cDNA (F) were normalized by corresponding QRT-PCR signals obtained in cells transduced with empty vector (V). C. Indicated melanoma cells were treated like in (A). D. Cells were transduced with control (CL) or FOXQ1 (F1, F2) shRNAs and probed in Q-RT-PCR with indicated primers (FOXQ1/ACTB and CDH2/ACTB signal ratios are shown). E. Cells described in (D) were probed in immunoblotting with the indicated antibodies. F–G. Cells were co-transfected with either pGL3-basic (black) or pGL3-CDH2 (red) vectors and the indicated amounts of FOXQ1 cDNA or empty vector, and assayed for luciferase activity. H. CDH2 promoter. Shown are FOXQ1 binding sites (diamonds) and PCR primers (arrows). I. ChIP Assay. Q-PCR signals in reactions with DNA precipitated with FLAG antibodies from FLAG-FOXQ1-cells were normalized by corresponding signals in vector cells and by the signal obtained with CDH2 non-specific control primers (NS). Black, red and blue bars correspond to FOXQ1 non-specific DNA region, FOXQ1 binding regions “1”, and “2”, respectively.
Paradoxically, ectopic expression of FOXQ1 uniformly suppressed CDH2 mRNA and protein levels in all tested melanoma cells (Figure 3A–C), independently of their MITF levels (Figure. S3A) Reciprocally, shRNA-mediated depletion of FOXQ1 in a Colo-679 human melanoma cells expressing low but detectable levels of FOXQ1 increased CDH2 mRNA and protein levels compared to control shRNA cells (Figure 3DE). In contrast, using the same genetic constructs we reproduced previously published findings that FOXQ1 overexpression upregulates, whereas its depletion decreases CDH2 mRNA and protein levels in carcinoma cells including HeLa, HMLE, HMLER, and SCOV3 (Figure S3B–D).
To investigate whether FOXQ1 is also capable of suppressing N-cadherin levels and invasion in cells with acutely depleted MITF, we transduced SK-Mel-28 melanoma cells in parallel with control or two MITF-specific shRNAs, followed by superinfection with empty vector or vector expressing FOXQ1. As shown in Figure S3E, depletion of MITF did not substantially affect the ability of FOXQ1 to suppress N-cadherin levels. Accordingly, FOXQ1 suppressed invasion in MITF-depleted SK-Mel-28 cells to a similar degree as in control SK-Mel-28 cells (Figure S3F). Collectively these observations suggest that FOXQ1 suppresses invasion predominantly in MITF-independent manner.
To further evaluate cell type-specific pattern of CDH2 transcriptional control by FOXQ1, we tested its ability to regulate CDH2 promoter-driven transcription in a luciferase reporter assay in carcinoma and melanoma cells. To this end, we cloned the (−2200: 500bp) region of human CDH2 gene into pGL3-basic vector (pGL3-CDH2). This construct, in parallel with empty pGL3-basic vector, was co-transfected in combination with empty expression vector or FOXQ1-expressing vector into melanoma (SK-Mel-103, SK-Mel-147) or carcinoma (SCOV3 and HMLER) cells. We demonstrated that FOXQ1 respectively induced or suppressed activity of exogenous CDH2 promoter in carcinoma and melanoma cells (Figure. 3FG). Therefore, collectively, our data suggest that FOXQ1 oppositely regulates CDH2 gene expression in a lineage-specific manner.
FOXQ1 interacts with β–Catenin and TLE proteins in melanoma and carcinoma cells
To determine whether FOXQ1 binds to the CDH2 promoter at the same binding sites in melanoma and carcinoma cells, we performed chromatin immunoprecipitation (ChIP) assay using FLAG antibodies in melanoma (SK-Mel-103, −147) and carcinoma (HMLER, and SCOV3) cells transduced with either control vector or FLAG-FOXQ1-expressing vector. Our analyses identified similar enrichment patterns of CDH2 promoter regions in materials precipitated with FLAG antibodies from both carcinoma and melanoma cells expressing FLAG-FOXQ1, but not control cells (Figure 3HI). These data suggest that FOXQ1 interacts with the same binding sites in the promoter of CDH2 gene in both cell lineages.
We hypothesized that lineage-specific transcriptional regulation of CDH2 by FOXQ1 may depend on co-factor(s) differentially interacting with FOXQ1 in melanoma and carcinoma cells. TCF/LEF transcription factors represent a classic example of co-factor-dependent mode of transcription regulation. TCF/LEF proteins interact with groucho/TLE transcription repressors resulting in suppression of downstream genes (Roose et al., 1998). Nuclear β-catenin displaces groucho/TLEs thus allowing transcription activation by TCF/LEF (Daniels and Weis, 2005). Additionally, melanoma cells possess reduced levels of nuclear β-catenin (Biechele et al., 2012; Kuphal and Bosserhoff, 2011).
To identify the role of β-catenin in FOXQ1-dependent processes, we first demonstrated that the studied melanoma cells contained lower amounts of nuclear β-catenin than carcinoma cells (Figure 4A) in agreement with previous findings (Biechele et al., 2012; Kuphal and Bosserhoff, 2011). We did not detect a uniform difference in the levels of nuclear TLEs proteins between melanoma and carcinoma cells (Figure 4A). Next, we probed several melanoma and carcinoma cells in a TOP/FOP assay, a well-established method for detecting β-catenin activity in a cell. Melanoma cells were less active in a TOP/FOP assay than carcinoma cells (Figure 4B), as it has been previously reported (Biechele et al., 2012; Kuphal and Bosserhoff, 2011). Also, levels of AXIN2, a bona fide marker of activated β-catenin pathway were generally lower in melanoma than carcinoma cells (Figure S4A).
Figure 4. FOXQ1 interacts with β-catenin/TLE proteins.
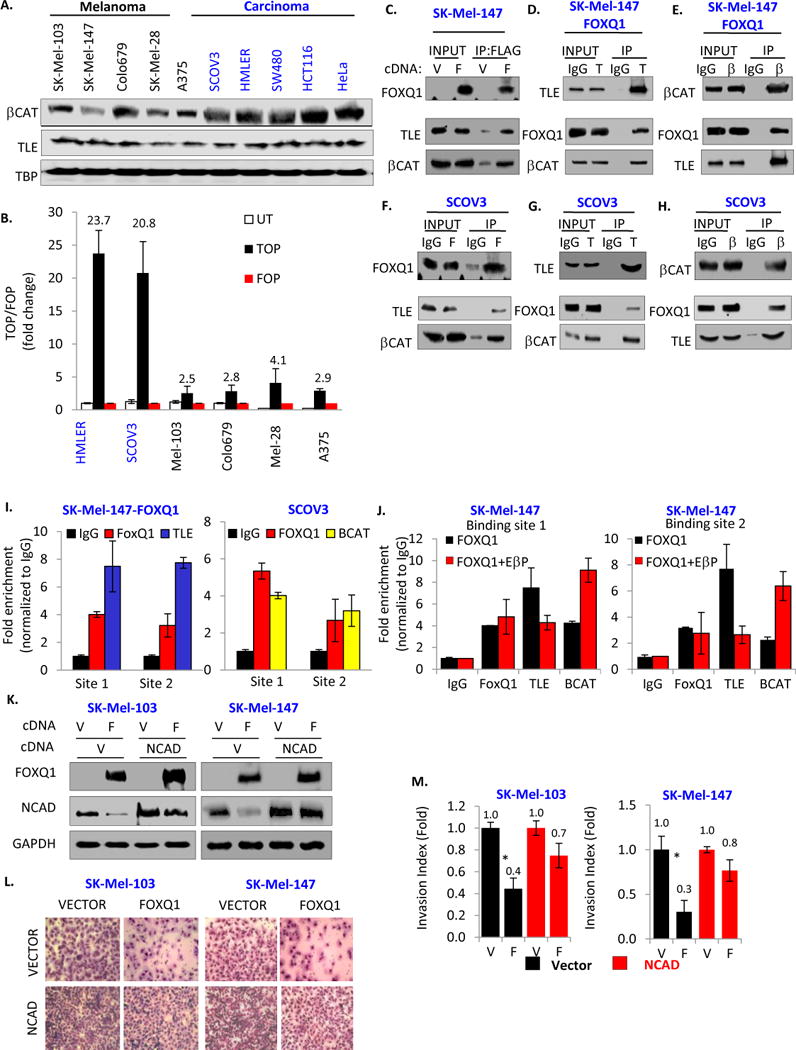
A. Nuclear extracts from the indicated cells were probed in immunoblotting with the indicated antibodies (TBP=TATA-binding protein). B. TOP:FOP luciferase reporter assay performed in the indicated cells. C. SK-Mel-147 cells were transduced with empty vector (V) or FOXQ1-expressing vector (F) followed by preparation of nuclear extracts, immunoprecipitation with FLAG antibodies, and immunoblotting with the indicated antibodies. D–E. Nuclear extracts were prepared from SK-Mel-147-FOXQ1 cells, followed by immunoprecipitation with pan-TLE (T) or β-catenin (β) antibodies and immunoblotting with the indicated antibodies (middle and right panels). F–H. Nuclear extracts were prepared from SCOV3 cells, followed by immunoprecipitation with the indicated antibodies (F=FOXQ1, T=pan-TLE, β=β-catenin), and immunoblotting with the indicated antibodies. I. SK-Mel-147 cells expressing FLAG-FOXQ1 (left panel) or untreated SCOV3 (right panel) were probed in ChIP assay with the indicated antibodies. Shown are ratios of Q-PCR signals in reactions with DNA precipitated with the indicated antibodies and DNA precipitated with IgG antibodies. J. SK-Mel-147 cells expressing FLAG-FOXQ1 (FOXQ1) or FLAG-FOXQ1 and EβP (FOXQ1+EβP) were probed in ChIP assay with antibodies indicated on the bottom. Shown are ratios of Q-PCR signals in reactions with DNA precipitated with the indicated antibodies and DNA precipitated with IgG antibodies. K. Cells were transduced with empty vector (V) or N-cadherin-expressing vector (NCAD) and superinfected with empty vector (V) or FOXQ1-expressing vector (F) and probed in immunoblotting with the indicated antibodies. L. Cells described in (K) were probed in invasion assay (representative chamber images are shown). M. Shown are invasion indexes of cells described in (K). All invasion indexes were normalized by the same in “vector-vector” cells. All data represent mean ± s.e.m. Statistical significance was assessed using two-tailed Student’s t-tests. A p<0.05 (*) was considered significant.
To determine whether FOXQ1 interacts with β-catenin and/or TLE proteins, empty vector or FLAG-FOXQ1-expressing vector were transduced into SK-Mel-147 cells followed by preparation of nuclear extracts and immunoprecipitation with FLAG-specific antibodies. The precipitated materials were probed in immunoblotting with β-catenin or pan-TLE antibodies (Figure 4C). We detected a substantial enrichment of endogenous β-catenin and TLE proteins in material precipitated with FLAG antibodies from FLAG-FOXQ1-expressing cells compared to control cells (Figure 4C). Reciprocally, materials co-precipitated with endogenous β-catenin or TLE proteins from nuclear extracts of FLAG-FOXQ1-expressing cells were enriched with FOXQ1 as compared to materials precipitated with IgG (Figure 4D,E). In addition, we observed similar results with regard to FOXQ1 interaction with β-catenin and TLEs in transient co-transfection experiments in HEK293T cells (Figure S4BC).
To assess interactions between endogenous FOXQ1, β-catenin and TLEs proteins, we performed reciprocal co-immunoprecipitations with control IgG antibodies or antibodies specific to the above proteins from nuclear extracts of SCOV3 cells. We demonstrated that similarly to exogenously expressed FOXQ1 in melanoma cells, endogenous FOXQ1 co-immunoprecipitated β-catenin and TLEs in carcinoma cells (Figure 4F–H).
To confirm that FOXQ1 recruits β-catenin and/or TLE to CDH2 promoter we performed ChIP in SK-Mel-147-FLAG-FOXQ1 cells using FLAG or TLE antibodies, and in uninfected SCOV3 cells using FOXQ1 or β-catenin antibodies. IgG antibodies were used as a negative control. As shown in Figure 4I, DNA regions containing FOXQ1 binding sites in CDH2 promoter were enriched in the material precipitated with FLAG or TLE antibodies in melanoma cells and with FOXQ1 or β-catenin antibodies in carcinoma cells.
Next, to determine whether β-catenin affects TLE binding to CDH2 promoter in melanoma cells, we performed ChIP with IgG, FLAG, β-catenin and TLEs antibodies in SK-Mel-147 cells overexpressing FLAG-FOXQ1 alone or in combination with EβP. As shown in Figure 4j, DNA regions containing FOXQ1 binding sites in CDH2 promoter were enriched in material precipitated with FLAG or TLE antibodies (but not control IgG). Overexpression of EβP in these cells resulted in increased enrichment of CDH2 DNA in material precipitated with β-catenin antibodies, did not affect such enrichment in materials precipitated FLAG-antibodies (i.e. FOXQ1), but decreased the CDH2 DNA enrichment in materials precipitated with TLE antibodies. We therefore concluded that β-catenin does not affect FOXQ1 DNA binding but decreases TLE DNA binding presumably via disrupting FOXQ1/TLE interactions, and ultimately leading to alleviation of CDH2 transcriptional repression.
Taken together, these results strongly argue for FOXQ1 physical interactions with β-catenin and TLE proteins.
FOXQ1 inhibits melanoma cell invasion mainly via repression of CDH2
We were interested in whether other genes involved in invasion-associated processes are controlled by FOXQ1 in melanoma and carcinoma cells similarly to CDH2. To this end, we performed RNA-Seq analysis in SK-Mel-147 and SCOV3 cells transduced with empty or FOXQ1-expressing vectors. We identified 784 genes that were suppressed by FOXQ1 at least 1.5 fold in melanoma cells and at the same time upregulated by FOXQ1 at least 1.5 fold in carcinoma cells (19.4% of all FOXQ1-suppressed genes in melanoma cells and 9.4% of all FOXQ1-upregulated genes in carcinoma cells, respectively). This gene list was overlapped with the list of β-catenin target genes identified via ChIP-Seq methodology (Sequence Read Archive: SRA012054). Thus, 36 genes were identified, 13 of which have been previously reported to increase invasion-associated phenotypes in carcinoma cells (Supplemental Table 1). For each of these 13 genes, we identified FOXQ1-dependent activation in SCOV3 cells and FOXQ1-dependent suppression in SK-Mel-147 via Q-RT-PCR (Figure S4D).
The above data suggest that FOXQ1-dependent invasion in melanoma cells could be mediated by multiple genes. Therefore, we wanted to establish an individual role of CDH2 in FOXQ1-dependent regulation of invasion. To this end, we ectopically expressed CDH2 cDNA in SK-Mel-103 and SK-Mel-147 cells via lentiviral infection achieving ~2 fold increase in the total amounts of N-cadherin. These cells were super-infected with empty vector or a FOXQ1 cDNA expressing vector (Figure 4K). Restoration of N-cadherin levels in FOXQ1-expressing melanoma cells abrogated the ability of FOXQ1 to suppress invasion by ~50%–70% (Figure 4LM), suggesting that downregulation of N-cadherin mediates in large part the invasion-suppressing activity of FOXQ1.
β-Catenin and TLEs determine the mode of FOXQ1-dependent regulation of CDH2
To evaluate the role of β-catenin in FOXQ1-dependent regulation of CDH2 gene in melanoma cells, we increased the nuclear levels of β-catenin in SK-Mel-103 and SK-Mel-147 cells via lentivirus-based expression of constitutively active S33Y β-catenin mutant (EβP). The obtained cell populations were super-infected with control or FOXQ1-containing lentiviral vectors, followed by assessment of CDH2 mRNA and protein levels. Expression of EβP in SK-Mel-103 and SK-Mel-147 melanoma cells prevented FOXQ1-mediated repression of CDH2 mRNA and protein levels (Figure 5AB).
Figure 5. FOXQ1 regulates CDH2, invasion and metastasis in a β-catenin-dependent manner.
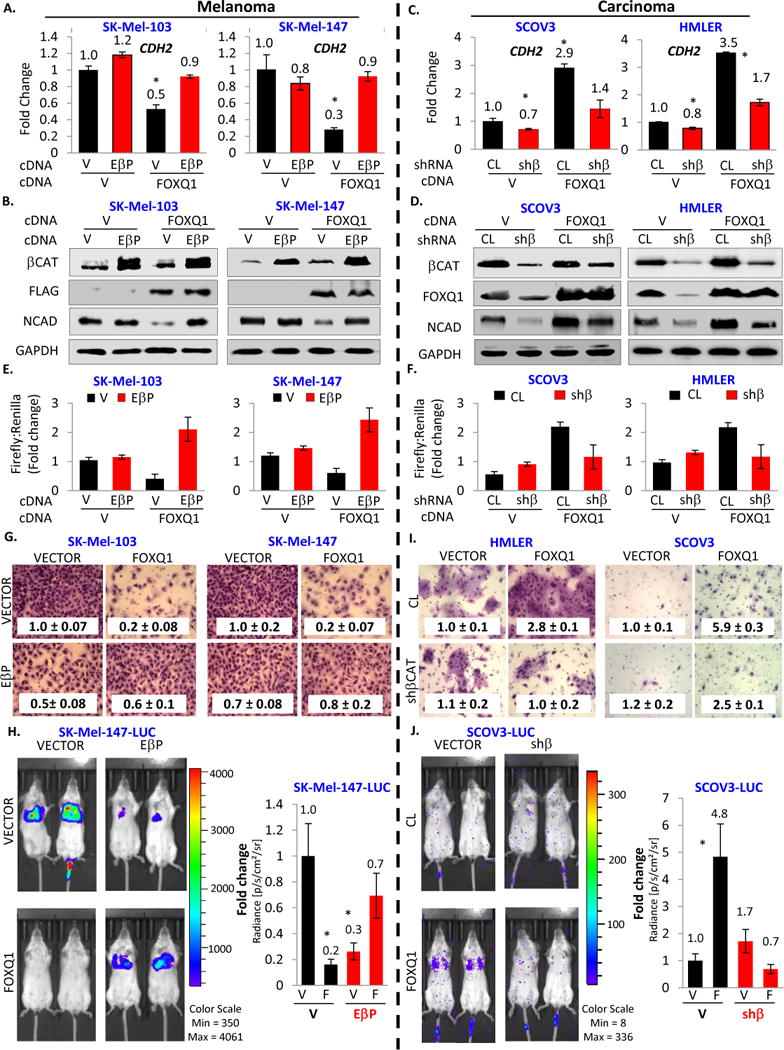
A. Melanoma cells were transduced with indicated constructs (V=empty vector, EβP=constitutively active β-catenin, shβ=β-catenin shRNA), followed by probing in Q-RT-PCR. Shown are CDH2/ACTB ratios normalized to the same in the cells transduced with empty vector. B. Cells described in (A) were probed in immunoblotting with the indicated antibodies. C–D. Carcinoma cells were treated like melanoma cells in (A–B). E–F. Indicated cells described in (A) or (C) were co-transfected with the mixture of pGL3-CDH2 and renilla-expressing vector or pGL3-control and renilla-expressing vector, followed by luciferase reporter assay. G. Melanoma cells described in (A) were probed in invasion assay (representative chamber images are shown). Numbers correspond to invasion indexes. All indexes were normalized by the same in “vector-vector” cells. H. Melanoma cells stably expressing luciferase were transduced with the indicated constructs, tail-vein injected into SCID mice. Mice injected with the same types of cells were simultaneously imaged 2–4 weeks post-injection and quantified for tumor burden. I. Carcinoma cells described in (C) were probed in invasion assay (representative chamber images are shown). Numbers correspond to invasion indexes. All indexes were normalized by the same in “vector-vector” cells. J. Carcinoma cells stably expressing luciferase were transduced with the indicated constructs, tail-vein injected into SCID mice (n=5 mice). Mice injected with the same types of cells were simultaneously imaged 2–4 weeks post-injection and quantified for tumor burden. All data represent mean ± s.e.m. Statistical significance was assessed using two-tailed Student’s t-tests. A p<0.05 (*) was considered significant.
In parallel, we performed experiments in HMLER and SCOV3 cells, where shRNA-mediated depletion of β-catenin was carried out with concomitant FOXQ1 overexpression. Depletion of β-catenin decreased endogenous FOXQ1 (in agreement with previously published data (Christensen et al., 2013; Peng et al., 2015)) and N-cadherin levels (Figure 5CD). Importantly, ectopic expression of FOXQ1, while compensating for downregulation of endogenous FOXQ1, was still unable to significantly upregulate N-cadherin levels when β-catenin was depleted (Figure 5CD) further supporting our model. Similarly, opposite results with regard to FOXQ1 regulation of CDH2 in melanoma and carcinoma cells were obtained in luciferase reporter assay using the control and CDH2 promoter-containing pGL3 vectors (Figure 5EF).
β-Catenin regulates FOXQ1-dependent invasion and metastasis
To determine whether β-catenin affects FOXQ1-dependent suppression of invasion, vector or EβP-expressing SK-Mel-103 and SK-Mel-147 cells were super-infected with control or FOXQ1-containing lentiviral vectors followed by assessment of invasion potential (Figure 5G).
Interestingly, ectopic expression of activated β-catenin by itself suppressed invasion in melanoma cells by 30%–50% (Figure 5G). This was in agreement with previous reports on β-catenin invasion-inhibiting activity in melanoma cells (Domingues et al., 2017; Domingues et al., 2014; Rambow et al., 2016). On the other hand, co-expression of FOXQ1 and EβP negated each other invasion-suppressing activities (Figure 5G). The ability of FOXQ1 to suppress invasion (and N-cadherin levels) was also blunted by siRNA-mediated depletion of TLE proteins (Figure S5AB) further supporting our model of FOXQ1 function in melanoma cells.
To establish whether the FOXQ1-dependent control of metastatic potential in melanoma cells is also affected by β-catenin, SK-Mel-147-Luc cells were transduced with the following combination of vectors: two empty vectors, vector and FOXQ1, vector and EβP, or EβP and FOXQ1, and injected via the tail vein into SCID mice. The animals were monitored for luciferase activity using the IVIS® imaging platform. FOXQ1-expressing melanoma cells demonstrated suppressed metastasis compared to empty-vector cells (Figure 5H). Similar to invasion assay, EβP suppressed experimental metastasis of SK-Mel-147-Luc cells, but reverted the suppression of metastasis by FOXQ1 (Figure 5H). Therefore, our data strongly suggest that although β-catenin demonstrates tumor-suppressive function in melanoma cells, it abolishes tumor suppressor activity of FOXQ1.
In parallel, using a similar experimental design, we performed a reciprocal set of experiments in HMLER and SCOV3 carcinoma cells. β-catenin depletion blunted FOXQ1-dependent induction of invasion and experimental metastasis in studied carcinoma cells (Figure 5IJ).
Cumulatively, our data demonstrate that FOXQ1 represses CDH2 transcription, invasion and metastasis in the absence of nuclear β-catenin in melanoma cells, whereas FOXQ1-dependent transcriptional induction of CDH2, invasion and metastasis requires activated β-catenin in carcinoma cells.
DISCUSSION
Melanoma cells with low or undetectable MITF levels comprise a prominent portion of human melanoma specimens. Understanding the mechanisms governing invasion of these cells is important for identification of novel melanoma targets. We demonstrate that in contrast to carcinoma cells, FOXQ1 acts as a tumor suppressor in all tested melanoma cells including those with undetectable MITF levels (SK-Mel-103, −147). These cells represent an excellent model for studying still poorly understood MITF-independent pathways controlling the EMT-like switch occurring in melanoma.
Several papers reported that carcinoma oncogenic EMT-TFs, SNAI2 and ZEB2, behave as tumor suppressors in melanoma cells specifically via stimulation of MITF-dependent differentiation programs (Caramel et al., 2013; Denecker et al., 2014). Our data reveal that the EMT-suppressing activities of FOXQ1 in melanoma cells rely in large part on its MITF-independent ability to repress transcription of the CDH2 (N-cadherin) gene. Thus, unlike SNAI2 and ZEB2, the distinguishing feature of FOXQ1 tumor suppressor/oncogenic activity is that it depends on inverse regulation of the same gene in different lineage-specific contexts.
In search for nuclear determinants of the lineage-specific difference in FOXQ1 regulation of CDH2, we turned to β-catenin, a multifunctional protein that plays a role in cell-cell adhesion and in activation of transcription. Our data on physical interactions among FOXQ1, β-catenin, and TLE proteins in conjunction with functional interactions between FOXQ1 and β-catenin argue, for the first time, that the mode of transcriptional regulation by FOXQ1 depends on nuclear β-catenin.
Importantly, unlike in carcinomas where activation of the Wnt/β-catenin pathway is associated with increased tumorigenesis and decreased patient survival (Kahn, 2014; Novellasdemunt et al., 2015), in melanomas the role of β-catenin is controversial (Kuphal and Bosserhoff, 2011; Webster et al., 2015). The majority of studies have reported that nuclear β–catenin levels decrease in metastatic melanoma specimen and cell lines (Bachmann et al., 2005; Kuphal and Bosserhoff, 2011). It is also well established that β–catenin signaling in melanoma cells suppresses cell migration and/or invasion (Arozarena et al., 2011; Chien et al., 2009; Domingues et al., 2014). This phenomenon is attributed mostly to the β-catenin-mediated transcriptional activation of the MITF gene (Arozarena et al., 2011; Gallagher et al., 2013; Widlund et al., 2002), although MITF-independent suppression of melanoma cell migration by β-catenin has also been reported (Gallagher et al., 2013).
Our data suggest that loss of β-catenin in the course of melanoma progression should associate with the decrease in the levels of FOXQ1, which otherwise, in the absence of β-catenin, would suppress melanomagenesis. Since FOXQ1 has been reported as β-catenin transcriptional target (Peng et al., 2013) at least in carcinoma cells the above scenario appears to be likely.
Despite multiple FOXQ1-responsive genes undergoing CDH2-like regulation in melanoma and carcinoma cells, suppression of CDH2 alone is in large part responsible for invasion inhibition by FOXQ1 as was evidenced by N-cadherin reconstitution experiments (Figure 4K–M). Direct transcriptional upregulation of CDH2 and/or suppression of CDH1 (E-cadherin) are considered the major events in promotion of EMT and invasion by several EMT transcription factors other than FOXQ1 such as TWIST1 and ZEB2 (Heerboth et al., 2015; Kalluri and Weinberg, 2009; Lamouille et al., 2014; Nieto et al., 2016). However, FOXQ1 did not alter TWIST1 or ZEB2, whereas E-cadherin did not express in studied cells (Figure 3A). Thus, the above factors are unlikely to account for FOXQ1-dependent suppression of invasion in melanoma cells.
Taken together our data provide a mechanistic explanation to the opposite roles of FOXQ1 in regulation of CDH2 gene, invasion and metastasis in melanoma versus carcinoma cells and reveal a novel interplay between FOXQ1 and β-catenin, two nuclear factors negating each other’s tumor suppressor activity in melanoma cells while enhancing each other’s oncogenic properties in carcinoma cells.
EXPERIMENTAL PROCEDURES
Cell culture
Melanoma cell lines SK-Mel-19, −28, −29, −94, −103, −147, −173, G-361 were obtained from Memorial Sloan Kettering Cancer Center and cultured in Dulbecco’s modified Eagle’s medium supplemented with 10% fetal bovine serum, 2mM glutamine, and 1% penicillin-streptomycin antibiotics. Populations of normal human melanocytes (NHM) were purchased from Invitrogen and maintained in Medium 254 (Invitrogen) supplemented with human melanocyte growth supplement (Invitrogen). Colo679, UACC-257, WM1366, SCOV3 and HeLa were purchased from ATCC. HMLE and HMLER cells were a gift from Dr. Robert A Weinberg (Whitehead Institute). Melan-a mouse melanocytes were grown at 37°C (10% CO2) in RPMI media containing 12-O-Tetradecanoylphorbol-13-acetate (TPA).
Immunohistochemistry
The study was approved by the Roswell Park Cancer Institute Institutional Review Board. Patients included in the study were diagnosed with melanoma at Roswell Park Cancer Institute (RPCI). Specimens were scored for intensity and percentage of stained cells by a board-certified pathologist. An IHC H-score was calculated as a product of these parameters. See supplementary information for details.
Reverse Transcription-PCR Analysis
Total RNA was isolated from cells using the RNeasy Mini Kit (Qiagen, Valencia, CA, USA). cDNA was prepared using cDNA reverse transcription kit (Invitrogen). Quantitative reverse transcription–PCR was performed using 7900HT Fast Real-Time PCR System (Applied Biosystems, Carlsbad, CA, USA) using SYBr GreenMaster Mix (Invitrogen). See Supplemental Table 2 for primer sequences.
Immunoblotting
PVDF membranes were developed using alkaline phosphatase-conjugated secondary antibodies and signals were detected and visualized using the Alpha-Innotech FluorChem HD2 imaging system (Alpha Innotech) and quantified using ImageQuant software (GE Healthcare Life Sciences). For a detailed list of antibodies see SI.
Statistical Analysis
Each experiment was performed at least two times with consistent results. For in vitro studies, statistical significance was determined using Student’s t test. A two-tailed p-value was considered significant for all analyses. For animal studies, sample size was determined as a function of effect size ((difference in means)/(standard deviation)=2.0) for a two-sample t-test comparison assuming a significance level of 5%, a power of 90% and a two-sided t-test. Normal distribution was confirmed using normal probability plot (GraphPad Prism 6.0, Graphpad Software, Inc., San Diego, CA, USA), variance was also assessed using GraphPad Prism 6.0 both within and between groups and were approximately the same. For statistically analysis of immunohistological scores, an unpaired student-t test was used and a value of p≤0.05 was considered statistically significant.
Supplementary Material
Supplemental Figure S1. FOXQ1 levels decrease in melanoma progression
A. Representative IHC images of FOXQ1 staining in primary and metastatic melanoma samples. See Methods for sample description and analysis. B. Expression levels of FOXQ1 (probe ID shown) in tissue specimens representing different stages of melanoma progression derived from the publically available dataset GSE4587.
Supplemental Figure S2. FOXQ1 induces transformed phenotypes in carcinoma cells
A. Cells were transduced with the indicated constructs, followed by immunoblotting with the indicated antibodies. B. Representative images of cells described in (A) after completion of Boyden invasion chambers assay. C. Quantification of invasion assay in (B). D. Cells described in (A) were counted on indicated days starting 48hrs after infection. E. Cells described in (A) were subjected to tumorigenicity assay in SCID mice, (n=5, two injection sites per mouse). Tumor measurements were done at indicated days post-injection. F. SCOV3LUC and HMLERLUC cells stably expressing luciferase were transduced with the indicated constructs and injected via the tail-vein (1×10⁶ cells) into SCID mice (n=6 per cell line). Three weeks later mice were subjected to bioluminescence detection using the IVIS imaging platform. Representative mice are shown. G. Total metastatic burden was measured using IVIS and analyzed. All data represent mean ± s.e.m. Statistical significance was assessed using two-tailed Student’s t-tests. A p<0.05 (*) was considered significant.
Supplemental Figure S3. FOXQ1 differentially regulates CDH2 in melanoma and carcinoma cells
A. Cells were probed in immunoblotting with the indicated antibodies. B. Cells transduced with empty vector (V) of FOXQ1-expressing vector FOXQ1 (F) were probed in Q-RT-PCR. Shown are CDH2/ACTB ratios in F-cells normalized to the same in V-cells. C–D. Cells were transduced with empty vector (V), FOXQ1 expressing vector (F), control shRNA (CL) or FOXQ1 shRNAs (F1, F2) and probed in immunoblotting with the indicated antibodies. E. Cells were transduced with control shRNA (CL) or MITF shRNAs (M1, M2) followed by superinfection with empty vector or FOXQ1-expressing vector. Cells were probed in immunoblotting with the indicated antibodies. F. Cells described in (E) were assayed for invasion in Boyden chambers followed by calculation of invasion indexes. Shown are invasion indexes in CL-FOXQ1, M1-FOXQ1 and M2-FOXQ1 cells normalized by that in CL-Vector, M1-Vector and M2-Vector cells, respectively. Note, that FOXQ1 continues to suppress invasion in MITF-depleted cells. All data represent mean ± s.e.m. Statistical significance was assessed using two-tailed Student’s t-tests. A p<0.05 (*) was considered significant.
Supplemental Figure S4. FOXQ1 interacts with β-catenin/TLE proteins
A. Indicated cells were probed in immunoblotting with indicated antibodies. B. HEK293T cells were transfected with empty vector (V) or FLAG-FOXQ1-expressing vector (F), followed by preparation of nuclear extracts, immunoprecipitation with FLAG antibodies and probing in immunoblotting with the indicated antibodies. C. HEK293T cells were transfected with a mixture of TLE1-4 cDNAs (TLE) or EβP, followed by preparation of nuclear extracts, immunoprecipitation with IgG, pan-TLE (T) or β-catenin (β) antibodies and probing in immunoblotting with the indicated antibodies. D. SCOV3 cells (top) and SK-Mel-147 cells (bottom) were transduced with empty vector or FOXQ1-expressing vector and probed in Q-RT-PCR. Shown are ratios of a gene-specific signal to ACTB-specific signal in FOXQ1-expressing cells normalized to the same in cells transduced with empty vector
Supplemental Figure S5. TLE depletion counteracts FOXQ1-dependent suppression of N-cadherin and invasion
A. Cells transduced with empty vector (Vector) or FOXQ1-expressing vector (FOXQ1) were transfected with control siRNA (CL) or mixture of siRNAs against TLE-1, −2, −3, and −4 (siTLE). Cells were probed in immunoblotting with the indicated antibodies. B. Cells described in (A) were probed in invasion assay. Shown are invasion indexes of cells described in (A) normalized by the same in vector cells.
Acknowledgments
We are grateful to Dr. Smiraglia for critical reading of the manuscript, to the Pathology Resource Network, the Clinical Data Network, and the transgenic shared core facility (funded by NCI P30CA16056) at Roswell Park Cancer Institute. This work has been supported by the following NCI grants: CA190533, CA193981, CA202162.
Footnotes
Author contributions
AB and MAN designed the experiments and wrote the manuscript. AB, SM, AB-S, KK, BCL, MK, EEF, PJ, AP, AM, JR, JAW, DHY, JB, SL performed experiments and analyzed the data; SL, GP, MJN advised on the experiments, MAN designed the experiments, analyzed the data and supervised the study. All authors discussed the results and commented on the manuscript.
References
- Alonso SR, Tracey L, Ortiz P, Pérez-Gómez B, Palacios J, Pollán M, Linares J, Serrano S, Sáez-Castillo AI, Sánchez L, et al. A High-Throughput Study in Melanoma Identifies Epithelial-Mesenchymal Transition as a Major Determinant of Metastasis. Cancer Research. 2007;67:3450–3460. doi: 10.1158/0008-5472.CAN-06-3481. [DOI] [PubMed] [Google Scholar]
- Arozarena I, Bischof H, Gilby D, Belloni B, Dummer R, Wellbrock C. In melanoma, beta-catenin is a suppressor of invasion. Oncogene. 2011;30:4531–4543. doi: 10.1038/onc.2011.162. [DOI] [PMC free article] [PubMed] [Google Scholar]
- Bachmann IM, Straume O, Puntervoll HE, Kalvenes MB, Akslen LA. Importance of P-Cadherin, β-Catenin, and Wnt5a/Frizzled for Progression of Melanocytic Tumors and Prognosis in Cutaneous Melanoma. Clinical Cancer Research. 2005;11:8606–8614. doi: 10.1158/1078-0432.CCR-05-0011. [DOI] [PubMed] [Google Scholar]
- Bianchi-Smiraglia A, Bagati A, Fink EE, Moparthy S, Wawrzyniak JA, Marvin EK, Battaglia S, Jowdy P, Kolesnikova M, Foley CE, et al. Microphthalmia-associated transcription factor suppresses invasion by reducing intracellular GTP pools. Oncogene. 2016 doi: 10.1038/onc.2016.178. [DOI] [PMC free article] [PubMed] [Google Scholar]
- Biechele TL, Kulikauskas RM, Toroni RA, Lucero OM, Swift RD, James RG, Robin NC, Dawson DW, Moon RT, Chien AJ. Wnt/beta-catenin signaling and AXIN1 regulate apoptosis triggered by inhibition of the mutant kinase BRAFV600E in human melanoma. Sci Signal. 2012;5:ra3. doi: 10.1126/scisignal.2002274. [DOI] [PMC free article] [PubMed] [Google Scholar]
- Caramel J, Papadogeorgakis E, Hill L, Browne Gareth J, Richard G, Wierinckx A, Saldanha G, Osborne J, Hutchinson P, Tse G, et al. A Switch in the Expression of Embryonic EMT-Inducers Drives the Development of Malignant Melanoma. Cancer Cell. 2013;24:466–480. doi: 10.1016/j.ccr.2013.08.018. [DOI] [PubMed] [Google Scholar]
- Carreira S, Goodall J, Denat L, Rodriguez M, Nuciforo P, Hoek KS, Testori A, Larue L, Goding CR. Mitf regulation of Dia1 controls melanoma proliferation and invasiveness. Genes & development. 2006a;20:3426–3439. doi: 10.1101/gad.406406. [DOI] [PMC free article] [PubMed] [Google Scholar]
- Carreira S, Goodall J, Denat L, Rodriguez M, Nuciforo P, Hoek KS, Testori A, Larue L, Goding CR. Mitf regulation of Dia1 controls melanoma proliferation and invasiveness. Genes & development. 2006b;20:3426–3439. doi: 10.1101/gad.406406. [DOI] [PMC free article] [PubMed] [Google Scholar]
- Chien AJ, Moore EC, Lonsdorf AS, Kulikauskas RM, Rothberg BG, Berger AJ, Major MB, Hwang ST, Rimm DL, Moon RT. Activated Wnt/ß-catenin signaling in melanoma is associated with decreased proliferation in patient tumors and a murine melanoma model. Proceedings of the National Academy of Sciences. 2009;106:1193–1198. doi: 10.1073/pnas.0811902106. [DOI] [PMC free article] [PubMed] [Google Scholar]
- Christensen J, Bentz S, Sengstag T, Shastri VP, Anderle P. FOXQ1, a novel target of the Wnt pathway and a new marker for activation of Wnt signaling in solid tumors. PLoS One. 2013;8:e60051. doi: 10.1371/journal.pone.0060051. [DOI] [PMC free article] [PubMed] [Google Scholar]
- Daniels DL, Weis WI. Beta-catenin directly displaces Groucho/TLE repressors from Tcf/Lef in Wnt-mediated transcription activation. Nature structural & molecular biology. 2005;12:364–371. doi: 10.1038/nsmb912. [DOI] [PubMed] [Google Scholar]
- Denecker G, Vandamme N, Akay O, Koludrovic D, Taminau J, Lemeire K, Gheldof A, De Craene B, Van Gele M, Brochez L, et al. Identification of a ZEB2-MITF-ZEB1 transcriptional network that controls melanogenesis and melanoma progression. Cell death and differentiation. 2014;21:1250–1261. doi: 10.1038/cdd.2014.44. [DOI] [PMC free article] [PubMed] [Google Scholar]
- Domingues MJ, Martinez-Sanz J, Papon L, Larue L, Mouawad L, Bonaventure J. Structure-based mutational analysis of ICAT residues mediating negative regulation of beta-catenin co-transcriptional activity. 2017;12:e0172603. doi: 10.1371/journal.pone.0172603. [DOI] [PMC free article] [PubMed] [Google Scholar]
- Domingues MJ, Rambow F, Job B, Papon L, Liu W, Larue L, Bonaventure J. beta-catenin inhibitor ICAT modulates the invasive motility of melanoma cells. Cancer Res. 2014;74:1983–1995. doi: 10.1158/0008-5472.CAN-13-0920. [DOI] [PubMed] [Google Scholar]
- Gallagher SJ, Rambow F, Kumasaka M, Champeval D, Bellacosa A, Delmas V, Larue L. Beta-catenin inhibits melanocyte migration but induces melanoma metastasis. Oncogene. 2013;32:2230–2238. doi: 10.1038/onc.2012.229. [DOI] [PMC free article] [PubMed] [Google Scholar]
- Garraway LA, Widlund HR, Rubin MA, Getz G, Berger AJ, Ramaswamy S, Beroukhim R, Milner DA, Granter SR, Du J, et al. Integrative genomic analyses identify MITF as a lineage survival oncogene amplified in malignant melanoma. Nature. 2005;436:117–122. doi: 10.1038/nature03664. [DOI] [PubMed] [Google Scholar]
- Hartman ML, Czyz M. MITF in melanoma: mechanisms behind its expression and activity. Cellular and Molecular Life Sciences. 2015;72:1249–1260. doi: 10.1007/s00018-014-1791-0. [DOI] [PMC free article] [PubMed] [Google Scholar]
- Heerboth S, Housman G, Leary M, Longacre M, Byler S, Lapinska K, Willbanks A, Sarkar S. EMT and tumor metastasis. Clinical and Translational Medicine. 2015;4:6. doi: 10.1186/s40169-015-0048-3. [DOI] [PMC free article] [PubMed] [Google Scholar]
- Hoek KS, Eichhoff OM, Schlegel NC, Döbbeling U, Kobert N, Schaerer L, Hemmi S, Dummer R. Switching of Human Melanoma Cells between Proliferative and Invasive States. Cancer Research. 2008;68:650–656. doi: 10.1158/0008-5472.CAN-07-2491. [DOI] [PubMed] [Google Scholar]
- Kahn M. Can we safely target the WNT pathway? Nat Rev Drug Discov. 2014;13:513–532. doi: 10.1038/nrd4233. [DOI] [PMC free article] [PubMed] [Google Scholar]
- Kalluri R, Weinberg RA. The basics of epithelial-mesenchymal transition. The Journal of Clinical Investigation. 2009;119:1420–1428. doi: 10.1172/JCI39104. [DOI] [PMC free article] [PubMed] [Google Scholar]
- Kuphal S, Bosserhoff AK. Phosphorylation of beta-catenin results in lack of beta-catenin signaling in melanoma. International journal of oncology. 2011;39:235–243. doi: 10.3892/ijo.2011.1028. [DOI] [PubMed] [Google Scholar]
- Lamouille S, Xu J, Derynck R. Molecular mechanisms of epithelial–mesenchymal transition. Nat Rev Mol Cell Biol. 2014;15:178–196. doi: 10.1038/nrm3758. [DOI] [PMC free article] [PubMed] [Google Scholar]
- Li FZ, Dhillon AS, Anderson RL, McArthur G, Ferrao PT. Phenotype Switching in Melanoma: Implications for Progression and Therapy. Frontiers in Oncology. 2015;5:31. doi: 10.3389/fonc.2015.00031. [DOI] [PMC free article] [PubMed] [Google Scholar]
- Li Y, Zhang Y, Yao Z, Li S, Yin Z, Xu M. Forkhead box Q1: A key player in the pathogenesis of tumors (Review) International journal of oncology. 2016;49:51–58. doi: 10.3892/ijo.2016.3517. [DOI] [PubMed] [Google Scholar]
- Nieto MA, Huang Ruby Y-J, Jackson Rebecca A, Thiery Jean P. EMT: 2016. Cell. 2016;166:21–45. doi: 10.1016/j.cell.2016.06.028. [DOI] [PubMed] [Google Scholar]
- Novellasdemunt L, Antas P, Li VSW. Targeting Wnt signaling in colorectal cancer. A Review in the Theme: Cell Signaling: Proteins, Pathways and Mechanisms. American Journal of Physiology - Cell Physiology. 2015;309:C511–C521. doi: 10.1152/ajpcell.00117.2015. [DOI] [PMC free article] [PubMed] [Google Scholar]
- Peng X, Luo Z, Kang Q, Deng D, Wang Q, Peng H, Wang S, Wei Z. FOXQ1 mediates the crosstalk between TGF-beta and Wnt signaling pathways in the progression of colorectal cancer. Cancer biology & therapy. 2015;16:1099–1109. doi: 10.1080/15384047.2015.1047568. [DOI] [PMC free article] [PubMed] [Google Scholar]
- Rambow F, Bechadergue A, Luciani F, Gros G, Domingues M, Bonaventure J, Meurice G, Marine JC, Larue L. Regulation of Melanoma Progression through the TCF4/miR-125b/NEDD9 Cascade. J Invest Dermatol. 2016;136:1229–1237. doi: 10.1016/j.jid.2016.02.803. [DOI] [PubMed] [Google Scholar]
- Roose J, Molenaar M, Peterson J, Hurenkamp J, Brantjes H, Moerer P, van de Wetering M, Destree O, Clevers H. The Xenopus Wnt effector XTcf-3 interacts with Groucho-related transcriptional repressors. Nature. 1998;395:608–612. doi: 10.1038/26989. [DOI] [PubMed] [Google Scholar]
- Salti GI, Manougian T, Farolan M, Shilkaitis A, Majumdar D, Das Gupta TK. Micropthalmia transcription factor: a new prognostic marker in intermediate-thickness cutaneous malignant melanoma. Cancer Res. 2000;60:5012–5016. [PubMed] [Google Scholar]
- Schadendorf D, Fisher DE, Garbe C, Gershenwald JE, Grob JJ, Halpern A, Herlyn M, Marchetti MA, McArthur G, Ribas A, et al. Melanoma. Nature Reviews Disease Primers. 2015;1:15003. doi: 10.1038/nrdp.2015.3. [DOI] [PubMed] [Google Scholar]
- Selzer E, Wacheck V, Lucas T, Heere-Ress E, Wu M, Weilbaecher KN, Schlegel W, Valent P, Wrba F, Pehamberger H, et al. The melanocyte-specific isoform of the microphthalmia transcription factor affects the phenotype of human melanoma. Cancer Res. 2002;62:2098–2103. [PubMed] [Google Scholar]
- Shain AH, Bastian BC. From melanocytes to melanomas. Nat Rev Cancer. 2016 doi: 10.1038/nrc.2016.37. advance online publication. [DOI] [PubMed] [Google Scholar]
- Smith AP, Hoek K, Becker D. Whole-genome expression profiling of the melanoma progression pathway reveals marked molecular differences between nevi/melanoma in situ and advanced-stage melanomas. Cancer biology & therapy. 2005;4:1018–1029. doi: 10.4161/cbt.4.9.2165. [DOI] [PubMed] [Google Scholar]
- Tulchinsky E, Pringle JH, Caramel J, Ansieau S. Plasticity of melanoma and EMT-TF reprogramming. Oncotarget. 2014;5:1–2. doi: 10.18632/oncotarget.1662. [DOI] [PMC free article] [PubMed] [Google Scholar]
- Webster MR, Kugel CH, III, Weeraratna AT. The Wnts of change: How Wnts regulate phenotype switching in melanoma. Biochimica et Biophysica Acta (BBA) - Reviews on Cancer. 2015;1856:244–251. doi: 10.1016/j.bbcan.2015.10.002. [DOI] [PMC free article] [PubMed] [Google Scholar]
- Wellbrock C, Marais R. Elevated expression of MITF counteracts B-RAF–stimulated melanocyte and melanoma cell proliferation. The Journal of Cell Biology. 2005;170:703–708. doi: 10.1083/jcb.200505059. [DOI] [PMC free article] [PubMed] [Google Scholar]
- Wheelock MJ, Shintani Y, Maeda M, Fukumoto Y, Johnson KR. Cadherin switching. Journal of Cell Science. 2008;121:727–735. doi: 10.1242/jcs.000455. [DOI] [PubMed] [Google Scholar]
- Widlund HR, Horstmann MA, Price ER, Cui J, Lessnick SL, Wu M, He X, Fisher DE. β-Catenin–induced melanoma growth requires the downstream target. The Journal of Cell Biology. 2002;158:1079–1087. doi: 10.1083/jcb.200202049. [DOI] [PMC free article] [PubMed] [Google Scholar]
- Zhang H, Meng F, Liu G, Zhang B, Zhu J, Wu F, Ethier SP, Miller F, Wu G. Forkhead transcription factor foxq1 promotes epithelial-mesenchymal transition and breast cancer metastasis. Cancer Res. 2011;71:1292–1301. doi: 10.1158/0008-5472.CAN-10-2825. [DOI] [PMC free article] [PubMed] [Google Scholar]
Associated Data
This section collects any data citations, data availability statements, or supplementary materials included in this article.
Supplementary Materials
Supplemental Figure S1. FOXQ1 levels decrease in melanoma progression
A. Representative IHC images of FOXQ1 staining in primary and metastatic melanoma samples. See Methods for sample description and analysis. B. Expression levels of FOXQ1 (probe ID shown) in tissue specimens representing different stages of melanoma progression derived from the publically available dataset GSE4587.
Supplemental Figure S2. FOXQ1 induces transformed phenotypes in carcinoma cells
A. Cells were transduced with the indicated constructs, followed by immunoblotting with the indicated antibodies. B. Representative images of cells described in (A) after completion of Boyden invasion chambers assay. C. Quantification of invasion assay in (B). D. Cells described in (A) were counted on indicated days starting 48hrs after infection. E. Cells described in (A) were subjected to tumorigenicity assay in SCID mice, (n=5, two injection sites per mouse). Tumor measurements were done at indicated days post-injection. F. SCOV3LUC and HMLERLUC cells stably expressing luciferase were transduced with the indicated constructs and injected via the tail-vein (1×10⁶ cells) into SCID mice (n=6 per cell line). Three weeks later mice were subjected to bioluminescence detection using the IVIS imaging platform. Representative mice are shown. G. Total metastatic burden was measured using IVIS and analyzed. All data represent mean ± s.e.m. Statistical significance was assessed using two-tailed Student’s t-tests. A p<0.05 (*) was considered significant.
Supplemental Figure S3. FOXQ1 differentially regulates CDH2 in melanoma and carcinoma cells
A. Cells were probed in immunoblotting with the indicated antibodies. B. Cells transduced with empty vector (V) of FOXQ1-expressing vector FOXQ1 (F) were probed in Q-RT-PCR. Shown are CDH2/ACTB ratios in F-cells normalized to the same in V-cells. C–D. Cells were transduced with empty vector (V), FOXQ1 expressing vector (F), control shRNA (CL) or FOXQ1 shRNAs (F1, F2) and probed in immunoblotting with the indicated antibodies. E. Cells were transduced with control shRNA (CL) or MITF shRNAs (M1, M2) followed by superinfection with empty vector or FOXQ1-expressing vector. Cells were probed in immunoblotting with the indicated antibodies. F. Cells described in (E) were assayed for invasion in Boyden chambers followed by calculation of invasion indexes. Shown are invasion indexes in CL-FOXQ1, M1-FOXQ1 and M2-FOXQ1 cells normalized by that in CL-Vector, M1-Vector and M2-Vector cells, respectively. Note, that FOXQ1 continues to suppress invasion in MITF-depleted cells. All data represent mean ± s.e.m. Statistical significance was assessed using two-tailed Student’s t-tests. A p<0.05 (*) was considered significant.
Supplemental Figure S4. FOXQ1 interacts with β-catenin/TLE proteins
A. Indicated cells were probed in immunoblotting with indicated antibodies. B. HEK293T cells were transfected with empty vector (V) or FLAG-FOXQ1-expressing vector (F), followed by preparation of nuclear extracts, immunoprecipitation with FLAG antibodies and probing in immunoblotting with the indicated antibodies. C. HEK293T cells were transfected with a mixture of TLE1-4 cDNAs (TLE) or EβP, followed by preparation of nuclear extracts, immunoprecipitation with IgG, pan-TLE (T) or β-catenin (β) antibodies and probing in immunoblotting with the indicated antibodies. D. SCOV3 cells (top) and SK-Mel-147 cells (bottom) were transduced with empty vector or FOXQ1-expressing vector and probed in Q-RT-PCR. Shown are ratios of a gene-specific signal to ACTB-specific signal in FOXQ1-expressing cells normalized to the same in cells transduced with empty vector
Supplemental Figure S5. TLE depletion counteracts FOXQ1-dependent suppression of N-cadherin and invasion
A. Cells transduced with empty vector (Vector) or FOXQ1-expressing vector (FOXQ1) were transfected with control siRNA (CL) or mixture of siRNAs against TLE-1, −2, −3, and −4 (siTLE). Cells were probed in immunoblotting with the indicated antibodies. B. Cells described in (A) were probed in invasion assay. Shown are invasion indexes of cells described in (A) normalized by the same in vector cells.