Significance
The shape of biological membranes is constantly remodeled and maintained out of equilibrium by active proteins. The functional capacity of membrane deformation is mainly determined by the mechanical interplay between protein activity and bending elasticity. In our experiments, we find that ATP synthase, a rotating membrane protein that synthesizes the biochemical energy in cells through proton-pumping activity across the membrane, promotes localized nonequilibrium membrane fluctuations when reconstituted in giant lipid vesicles. The large membrane deformations emerge from the pumping action of rotating proteins clustered at specific emplacements in the membrane. Our results pave the way to new experimental realizations to explore the collective effects of rotating ATP synthases and their possible biological implications for biomembrane organization and protein functionality.
Keywords: giant vesicles, active membranes, mechanical properties, flickering spectroscopy, biological nanorotors
Abstract
ATP synthase is a rotating membrane protein that synthesizes ATP through proton-pumping activity across the membrane. To unveil the mechanical impact of this molecular active pump on the bending properties of its lipid environment, we have functionally reconstituted the ATP synthase in giant unilamellar vesicles and tracked the membrane fluctuations by means of flickering spectroscopy. We find that ATP synthase rotates at a frequency of about 20 Hz, promoting large nonequilibrium deformations at discrete hot spots in lipid vesicles and thus inducing an overall membrane softening. The enhanced nonequilibrium fluctuations are compatible with an accumulation of active proteins at highly curved membrane sites through a curvature−protein coupling mechanism that supports the emergence of collective effects of rotating ATP synthases in lipid membranes.
The rotating F1F0-ATP synthase (F1F0-ATPase) is the transmembrane protein complex responsible for the cellular ATP production, a nonspontaneous chemical reaction that is catalyzed in the presence of an electrochemical proton gradient across the lipid membrane (1). The electrochemical gradient or proton-motive force is composed of an electric charge gradient (ΔΨ) and a chemical proton gradient (ΔpH), which regulate the optimal functionality of the F1F0-ATPase. This mechanism for ATP biosynthesis is functionally and structurally conserved in all kingdoms of life (2). In recent decades, ATP synthesis function has been artificially reconstituted using several model systems. An important achievement was the combined reconstitution of the chloroplast F1F0-ATPase together with a light-inducible proton pump (3). ATP synthesis has been also reconstituted in vitro on different support substrates such as silica particles (4), polymersomes (5), electrode surfaces (6, 7) and nanowires (8), which are potentially exploitable in technological applications. Recently, the Escherichia coli bo3 proton transporter and the E. coli F1F0-ATPase have been functionally reconstituted into giant unilamellar vesicles (GUVs) by using oppositely charged liposome fusion techniques (9).
GUVs are suitable model membranes that allow the performance of cytomimetic studies using microscopy-assisted methods, where micropipette manipulation techniques (10) and flickering spectroscopy analysis (11, 12) extract the mechanical properties of membranes. In particular, fast video microscopy makes membrane dynamics easily accessible from the stochastic analysis of the membrane fluctuations (12). The GUV model has been exploited in recent years to get quantitative descriptions of the mechanical impact of different transmembrane proteins or supramolecular assemblies on lipid bilayers (13–16). However, the mechanical influence of the rotating F1F0-ATPase on its embedding lipid membrane has not been explored yet. This important issue is of particular interest, as a curvature-inducing mechanism has been suggested for this protein complex in the formation of membrane invaginations (cristae) in the inner mitochondrial membrane (17–19).
Here, we report the functional reconstitution of E. coli F1F0-ATPase into GUVs composed of a native E. coli lipid extract (F1F0-GUVs). By using flickering spectroscopy, we show that F1F0-ATPase activity induces nonequilibrium membrane fluctuations additional to thermal motions at discrete regions of the membrane. Thus, the rotating F1F0-ATPase promoted an overall membrane softening that is detected as a significant decrease of the effective bending modulus and a lowering of surface tension (15). Furthermore, we found an additional relaxation process characterized with a constant rate of Γact = 20 s−1, which is found independent of the spatial scale probed. This active relaxation rate coincides with the rotational dynamics of the ATPase enzyme. The nonequilibrium character of the membrane fluctuations accounts for active membrane motions arising from the coupling between the pumping activity of clustered proteins and the bending modes of the membrane.
Materials and Methods
Electroformation of GUVs.
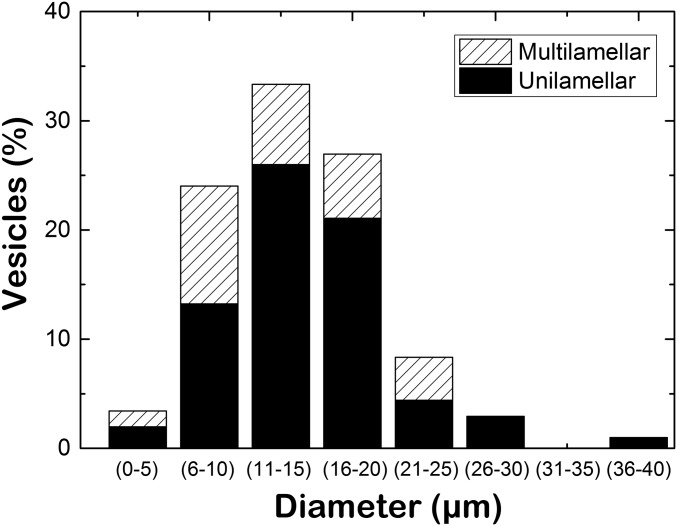
Giant vesicles were prepared using the standard electroformation protocol using indium-tin-oxide (ITO)-covered slides (20). GUVs made of E. coli total lipid extract (TLE) (EcGUVs) were prepared by transferring on each ITO slide two 5-μL drops of 20 mg/mL E. coli TLE. Electroformed F1F0-GUVs (E-F1F0-GUVs) were prepared by spreading on each ITO slide 10 μL of F1F0 small unilamellar vesicles (F1F0-SUVs) (see Supporting Information for details). Then, the films were rehydrated in sucrose solution (200 mM, pH 6), and the electrodes were connected to an AC power supply (500 Hz, 1.1 V; Agilent) for at least 3 h. E-F1F0-GUVs were almost spherical and unilamellar. The size and unilamellarity distributions are shown in Fig. S1.
Fig. S1.
Size and unilamellarity distribution of E-F1F0-GUVs. Over a population of 204 vesicles, 70% of the giant vesicles were unilamellar, and the average size was 15 μm.
Detergent-Based Reconstitution of the F1F0-ATPase in GUVs.
EcGUVs were prepared by electroformation in the presence of 200 mM sucrose, 0.2 mM of n-Dodecyl--d-maltoside (DDM), and 150 μM pH-sensitive fluorescent probe pyranine. Then, F1F0-GUVs produced by detergent removal (D-F1F0-GUVs) were formed by incubating 10 nM purified F1F0-ATPase with 0.25 mg/mL EcGUVs for 2 h at 4 °C. The excess of detergent was removed with SM2 Bio-Beads (Biorad) according to manufacturer’s instructions (21).
Activation of F1F0-ATPase On Addition of Valinomycin.
Twenty-five microliters of F1F0-GUVs were diluted three times in an iso-osmolar reaction buffer (50 mM KCl, 10 mM K2HPO4, 10 mM Na2ADP, 5 mM MgCl2, and 30 mM Hepes pH 7.2) and incubated for 15 min at 20 °C to let pH equilibrate. F1F0-GUVs were activated on addition of 10 μM valinomycin in ethanol (≤1% vol final concentration) (22). For control experiments, F1F0-GUVs were incubated with the triggering solvent in the absence of valinomycin.
Fluctuation Spectroscopy and Membrane Mechanics.
To obtain the spectrum of the membrane fluctuation modes P(q), movies of the fluctuating GUVs are recorded at their equatorial plane by high-velocity video microscopy in the phase contrast mode (see Supporting Information for details). At a given time t, the shape fluctuations are described as discrete Fourier modes, that is, , where q = l/R0 is the equatorial projection of the fluctuation wave vector (l = 2, 3, 4, … ∞). The spectrum is given by the variance of the mode amplitudes, which is ( is the area of the membrane); for thermal fluctuations (11),
| [1] |
where kBT is the thermal energy, the bending modulus (κ) and the surface tension (σ) can be obtained by fitting to the experimental mode amplitudes. The case of nonequilibrium modes driven by protein activity has been studied by Prost and coworkers (13, 23, 24). For the equatorial spectrum, they deduced (24)
| [2] |
with effective mechanical parameters depending on the activity of the protein, and
| [3] |
being an effective amplitude for the active term. Here, is a generalized force stressed by the active components, and is a coupling constant that accounts for the energy involved in creating local curvature by a net imbalance of pumping activity between the two sides of the membrane. The susceptibility involved in creating such imbalance is denoted by (see Supporting Information for details). Within the active vesicle theory, this curvature−protein coupling induces a softening that is described as a decrease of the effective bending modulus as (13)
| [4] |
Membrane dynamics can be studied by probing the experimental autocorrelation function (24)
| [5] |
which consists of the ordinary time relaxation of the thermal mechanical mode (passive), plus an extraordinary term that describes correlations within the nonequilibrium (active) fluctuations. For a passive membrane fluctuating in a fluid of viscosity , the autocorrelation function (ACF) is found as a single-exponential decay for thermal modes with a relaxation rate (25),
| [6] |
Results
Reconstitution of the E. coli F1F0-ATPase in GUVs.
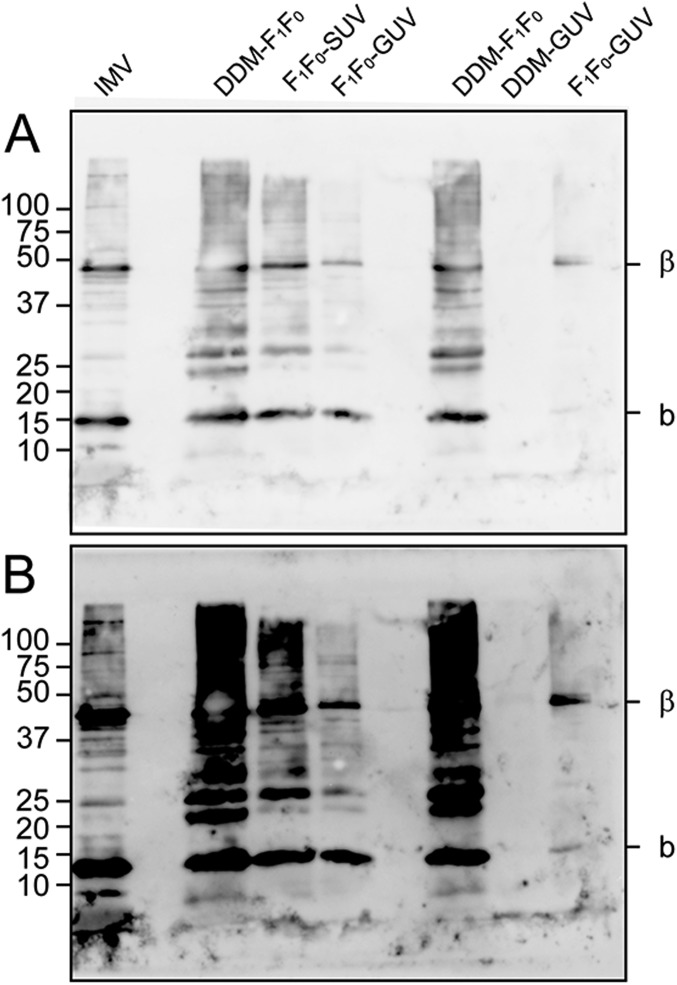
F1F0-GUVs were formed either by electroformation of F1F0-SUVs (26) or by detergent-mediated (27) incorporation of the purified F1F0 complex into preformed EcGUVs (Fig. S2 A and B; see Materials and Methods for details). For both types of GUVs, the incorporation of the F1F0-ATPase was confirmed by Western blotting using specific antibodies that specifically recognize the beta (∼50 kDa) and b subunit (∼17 kDa) of F1 and F0, respectively (Fig. S3). Additionally, we checked the reconstitution of the F1F0 complex into the detergent-mediated GUVs with Alexa-647 labeled F1F0-ATPase. Confocal microscope images show the fluorescence signal of proteins in the GUV membrane (Fig. S2C). After quantification, we found two protein density ranges: n0 = 1013 proteins per square meter (corresponding to an area fraction of 0.15%) for D-F1F0-GUVs and n0 = 1014 proteins per square meter (corresponding to an area fraction of 1.5%) for E-F1F0-GUVs.
Fig. S2.
(A) EcGUVs. Green channel, pyranine; orange channel, Rh-PE. (B) D-F1F0-GUVs after detergent removal. Green channel, pyranine; orange channel, Rh-PE. (C) Incorporation of F1F0 proteins into GUVs. Orange channel, Alexa-647 labeled F1F0-ATPase. (Scale bars: 10 microns.)
Fig. S3.
Western blot analysis of F1F0-ATPase incorporation into GUVs. Western blot analyses with specific antibodies that recognize the beta (∼50 kDa) and b subunit (∼17 kDa) of the F1 and F0, respectively, reveal the presence of F1F0-ATPase at different stages of protein incorporation into GUVs; (A) 20-s and (B) 5-min exposure with: IMV, E. coli inner membrane vesicles; DDM-F1F0, purified F1F0-ATPase in presence of 0.05% DDM; F1F0-SUV, F1F0–ATPase reconstituted into SUVs of total E. coli lipid extract; F1F0-GUV, GUVs electroformed from F1F0-SUVs; DDM-GUV, purified F1F0-ATPase in presence of 0.05% DDM; and F1F0-GUV, GUVs grown as D-F1F0-GUVs.
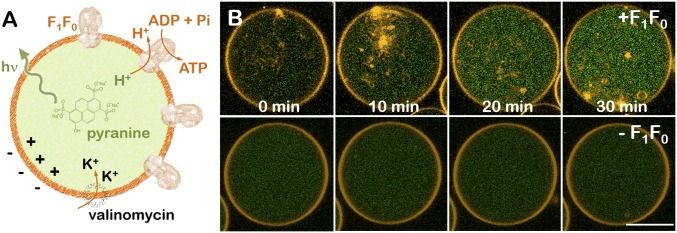
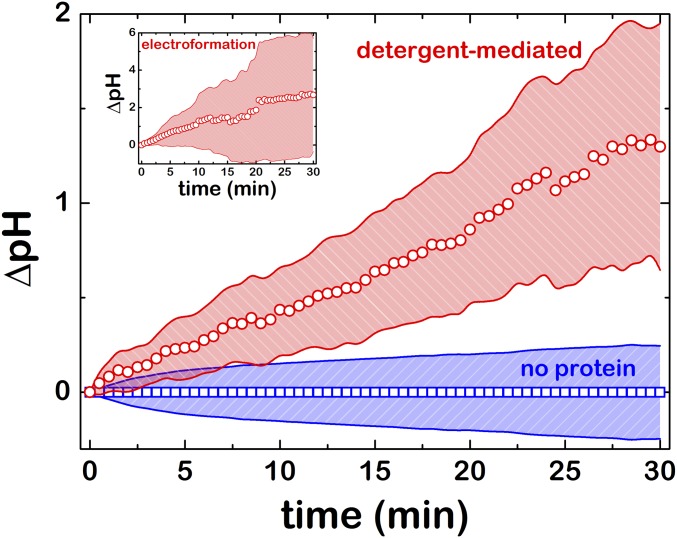
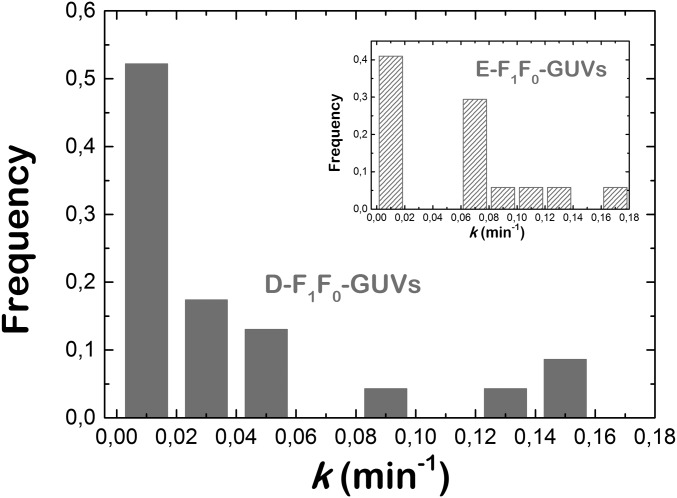
Then we checked the enzymatic activity of F1F0-ATPase in GUVs (Fig. 1A). ATP synthesis is triggered by the addition of the selective K+ transporter valinomycin (22). As a consequence of K+ internalization, protons are pumped out through the rotating proton channel of the F0 subunit. The presence of the pH-sensitive fluorescent probe pyranine is used as a reporter to visualize luminal basification (28), which is indicative for ATP synthesis, as both enzymatic processes are strictly correlated. After valinomycin addition, we observed an average increase of fluorescence in the lumen of F1F0-GUVs (Fig. 1B, Top). The green luminal fluorescence increased until it reached a plateau after several minutes of incubation. In contrast, we did not observe any pyranine fluorescence intensity increase in EcGUVs experiments performed in the absence of F1F0 proteins (Fig. 1B, Bottom). The average increase of fluorescence corresponded to a ΔpH of 1.5 to 2 units (Fig. S4) as measured from the calibration curves shown in Fig. S5 (see Supporting Information for details). The distribution of the basification rates is shown in Fig. S6. Both E-F1F0-GUVs and D-F1F0-GUVs displayed similar distributions, as a vast majority of vesicles had a basicity rate of kb ≈ 0.01 min−1. This indicates that both F1F0-GUVs presented similar protein activity. Despite a more efficient reconstitution of the F1F0 complex in E-F1F0-GUVs, the electroformation process in the absence of salts may be harmful for proteins, and the effective concentration of proteins could be reduced. Even so, a small fraction of E-F1F0-GUVs showed larger basicity rates in comparison with D-F1F0-GUVs, in agreement with a higher protein/lipid ratio on reconstitution.
Fig. 1.
Reconstitution of the E. coli F1F0-ATPase in GUVs. (A) Schematic cartoon of F1F0-ATPase reconstitution into giant vesicles (Left). ATP synthesis is triggered on valinomycin incubation that creates a membrane potential, positive in the lumen of the vesicle. Proton outward translocation through F1F0-ATPases is monitored by the pH-sensitive fluorophore pyranine (green). The lipid bilayer was doped with 0.5% mol RhPE (orange dye). (B) Proton efflux kinetics of E. coli GUVs on valinomycin incubation as observed under fluorescence microcopy, in the presence (Top) and in the absence (Bottom) of F1F0-ATPases. (Scale bar: 10 microns.)
Fig. S4.
Proton efflux kinetics of D-F1F0-GUVs on valinomycin incubation (circles, n = 27), lipid EcGUVs (squares, n = 63) and (Inset) electroformed E-F1F0-GUVs (n = 16). Red and blue patterned areas are the SD obtained over each vesicle population.
Fig. S5.
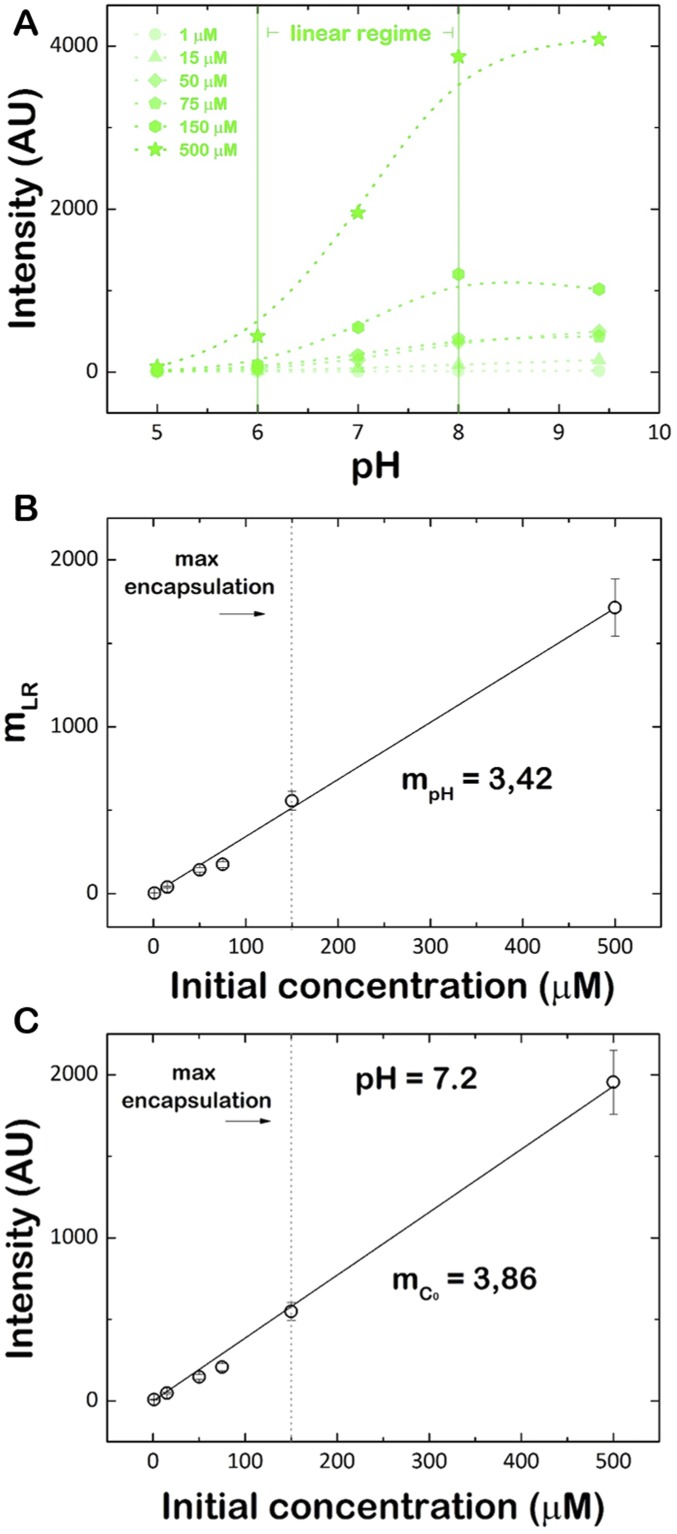
(A) Calibration curve of fluorescence intensity of pyranine vs. pH as measured by confocal microscopy at different initial concentration of pyranine. The curves show a linear variation of fluorescence intensity in the pH 6.0 to 8.5 range. (B) Slope of the linear regime shown in A, with mRL as a function of the concentration of pyranine, c0. (C) Calibration curve of fluorescence intensity of pyranine vs. concentration of pyranine as measured by confocal microscopy at pH = 7.2.
Fig. S6.
Histogram of the basicity rate distribution for D-F1F0-GUVs and (Inset) E-F1F0-GUVs.
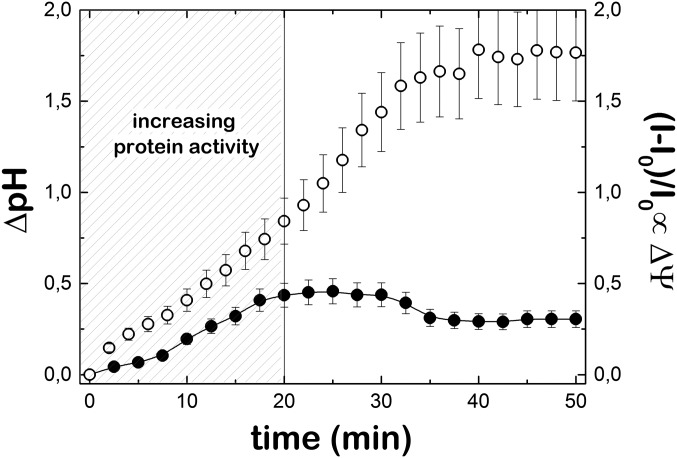
Although the lumen increase of pH adjusts to the expected ΔpH as calculated by the Nernst potential due to K+ internalization, an independent measurement of the membrane potential by the fluorescent probe Rhodamine 123 indicates that the reconstituted F1F0 complexes are not able to completely compensate the membrane potential triggered by the valinomycin molecules (Fig. S7). After the initial regime of rapid ATP synthesis rate, the protein activity is expected to be maintained, as ΔΨ is not completely dissipated and the ATP synthesis by F1F0-ATPase of E. coli depends on the presence of an electric membrane potential (29).
Fig. S7.
Valinomycin-induced electrochemical potential measurements in D-F1F0-GUVs. Electrochemical potential experiments were visualized with the sensitive pH fluorescent probe pyranine (empty circles), and ΔΨ experiments were independently performed with the membrane potential fluorescent probe Rhod 123 (full circles). Note that the activity of F1F0 pumps is not able to fully compensate the rapid inward translocation of K+ promoted by valinomycin. As ATP synthesis rate of F1F0-ATPase of E. coli depends on the electric membrane potential, the dashed region represents the time period in which the protein activity increases. This time range was chosen to evaluate the membrane fluctuations at 20 °C.
Membrane Fluctuations.
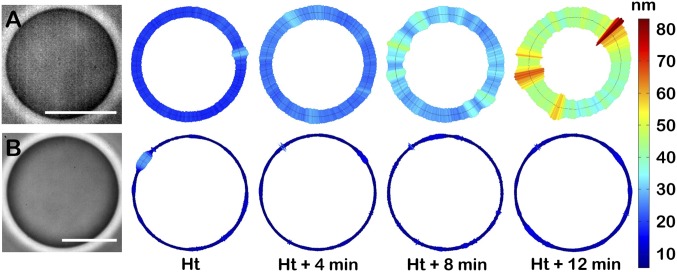
To directly observe the impact of the ATP synthesis on the bending properties of lipid membranes, we performed single-vesicle fluctuation spectroscopy on F1F0-GUVs under ATP-producing (active) and non-ATP-producing (passive) conditions (Movie S1). Fig. 2 illustrates the membrane fluctuation maps of single GUVs, which are obtained as the root mean SD (RMSD =) of the local fluctuation time traces recorded at different time intervals counted from the beginning of the reaction. On the addition of valinomycin, F1F0-GUVs membrane fluctuations became larger during protein activity and were characterized as membrane displacements far away from the equilibrium position (Fig. 2A). This observation correlates with the increasing protein activity established by the increasing ΔΨ during the first 20 min after the addition of valinomycin (Fig. S7). Moreover, active F1F0-GUVs showed enhanced fluctuations at discrete regions of the membrane, whose relative position varied from one time interval to another. The passive F1F0-GUVs exhibited initially similar but low fluctuations than active F1F0-GUVs (Fig. 2B). In this case, the fluctuations remained weak in amplitude along time and were characterized by a low value of the SD (σh(pass) ≈ 15 nm). Nonetheless, the active vesicles displayed increasing enhanced fluctuations when tracked for the same time intervals as in the passive case (σh(act) (t) ≥ σh(pass)). Unlike passive vesicles, which remained fluctuating for longer times, active vesicles lose optical contrast and become unstable.
Fig. 2.
Membrane fluctuations of single D-F1F0-GUVs. Typical membrane fluctuation maps of a single D-F1F0-GUV at different time intervals (Ht, handling time) under (A) active conditions and (B) passive conditions. Scale bar represents the SD value (RMSD in nanometers) of the local membrane fluctuations measured in real space at the equatorial vesicle plane as h(i,t) − h0, where h accounts for the time membrane position i and h0 is the time average value. For illustration, see Movie S1.
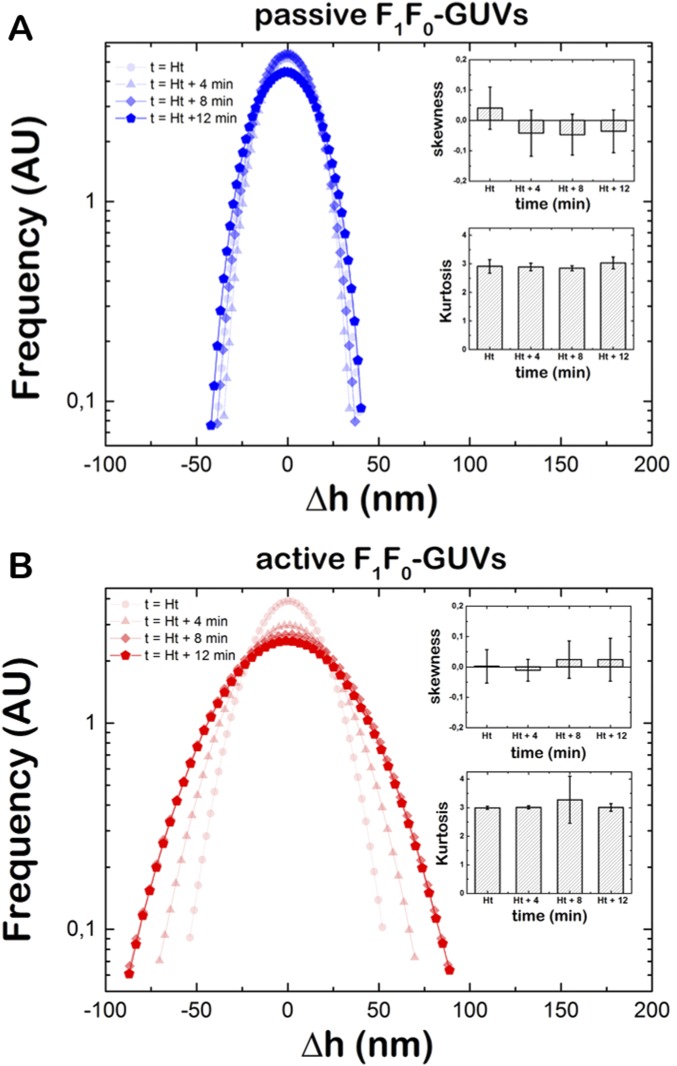
The statistical characterization of the membrane fluctuations was performed using the ensemble-averaged probability density function (PDF) (Supporting Information), which was calculated over all of the points in the contour profile and over a statistically significant population of single vesicles (n ≥ 20). For passive F1F0-GUVs, the ensemble-averaged PDF is found to be nearly Gaussian (with a narrow and nearly symmetric quadratic signature in the logarithmic plot, Fig. S8A) as expected for thermal fluctuations. The membrane fluctuations were characterized by an RMSD value, σ0 = 16.3 ± 0.3 nm, which remains unchanged over time. However, active F1F0-GUVs exhibited enhanced fluctuations, and the PDFs were found to progressively broaden over time (Fig. S8B). In this case, we found that the SD values shifted to higher values with increasing times: σHt + 4 = 25.6 ± 0.1 nm, σHt + 8 = 32.1 ± 0.3 nm, and σHt + 12 = 32.7 ± 0.3 nm. Regarding the higher PDF moments, they remained essentially compatible with the Gaussian characteristics in both cases (the third moment, or skewness, S = 0, and the fourth one, or kurtosis, K = 3; Fig. S8, Insets).
Fig. S8.
Ensemble-averaged PDF of D-F1F0-GUVs. (A) Ensemble-averaged PDF of passive D-F1F0-GUVs (n = 26) at different time intervals. (Inset) Skewness and kurtosis values for the explored time intervals. (B) Ensemble-averaged PDF of active D-F1F0-GUVs (n = 23) at different time intervals. (Inset) Skewness and kurtosis values for the explored time intervals. A Guassian distribution is characterized by a zero skewness and kurtosis K = 3.
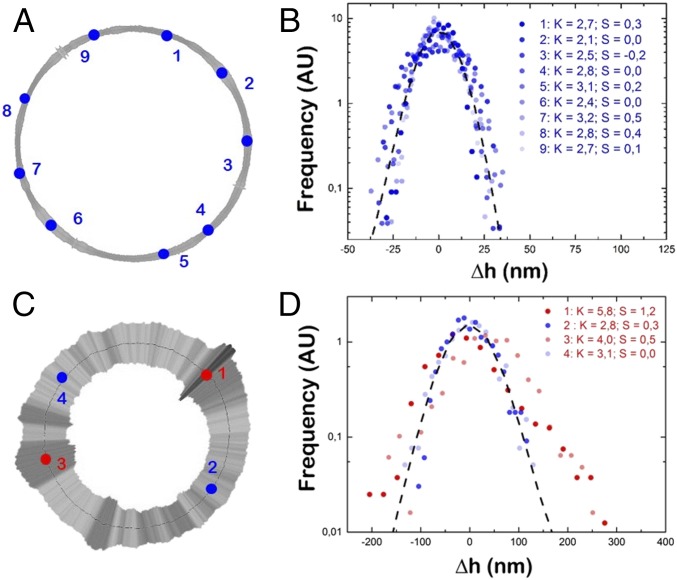
Further, we explored the presence of locally non-Gaussian distributions (Fig. 3) at the specific membrane sites with magnified levels of membrane fluctuations, or hot spots (Fig. 2A). For the passive case, F1F0-GUVs were systematically characterized by almost normal Gaussian distributions along the membrane contour (Fig. 3 A and B), in agreement with the intrinsically symmetric nature of the thermal fluctuations. However, under active conditions, a non-Gaussian distribution of the membrane displacements is observed for different hot spots, which are generally right-skewed (S > 0) and leptokurtic (K > 3), as revealed by the longer tails than expected for the normal distribution (Fig. 3 C and D, respectively). The positive skew is compatible with a vectorized protein pumping toward the outer side of the membrane. As a representative example of this asymmetric behavior, we zoom on the mechanical hot spot 1 (S = 1.2, and K = 5.8) and hot spot 3 (S = 0.5, and K = 4), whereas the fluctuations in the low-activity sites (spots 2 and 4) distribute almost Gaussian (S ≈ 0; K ≈ 3). Because the majority of the membrane contour points display a Gaussian behavior, they mask the non-Gaussian signature of the hot spots when ensemble-averaged by the rest of the thermalized contour membrane points (Fig. S8B). Note that, according to the measured n0, the protein area fraction is 0.15 to 1.5%, so that the number of active hot spots per contour GUV should be 3 to 30, in agreement with our observations.
Fig. 3.
Mechanical hot-spots of D-F1F0-GUVs. (A) Fluctuation map of passive D-F1F0-GUV from B (t = Ht + 12 min). Points indicate the membrane positions where the PDF is calculated in B. (B) PDF at different points highlighted in A. Dashed line represents the ensemble-averaged PDF as calculated for all contour points of the vesicle. (C) Active D-F1F0-GUV from A (t = Ht + 12 min). Points indicate membrane positions where the PDF is calculated in D. (D) PDF at different points highlighted in C. Dashed line represents the ensemble-averaged PDF as calculated for all points of the vesicle. PDFs from points 1 and 3 deviate from Gaussianity. Note that B and D have different scales to highlight the probable out-of-equilibrium signature of hot spots.
Membrane Mechanical Properties.
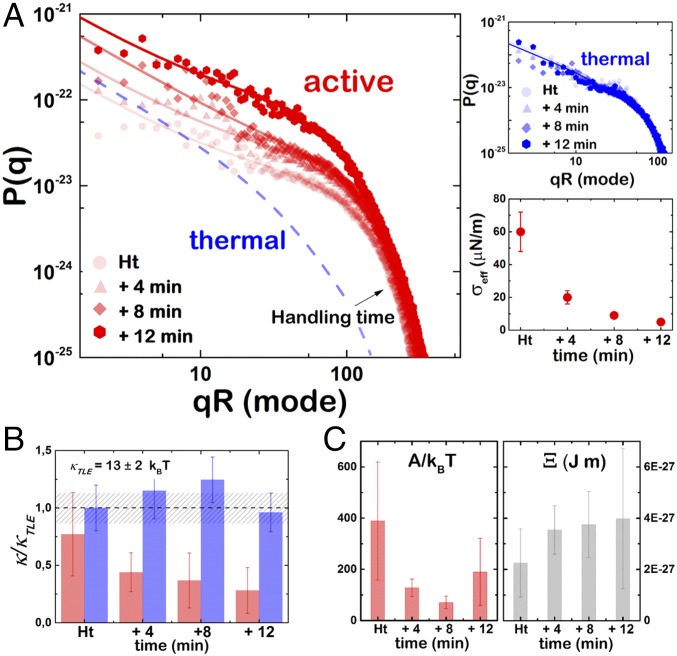
The experimental fluctuation spectra were obtained at different time intervals for both active and passive cases (Fig. 4A). Regarding q scaling, an evident difference is observed between passive and active cases. Helfrich-like scaling is observed for the passive vesicles (Fig. 4A, Top Right), which is characterized by a regular crossover between tension-dominated (P ≈ q−1 at low q) down to a bending regime (P ≈ q−3 at high q) (Eq. 1). However, the spectral amplitudes of the active vesicles are characterized by a low-q pseudoplateau (P ≈ q0), which is characteristic of the tension-dominated regime of the active spectrum (Eq. 2 for A > 0 at ). A decrease in the bending energy is pointed out as a progressive increase of the fluctuation amplitudes at low wave vectors, where the fluctuation modes are mainly driven by an active force exceeding the thermal energy and mainly restored by surface tension (Fig. 4A, Left). By contrast, only the thermal contribution is observed in this region of the fluctuation spectra under nonactive conditions (Fig. 4A, Top Right).
Fig. 4.
Fluctuation spectrum and mechanical properties. (A) Experimental fluctuation spectra obtained for a typical active D-F1F0-GUV at different time intervals after valinomycin incubation. Solid lines represent the best fit to Eq. 2. The dashed line represents the fit to Eq. 1 for the passive case (t = Ht) as shown in Top Right. (Top Right) Experimental fluctuation spectra obtained for a typical passive D-F1F0-GUV at different time intervals. Solid lines represent the best fit to Eq. 1. (Bottom Right) Variation of the effective surface tension σ at different time intervals after valinomycin incubation. (B) Variation of the population-averaged bending rigidity, κ, of active (red, n = 23) and passive (blue, n = 33) D-F1F0-GUVs measured at different time intervals. Bending rigidity is normalized to the bending rigidity measured for pure lipid EcGUVs, κTLE. The dashed region represents the dispersity on the lipid bending modulus, κTLE. (C) (Left) Variation of the effective activity, A, of active (red, n = 23) D-F1F0-GUVs at different time intervals. (Right) Variation of the coupling parameter (Ξ) at different time intervals after valinomycin incubation.
The effective values of the mechanical parameters can be obtained by fitting the experimental equatorial spectra to Eqs. 1 and 2. The progressive membrane softening observed under ATP synthesis was quantified as a decrease of the effective bending modulus due to protein activity (Eq. 4). The elastic parameters for active and passive F1F0-GUVs and EcGUVs are shown in Fig. 4B. EcGUVs represented the basal level of membrane fluctuation that corresponds to the rigidity of the bare lipid membrane with a statistically averaged bending modulus of κlipid = (13 ± 2) kBT. The incorporation of proteins at low density (up to 1.5% in our case) into lipid membranes is not expected to produce significant compositional impact on the membrane rigidities (30); thus the measured value of bending stiffness in F1F0-GUVs was similar to that in EcGUVs and remained unchanged over time (Fig. 4B). Remarkably, on F1F0 activation, the value of bending rigidity significantly decreased by a quarter of the initial value compatible with the passive case. This mechanical softening can be understood as a dynamical effect that connects the F1F0 activity with the overall membrane softening. With respect to surface tension, no significant changes of the averaged population values were detected during protein activity. The high variability of this mechanical parameter among different vesicle specimens is due to the broadly variable excess area that is created in every single vesicle using electroformation (25) (see Supporting Information for a detailed explanation). However, a systematic decrease of the effective value is observed for individual specimens undergoing nonequilibrium fluctuations (Fig. 4A, Bottom Right), in agreement with similar active systems with protein pumps (15, 31).
The quantitative spectral analysis in terms of active vesicle theory allows for a discrimination of a nonequilibrium fluctuation regime. Particularly, the amplitude of the active component A was evaluated (Fig. 4C, Left). On average, we measured initial values of A ≈ 400 kBT that decreased over time to values close to 150 kBT. The global decrease observed in the active term, which is concomitant with a monotonical decrease in the bending modulus, reflects the nontrivial dependence of the effective amplitude A on activity. In effect, A is proportional to the force, F0, exerted by the active proteins according to Eq. 3, but also decreases with the strength of the coupling term , which might depend itself on the pumping activity. From Eq. 4, higher values of are obtained under continuous fluctuation enhancement (Fig. 4C, Right). Thus, the observed decrease of A over time indicates the progressive dominance of the coupling term, whereas F0 remains essentially constant. From the fits, the value of F0 can be deduced, which is of the order of F0 = 10−25 to 10−26 J m (taking our experimental value for n0 = 1013 m−2 and 1014 m−2, respectively). This estimation for F1F0-ATPase seems higher than previous values obtained from micropipette and shape fluctuation experiments with GUVs containing the pumping membrane protein bacteriorhodopsin (13, 31). However, once the protein densities are considered, similar values of A are obtained for the two proteins. This energy can be related to the energy barrier that the pumping proteins must overcome during the proton transfer process. Whereas this barrier is of the order of 10 kcal/mol for bacteriorhodopsin (32), the torque required for a full rotation of the ATPase motor corresponds to a free energy barrier of 14 kcal/mol, which is supplied by the proton gradient (Discussion). Finally, note that the increasing of the coupling constant can be interpreted in terms of localized protein activity, which may eventually reach the onset of instability predicted in ref. 24, a fact compatible with the presence of localized nonequilibrium fluctuations at the hot spots where the protein could be clustered.
Time Correlation Function and Relaxation Dynamics.
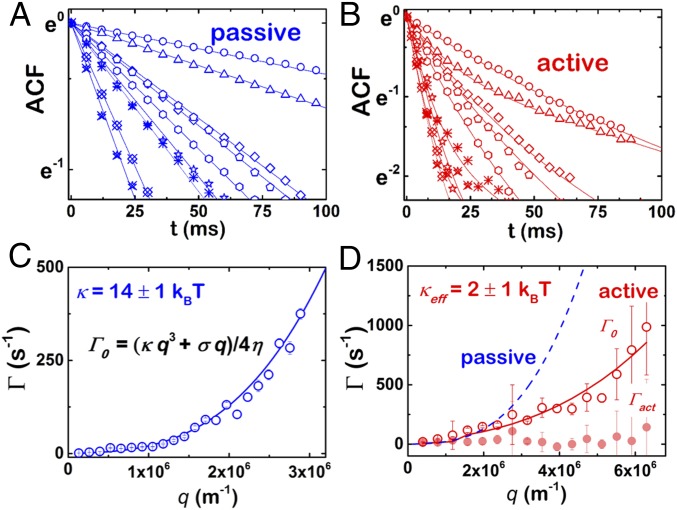
Additional evidence on the nonequilibrium character of the membrane fluctuations during ATP synthesis arises from the analysis of the relaxation dynamics of the membrane fluctuations that are obtained from the height-to-height time ACF (Materials and Methods). Fig. 5 A and B shows typical experimental ACFs calculated for the first equatorial fluctuation modes for passive and active F1F0-GUVs, respectively. In Fig. 5C, we show the relaxation rates obtained from the single-exponential fittings for the passive case (Eq. 5 for , when ). The mechanical parameters were obtained by fitting the experimental relaxation rates to Eq. 6 (see Supporting Information for details). We obtained κpass = 14 ± 3 kBT (n = 10 vesicles), in agreement with the values previously obtained from the time-averaged fluctuation spectra (Fig. 4). However, ACFs from active F1F0-GUVs exhibited the two-exponential decay predicted by Eq. 5 from active vesicle theory (Fig. 5B), which describes two relaxation modes. As in passive F1F0-GUVs, the relaxation rate of the faster mode showed the same power-law dependence as described by the thermal mode (Fig. 5D). Note that, in the active theory, both the surface tension and the bending modulus contain the active contribution to the relaxation rates (13). From our experiments, an effective value of the bending rigidity κeff = 2 ± 1 kBT < κpass is obtained (n = 7 vesicles), whereas a systematic decrease of the effective value of surface tension is detected in every single vesicle after protein activation. This result is in quantitative agreement with the effective decrease in the bending modulus and the tension lowering observed from the fluctuation spectra in active F1F0-GUVs, as shown in Fig. 4. Furthermore, whereas the thermal mode is found to be dispersive, the second relaxation mode appears always with a nearly q-independent relaxation rate, which suggests a metabolic origin that could be related to the characteristic rate of the enzymatic activity of the protein (15). The relaxation dynamics of active F1F0-GUVs was characterized by a constant rate, at Γact = 20 ± 5 s−1.
Fig. 5.
Time correlation function and relaxation dynamics. Experimental ACFs of a D-F1F0-GUV in the (A) passive and (B) active cases for azimuthal wave vectors 2 ≤ l ≤ 10. Solid lines correspond to fits of the experimental data to Eq. 5. Only the thermal contribution of Eq. 5 was necessary under passive conditions, whereas the bimodal function of Eq. 5 was required for active D-F1F0-GUVs. Relaxation rates of a D-F1F0-GUV in the (C) passive and (D) active cases. Thermal frequencies, Γ0, were fitted using Eq. S8 with η = 1 cP (solid lines). For comparison, dashed line in D corresponds to the thermal rate shown in C. Γact is the characteristic rate of the metabolic active mode.
As a main outcome of our results, we have demonstrated the functional reconstitution of F1F0-ATPase in GUVs, and evidenced that the ATP synthesis activity of the F1F0-ATPase promotes enhanced nonequilibrium membrane fluctuations that modify the mechanical properties of the embedding lipid bilayer.
Discussion
According to the conventional Helfrich theory (33, 34), the amplitudes of the thermal fluctuations become progressively smaller at higher wave vectors. Thus, bending-mediated fluctuations prevent large-amplitude deformations at the nanoscale if excited by passive thermal agitation alone. However, cell membranes exhibit a plethora of morphologies in the nanometric scale, including highly curved membranes of some organelles, such as the Golgi, the endoplasmic reticulum, and the inner mitochondrial membrane. Cells take advantage of membrane-associated proteins to promote and stabilize these local membrane deformations either by scaffolding (35, 36) or by wedging (37, 38) mechanisms.
Bending-effector proteins stress membrane distortion that affects the mechanical behavior of the hosting bilayer. Protein activity can contribute to decrease the bending energy of lipid bilayers, as already detected in giant vesicles containing bacteriorhodopsin (13, 31), Ca2+ ATPase (14), Na+ ATPase (15), or K+ ATPase (37). Our observational results with active vesicles containing F1F0-ATPase reveal enhanced fluctuations at localized hot spots in the vesicle membrane that translate into a global lowering in surface tension, which is predominant over long distances, and a decrease in the bending modulus of the membrane at high wave vectors. As F1F0-ATPase is not only a proton pump but also a rotating motor through the membrane-spanning component, F0, two possible effecting modes can be attributed to F1F0-ATPase to explain the enhanced membrane fluctuations: a transverse mode connected with the proton-pumping activity of the enzyme, and an in-plane rotating mode connected to the directional torque of the protein rotor.
Pumping.
The coupling mechanism existing between transverse flow of protons across the membrane and the lateral stresses explains the observed lowering in surface tension, as shown for the case of the proton-pumping activity of bacteriorhodopsin (31). Likewise, the coupling between the protein density and the bending elasticity of the membrane can be invoked to explain the observed membrane softening (24). Indeed the nonequilibrium fluctuations found at hot spots are compatible with a pumping-driven undulation of the membrane due to the action of clustered proteins (24). In structural terms, the ability of conic-like ATP synthase dimers to partition into highly curved membranes has been also proposed to induce membrane curved shapes characterized by a wedge angle within the range of 55° and 120° (18, 19). This wedged configuration gives structural support to a positive spontaneous curvature (C0 > 0) and thus to a localized membrane softening [κeff = κ (1−C0R)2 < κ] (39). Furthermore, above a given concentration threshold for protein clustering, the dynamic coupling between protein and curvature can elicit a membrane instability through localized high-amplitude fluctuations (24), as observed at long times in our experimental realization.
Rotation.
The pumping-driven clustering of F1F0-ATPases might possibly involve a facilitated protein diffusion of rotating motors through a long-range hydrodynamic interaction mediated by the viscoelastic substrate (40). Indeed, active rotation in a dense medium gives rise to effective interactions between rotors that promote clustering, phase separation, spatial ordering, and synchronization (41–45). These effects remain experimentally unexplored in the case of F1F0-ATPase, but the localized nonequilibrium membrane fluctuations we report here can be explained as a consequence of the collective behavior of simultaneous pumping protein clusters mediated by molecular rotation. To identify the characteristic rotation time for an individual rotor, the generated torque by F0-ring rotation can be estimated as T = ξ × ω = 6πμR2 ω; where ξ is the drag force of a disk embedded in 2D medium, ω is the angular velocity, μ is the surface membrane viscosity, and R is the radius of the F0 ring. Taking previously reported values for μ = 10−5 N s⋅m−1 (46), R = 5 nm (47), and the experimentally measured characteristic rate ω = Γact = 20 ± 5 s−1, we obtain a frictional torque of about 100 ± 25 pN nm. This value is similar to that reported previously for E. coli F1F0-ATPase (6, 48, 49) and corresponds to the metabolic energy put into play in a rotating cycle of the F1F0-ATPase to hydrolyze/synthetize three molecules of ATP. The agreement of these estimations with biochemical information suggests that the time correlation of the active component actually corresponds to the rotational movements of the F0 ring during ATP synthesis. Therefore, we identify dynamical correlations at a mesoscopic scale, which may correspond to the F0-ring rotation time in lipid membranes and in the absence of any probe that may eventually drag its rotatory motion.
Furthermore, the correlation decay time of the active component, Γact, might be predicted from an alternative bending energy formulation. The rotational movements of the F0 ring during ATP synthesis could be transmitted to the lipid membrane environment by a torsional−curvature coupling mechanism, as lipid reorganization can take place at the vicinity of rotating proteins (50). In a simple dynamical modeling, a metabolic rotator is coupled with the bending mode of the membrane, causing an additional susceptibility, χact ≈ (T/V0)∇2h, where T is the torque power stroke of the rotor and V0 is the molecular volume where rotation takes place. Thus, whereas the thermal mode relaxation depends on the bulk viscosity, the active mode due to metabolic activity of the rotator might relax through the shear viscosity of the embedding membrane, with the hydrodynamic compliance Λmemb = 4μq2. Consequently, the active mode is expected to relax at a q-independent constant rate Γact ≈ χact/Λmemb ≈ Τ/(μA0) ≈ 10 s−1 in agreement with our experimental observations (here, A0 ≈ V0/h is the molecular area of the rotor).
In summary, we present experimental evidence that the coupled pumping and rotation activities of F1F0-ATPase promote localized nonequilibrium membrane fluctuations where the active proteins might be clustered. The activity of F1F0-ATPase favors the decrease in the bending stiffness of the membrane and the concomitant lowering of its surface tension. Our results point out the existence of a functional connection between microscopic protein activity, supramolecular organization, and macroscopic mechanics, which could be not only operating as a protein activity modulator or as an effector of membrane remodeling in vivo but also exploited in synthetic realizations containing F1F0-ATPase within viscoelastic media.
Chemicals
Potassium chloride (KCl), magnesium chloride (MgCl2), glucose, sucrose, Tris(hydroxymethyl)aminomethane (Tris), 4-(2-hydroxyethyl)-1-piperazineethanesulfonic acid (Hepes), hydroxypyrene-1,3,6-trisulfonic acid (Pyranine), valinomycin, dibasic potassium phosphate (K2HPO4), and adenosine-5′-diphosphate (Na2ADP) were supplied by Sigma-Aldrich. DDM was purchased from VWR. Ultrapure water was produced from a Milli-Q unit (Millipore, conductivity lower than 18 MΩ cm).
Lipids
The fluorescent probe 1,2-dioleoyl-sn-glycero-3-phosphoethanolamine-N- (lissamine rhodamine B sulfonyl) (Rh-PE) and E. coli TLE were purchased from Avanti Polar and suspended in chloroform at 1 mg/mL and 20 mg/mL, respectively. Lipids were stored at −20 °C.
Purification and Reconstitution of the E. coli F1F0-ATPase into SUVs
The E. coli F1F0-ATPase was purified from native E. coli MG1655 cytoplasmic membranes as previously described (7) and reconstituted together with E. coli TLE into SUVs by rapid dilution. Briefly, 100 μL of purified F1F0-ATPase (0.5 mg/mL) was incubated with 20 μL of E. coli TLE (20 mg/mL) for 30 min on ice and rapidly diluted to a volume of 4 mL with 50 mM Tris⋅HCl (pH 8) and 3 mM KCl. Proteoliposomes carrying the F1F0-ATPase (F1F0-SUVs) were collected by ultracentrifugation (MLA 80 rotor; 30 min at 298,906 × g) and resuspended in 100 μL of H2O.
Fluorescent Labeling of F1F0-ATPase
Before reconstitution, the purified F1F0-ATPase complex was incubated with 1 mM fluorescent Alexa 647-NHS at 4 °C for 120 min. The reaction was quenched by the addition of 10 mM Lysine, and the unreacted label was removed by ion exchange chromatography.
Protein Density Quantification
The phospholipid to protein ratio of the F1F0-GUVs was estimated on the determination of the phospholipid concentration according to Rouser et al. (51) and the protein concentration by comparative Western blot (52) using known concentrations of purified F1F0 complex as a reference and a specific monoclonal antibody of the F1-beta subunit for protein detection. The protein concentration was quantified from nonsaturated Western blot signals with the ImageJ software package (53).
Confocal Microscopy
Confocal microscopy images of F1F0-GUVs were collected with a Nikon Ti-E inverted microscope equipped with a Nikon C2 confocal scanning confocal module, 488-nm and 561-nm continuous lasers, emission band-pass filters, and a Nikon Plan Apo 100× NA 1.45 oil immersion objective. Images were processed with the Nikon NIS-Elements software and further processed with MATLAB R2013b (The MathWorks Inc.).
Valinomycin-Induced Electrochemical Potential Measurements in GUVs
In our experimental setup, ATP synthesis is triggered by the addition of the selective K+ transporter valinomycin. In the presence of valinomycin, K+ ions from the outer medium ([K+]out = 30 mM) enter the lumen of vesicles ([K+]in = 1 mM) and produce an electrical transmembrane potential (ΔΨ ≈ ), positive inside, which triggers the ATP synthesis by the F1F0 proteins. The vectorial proton transport across the membrane eventually leads to the luminal basification of the GUV and promotes the synthesis of ATP by the F1 subunit that binds ADP and inorganic phosphate (Pi) on the external side of the GUV.
The luminal basification of GUVs was recorded over time as the increase in fluorescence intensity from the encapsulated pyranine (28), a pH-sensitive probe whose fluorescence intensity increases linearly with the pH of the solution within the range of 6.5 to 8.5. Out of this range, the fluorescence intensity becomes nearly constant (Fig. S5A). The linear regime is characterized by a slope mLR, which depends also linearly on the initial concentration of the probe, c0, as mLR = mpH c0 (Fig. S5B). As electroformation does not reach a 100% encapsulation yield of the pyranine in GUVs, the initial concentration was determined for each vesicle using the calibration curve measured at pH = 7.2 (Fig. S5C). After valinomycin incubation, the time course of the pH increase can be described by , where I(t) is the instantaneous intensity and accounts for the initial fluorescence intensity, both measured in the lumen of each GUV.
Similar but independent experiments were performed to estimate the time evolution of the valinomycin-dependent membrane potential in F1F0-GUVs using the increase of membrane fluorescence of Rhodamine 123 (Fig. S7). Rho 123 is a cationic membrane potential probe whose fluorescence intensity increases as it accumulates the lipid bilayer of the vesicle by the presence of a membrane potential (54). It is worth noting that, 20 min after the addition of valinomycin, ΔΨ still continues to increase linearly. The protein activity is assumed to increase during this period, as the rate of ATP synthesis by F1F0-ATPase of E. coli depends on the electric membrane potential. After 30 min of incubation with valinomycin, both ΔpH and ΔΨ reached steady values.
High-Velocity Video Microscopy
Phase contrast microscopy images and movies of the F1F0-GUVs were recorded with an inverted microscope (Nikon Eclipse 2000Ti) equipped with a 100 W TI-12 DH Pillar Illuminator, an LWD 0.52 collimator, and a 100× oil immersion objective (PlanApoVC, N.A. 1.4; Nikon). Fluctuation movies (see Movie S1 for a representative example) were captured with a FASTCAM SA3 camera (Photron), with an effective pixel size of 50 × 50 nm2. To provide optimal signal-to-noise ratio (SNR), the movies were recorded during 1 s of tracking time at a sampling frequency of 500 Hz (n = 500 frames). Experiments on membrane fluctuations were made at 22 °C. The GUV equatorial positions were digitally segmented using a custom-made algorithm that combines accurate instantaneous positioning of the membrane contour with respect to the GUV center (55) and optimal contour imaging with respect to the background noise (11).
The radial positions of the contour points Rj(xj, t) (j = 1, … n = 2,048) are determined for each frame of the recorded movie. The statistics of the membrane fluctuations is built as a real-space ensemble, which is constituted by the local displacements of each point in the equatorial contour of the vesicle membrane, hj(x, t) = Rj(xj, t) − R0, with R0 being the contour-averaged radius measured with respect to the instantaneous position of the vesicle barycenter.
To statistically characterize the membrane fluctuations on F1F0 activity, the ensemble-averaged PDF was built from the normalized histograms of the membrane height displacements, which were time-averaged over all of the points in the equatorial profile and over a statistically significant population of individual vesicles (n ≥ 20, typically). The PDF is used to calculate the three first consecutive moments, that is, the SD, the skewness, and the kurtosis, respectively, which allows the analysis of a possible deviation from Gaussianity.
Membrane Fluctuation Spectroscopy
At a given time t, the equatorial fluctuations h(t) = {hj (xj,t} with j = 1…n are described as discrete Fourier modes h(t) = Σ(l)hl(t) exp(iqxx), where qx = l/R0 is the equatorial projection of the fluctuation wave vector (l = 2, 3, 4, … ∞, with l as the azimuthal number; l = 1 corresponds to the breathing mode, which does not contribute to change the spherical shape). The fluctuation spectrum P(q) is defined as the amplitude variance of the thermal fluctuation modes; this is . By comparison with the theoretical spectrum, the Fourier-space decomposition of the vesicle fluctuations allows the calculation of the mechanical parameters of the membrane. At equilibrium conditions, according to the fluctuation−dissipation theorem, the spectrum reads
| [S1] |
where is the area of the fluctuating membrane, denotes the time average on the time ensemble hq(tk); k = 1…N, and is the elastic susceptibility of the thermal membrane modes, as described by the Helfrich Hamiltonian (HH) (33, 34).
| [S2] |
From HH, the formation of thermal modes is opposed by membrane stiffness, which restores changes both in membrane area through surface tension (σ) and in membrane curvature by bending rigidity (κ). For planar modes in Fourier space, the thermal elastic susceptibility associated with HH reads as . This is the usual description used to analyze thermal modes in passive membranes, that is, lipid vesicles (11, 12). Here, the mechanical parameters κ and σ are obtained by fitting the experimental mode amplitudes to the Helfrich theoretical spectrum particularized to the equatorial fluctuations; in the case of a passive membrane, this equatorial spectrum is given by (11)
| [S3] |
where the x component of the wave vector q = (qx, qy) is chosen as the equatorial projection of the fluctuation wave vector; this is qx (=l/R0, with l = 2, 3, 4, … ∞). Since our experiments only deal with equatorial fluctuations described in terms of the azimuthal modes with wave vectors qx, in the following, they will be renamed as q for simplicity, and the equatorial spectrum will be simply P(q). Thus, Eq. S3 is rewritten as Eq. 1.
Experimental spectra are often analyzed in terms of q scaling. For the passive membrane, two regimes can be distinguished in the equatorial spectrum depending on q; a tension-dominated regime P ≈ q−1 at q << (σ/κ)1/2, and P ≈ q−3 in the bending dominated regime at q >> (σ/κ)1/2.
Relaxation Dynamics, Time Correlations, and Active Vesicle Theory
GUV dynamics is experimentally probed through the time ACF of the membrane height fluctuations (transverse fluctuations), which, in Fourier space, is defined as
| [S4] |
This ACF is normalized, with a normalization constant given by the height variance. From a theoretical standpoint, the ACF can be calculated from solving the equation of motion (EoM) of the membrane thermal fluctuations, which describes a generalized stochastic diffusive transport, where the fluctuation field h evolves driven by the gradient in elastic energy δE/δh; usually, EoM is written with the Langevin form (56),
| [S5] |
where is a generalized hydrodynamic compliance, and is a stochastic velocity function of variance .
For elastic systems in the linear regime, , with being a generalized elastic susceptibility; for thermal modes in an elastic membrane, . If membrane relaxation occurs exclusively via bulk viscosity (against the surrounding fluid of shear viscosity ), then (56). Under these conditions, EoM takes the form , where is a decay rate determined by the balance between elastic stresses and hydrodynamic friction; thus, time correlations of the ordinary (passive) fluctuation modes are found with a single-exponential decay as (25)
| [S6] |
with height variance
| [S7] |
and relaxation rates
| [S8] |
To describe the mechanical response of the vesicle membrane containing mechanically active proteins, we considered an effective HH framework combined with a permeability-modified relaxation dynamics (15, 22, 23). To account for the observed out-of-equilibrium membrane fluctuations that give rise to effective bending softening, we considered linear coupling between active protein motions and local curvature, similarly to the active permeation theory of Prost and collaborators, which was developed to account for the proton-pumping activity of bacteriorhodopsin (57). In that theory, a protein-dependent extension of the HH is given as
| [S9] |
where the additional field ψ accounts for the net imbalance in protein density that gives rise to nonequilibrium membrane activity.
Two additional terms due to protein are included in the modified membrane Hamiltonian: (i) the energy cost necessary to generate a protein density imbalance, which is quantified by the linear osmotic impedance ζ [for dilute protein density in the membrane, ζ ≈ kBT/n0, where n0 is the average density of proteins; in the present work, n0 ≈ 1013 m−2 to 1014 m−2, which represents a surface coverage as low as 0.15 to 1.5% (Supporting Information)]; and (ii) a stabilizing contribution from the active motions, which supports creation of nonequilibrium modes, and thus enhances membrane fluctuations (the last term in the right-hand side of Eq. S9). This term is written as a negative contribution to changes in elastic energy, which is proportional, through the coupling constant Ξ, to the crossed product between the local membrane curvature and the colocalized change in the protein density field.
Regarding diffusive dynamics of the height fluctuations, if an active protein is assumed to exert a force f0 normal to the membrane, an additional term due to the transport of the protein density field must be considered; this is , where is the normal projection of the active velocity field (24). The presence of transverse membrane transport (e.g., due to passive membrane permeability, or to the pumping activity of membrane protein channels) is particularly relevant, as it makes the hydrodynamic compliance increase by a permeation flow term, (with being a permeation rate (13, 24). Additionally, the dynamic evolution of the protein density field obeys the conservation law , where D is the lateral diffusion coefficient of the membrane protein.
In the stable dynamic regime, there is an intermediate q range of effective softening where several relevant features emerge from the active model (24):
-
i)
The “equilibrium” height variance of the (passive) mechanical modes varies as
| [S10] |
with an effective bending rigidity
| [S11] |
that is, the larger the protein activity, the higher the bending softening undergone by the membrane.
-
ii)
There is a superposed nonequilibrium (active) mode of fluctuation with a strength depending on kinetic coefficients. This mode describes nonequilibrium fluctuations, which are a direct consequence of the force stressed by the active proteins, that is, , where (with ).
-
iii)
The longest fluctuations travel as nondispersive waves, that is, with time correlations independent of the wave vector, and exclusively set by the activity of the protein. Therefore, the ACF is expected in this regime with a bimodal form,
| [S12] |
which consists of the ordinary mechanical mode (passive) with equilibrium amplitude and relaxation rate, , plus an active term, which describes nonequilibrium (active) fluctuations driven by the protein activity. If protein diffusional dynamics is neglected (4ηqD << κq2 + σ), the amplitudes of these active fluctuations is expected to vary as (13, 24)
| [S13] |
where enters the nonequilibrium contribution of protein activity to the height fluctuations, and the equatorial fluctuation spectrum used to fit the experimental data are taken with the general form (24)
| [S14] |
where the passive term corresponds to the equilibrium expression in Eq. S3, and describes the amplitude of the active term and for dilute protein density, . Eq. S14 corresponds to the expression in Eq. 2, which is used to fit the experimental spectra.
Similarly, the normalized ACF obtained from experiments would be fitted to a bimodal exponential written as the sum of an equilibrium term ACFq(th) corresponding to the thermal fluctuations plus an active component ACFq(act),
| [S15] |
where the normalized coefficient Aq accounts for the relative contribution of the passive component. Here, the active component is formally described as a second relaxation mode, which is assumed to decay exponentially at a constant rate corresponding to the correlations of the active process (58); thus, , where Γact is the characteristic rate of the metabolic process, which produces correlations only at a characteristic timescale independently of the considered mode.
Supplementary Material
Acknowledgments
I.L.-M. acknowledges Dr. Laura R. Arriaga for critical reading of the manuscript. This work was supported by the European Research Council (ERC) Starting Grant “MITOCHON” (ERC-StG-2013-338133) and “Programa Ramon y Cajal” (RYC-2013-12609) from the Spanish Ministry of Economy, Industry, and Competitiveness (MINECO) (to I.L.-M.) and FIS2015-70339-C1-R from MINECO (to I.L.-M. and F.M.).
Footnotes
The authors declare no conflict of interest.
This article is a PNAS Direct Submission. O.S.A. is a guest editor invited by the Editorial Board.
This article contains supporting information online at www.pnas.org/lookup/suppl/doi:10.1073/pnas.1701207114/-/DCSupplemental.
References
- 1.Mitchell P. Coupling of phosphorylation to electron and hydrogen transfer by a chemi-osmotic type of mechanism. Nature. 1961;191:144–148. doi: 10.1038/191144a0. [DOI] [PubMed] [Google Scholar]
- 2.Jonckheere AI, Smeitink JAM, Rodenburg RJT. Mitochondrial ATP synthase: Architecture, function and pathology. J Inherit Metab Dis. 2012;35:211–225. doi: 10.1007/s10545-011-9382-9. [DOI] [PMC free article] [PubMed] [Google Scholar]
- 3.Steinberg-Yfrach G, et al. Light-driven production of ATP catalysed by F0F1-ATP synthase in an artificial photosynthetic membrane. Nature. 1998;392:479–482. doi: 10.1038/33116. [DOI] [PubMed] [Google Scholar]
- 4.Luo T-JM, Soong R, Lan E, Dunn B, Montemagno C. Photo-induced proton gradients and ATP biosynthesis produced by vesicles encapsulated in a silica matrix. Nat Mater. 2005;4:220–224. doi: 10.1038/nmat1322. [DOI] [PubMed] [Google Scholar]
- 5.Choi H-J, Montemagno CD. Artificial organelle: ATP synthesis from cellular mimetic polymersomes. Nano Lett. 2005;5:2538–2542. doi: 10.1021/nl051896e. [DOI] [PubMed] [Google Scholar]
- 6.Naumann R, et al. Coupling of proton translocation through ATPase incorporated into supported lipid bilayers to an electrochemical process. Bioelectrochem Bioenerg. 1997;42:241–247. [Google Scholar]
- 7.Gutiérrez-Sanz Ó, et al. H2 -fueled ATP synthesis on an electrode: Mimicking cellular respiration. Angew Chem Int Ed Engl. 2016;55:6216–6220. doi: 10.1002/anie.201600752. [DOI] [PMC free article] [PubMed] [Google Scholar]
- 8.McBee TW, et al. Characterization of proton transport across a waveguide-supported lipid bilayer. J Am Chem Soc. 2006;128:2184–2185. doi: 10.1021/ja056750w. [DOI] [PubMed] [Google Scholar]
- 9.Biner O, Schick T, Müller Y, von Ballmoos C. Delivery of membrane proteins into small and giant unilamellar vesicles by charge-mediated fusion. FEBS Lett. 2016;590:2051–2062. doi: 10.1002/1873-3468.12233. [DOI] [PubMed] [Google Scholar]
- 10.Baumgart T, Das S, Webb WW, Jenkins JT. Membrane elasticity in giant vesicles with fluid phase coexistence. Biophys J. 2005;89:1067–1080. doi: 10.1529/biophysj.104.049692. [DOI] [PMC free article] [PubMed] [Google Scholar]
- 11.Pécréaux J, Döbereiner HG, Prost J, Joanny JF, Bassereau P. Refined contour analysis of giant unilamellar vesicles. Eur Phys J E Soft Matter. 2004;13:277–290. doi: 10.1140/epje/i2004-10001-9. [DOI] [PubMed] [Google Scholar]
- 12.Rodríguez-García R, et al. Bimodal spectrum for the curvature fluctuations of bilayer vesicles: Pure bending plus hybrid curvature-dilation modes. Phys Rev Lett. 2009;102:128101. doi: 10.1103/PhysRevLett.102.128101. [DOI] [PubMed] [Google Scholar]
- 13.Manneville JB, Bassereau P, Ramaswamy S, Prost J. Active membrane fluctuations studied by micropipet aspiration. Phys Rev E Stat Nonlin Soft Matter Phys. 2001;64:021908. doi: 10.1103/PhysRevE.64.021908. [DOI] [PubMed] [Google Scholar]
- 14.Girard P, Prost J, Bassereau P. Passive or active fluctuations in membranes containing proteins. Phys Rev Lett. 2005;94:088102. doi: 10.1103/PhysRevLett.94.088102. [DOI] [PubMed] [Google Scholar]
- 15.Bouvrais H, Cornelius F, Ipsen JH, Mouritsen OG. Intrinsic reaction-cycle time scale of Na+,K+-ATPase manifests itself in the lipid−protein interactions of nonequilibrium membranes. Proc Natl Acad Sci USA. 2012;109:18442–18446. doi: 10.1073/pnas.1209909109. [DOI] [PMC free article] [PubMed] [Google Scholar]
- 16.López-Montero I, Rodríguez-García R, Monroy F. Artificial spectrin shells reconstituted on giant vesicles. J Phys Chem Lett. 2012;3:1583–1588. doi: 10.1021/jz300377q. [DOI] [PubMed] [Google Scholar]
- 17.Allen RD. Membrane tubulation and proton pumps. Protoplasma. 1995;189:1–8. [Google Scholar]
- 18.Minauro-Sanmiguel F, Wilkens S, García JJ. Structure of dimeric mitochondrial ATP synthase: Novel F0 bridging features and the structural basis of mitochondrial cristae biogenesis. Proc Natl Acad Sci USA. 2005;102:12356–12358. doi: 10.1073/pnas.0503893102. [DOI] [PMC free article] [PubMed] [Google Scholar]
- 19.Davies KM, Anselmi C, Wittig I, Faraldo-Gómez JD, Kühlbrandt W. Structure of the yeast F1Fo-ATP synthase dimer and its role in shaping the mitochondrial cristae. Proc Natl Acad Sci USA. 2012;109:13602–13607. doi: 10.1073/pnas.1204593109. [DOI] [PMC free article] [PubMed] [Google Scholar]
- 20.Mathivet L, Cribier S, Devaux PF. Shape change and physical properties of giant phospholipid vesicles prepared in the presence of an AC electric field. Biophys J. 1996;70:1112–1121. doi: 10.1016/S0006-3495(96)79693-5. [DOI] [PMC free article] [PubMed] [Google Scholar]
- 21.Rigaud JL, Pitard B, Levy D. Reconstitution of membrane proteins into liposomes: Application to energy-transducing membrane proteins. Biochim Biophys Acta. 1995;1231:223–246. doi: 10.1016/0005-2728(95)00091-v. [DOI] [PubMed] [Google Scholar]
- 22.Bhattacharyya P, Epstein W, Silver S. Valinomycin-induced uptake of potassium in membrane vesicles from Escherichia coli. Proc Natl Acad Sci USA. 1971;68:1488–1492. doi: 10.1073/pnas.68.7.1488. [DOI] [PMC free article] [PubMed] [Google Scholar]
- 23.Prost J, Bruinsma R. Shape fluctuations of active membranes. Europhys Lett. 1996;33:321–326. [Google Scholar]
- 24.Ramaswamy S, Toner J, Prost J. Nonequilibrium fluctuations, traveling waves, and instabilities in active membranes. Phys Rev Lett. 2000;84:3494–3497. doi: 10.1103/PhysRevLett.84.3494. [DOI] [PubMed] [Google Scholar]
- 25.Milner ST, Safran SA. Dynamical fluctuations of droplet microemulsions and vesicles. Phys Rev A Gen Phys. 1987;36:4371–4379. doi: 10.1103/physreva.36.4371. [DOI] [PubMed] [Google Scholar]
- 26.Girard P, et al. A new method for the reconstitution of membrane proteins into giant unilamellar vesicles. Biophys J. 2004;87:419–429. doi: 10.1529/biophysj.104.040360. [DOI] [PMC free article] [PubMed] [Google Scholar]
- 27.Dezi M, Di Cicco A, Bassereau P, Lévy D. Detergent-mediated incorporation of transmembrane proteins in giant unilamellar vesicles with controlled physiological contents. Proc Natl Acad Sci USA. 2013;110:7276–7281. doi: 10.1073/pnas.1303857110. [DOI] [PMC free article] [PubMed] [Google Scholar]
- 28.Seigneuret M, Rigaud JL. Use of the fluorescent pH probe pyranine to detect heterogeneous directions of proton movement in bacteriorhodopsin reconstituted large liposomes. FEBS Lett. 1985;188:101–106. [Google Scholar]
- 29.Kaim G, Dimroth P. ATP synthesis by the F1Fo ATP synthase of Escherichia coli is obligatorily dependent on the electric potential. FEBS Lett. 1998;434:57–60. doi: 10.1016/s0014-5793(98)00969-7. [DOI] [PubMed] [Google Scholar]
- 30.Hackl W, Seifert U, Sackmann E. Effects of fully and partially solubilized amphiphiles on bilayer bending stiffness and temperature dependence of the effective tension of giant vesicles. J Phys II. 1997;7:1141–1157. [Google Scholar]
- 31.El Alaoui Faris MD, et al. Membrane tension lowering induced by protein activity. Phys Rev Lett. 2009;102:038102. doi: 10.1103/PhysRevLett.102.038102. [DOI] [PubMed] [Google Scholar]
- 32.Bondar AN, Elstner M, Suhai S, Smith JC, Fischer S. Mechanism of primary proton transfer in bacteriorhodopsin. Structure. 2004;12:1281–1288. doi: 10.1016/j.str.2004.04.016. [DOI] [PubMed] [Google Scholar]
- 33.Helfrich W. Elastic properties of lipid bilayers—Theory and possible experiments. Z Naturforsch C. 1973;28:693–703. doi: 10.1515/znc-1973-11-1209. [DOI] [PubMed] [Google Scholar]
- 34.Helfrich W, Servuss RM. Undulations, steric interaction and cohesion of fluid membranes. Nuovo Cimento D. 1984;3:137–151. [Google Scholar]
- 35.Rao Y, Haucke V. Membrane shaping by the Bin/amphiphysin/Rvs (BAR) domain protein superfamily. Cell Mol Life Sci. 2011;68:3983–3993. doi: 10.1007/s00018-011-0768-5. [DOI] [PMC free article] [PubMed] [Google Scholar]
- 36.Sorre B, et al. How dynamin and amphiphysin sense and generate membrane curvature. Biophys J. 2011;100(Suppl 1):30a. [Google Scholar]
- 37.Aimon S, et al. Membrane shape modulates transmembrane protein distribution. Dev Cell. 2014;28:212–218. doi: 10.1016/j.devcel.2013.12.012. [DOI] [PMC free article] [PubMed] [Google Scholar]
- 38.Devaux PF, Herrmann A, Ohlwein N, Kozlov MM. How lipid flippases can modulate membrane structure. Biochim Biophys Acta. 2008;1778:1591–1600. doi: 10.1016/j.bbamem.2008.03.007. [DOI] [PubMed] [Google Scholar]
- 39.Lipowsky R. Spontaneous tubulation of membranes and vesicles reveals membrane tension generated by spontaneous curvature. Faraday Discuss. 2013;161:305–331, and discussion (2013) 161:419–459. doi: 10.1039/c2fd20105d. [DOI] [PubMed] [Google Scholar]
- 40.Lenz P, Joanny JF, Jülicher F, Prost J. Membranes with rotating motors. Phys Rev Lett. 2003;91:108104. doi: 10.1103/PhysRevLett.91.108104. [DOI] [PubMed] [Google Scholar]
- 41.Uchida N, Golestanian R. Synchronization and collective dynamics in a carpet of microfluidic rotors. Phys Rev Lett. 2010;104:178103. doi: 10.1103/PhysRevLett.104.178103. [DOI] [PubMed] [Google Scholar]
- 42.Goto Y, Tanaka H. Purely hydrodynamic ordering of rotating disks at a finite Reynolds number. Nat Commun. 2015;6:5994. doi: 10.1038/ncomms6994. [DOI] [PubMed] [Google Scholar]
- 43.Yeo K, Lushi E, Vlahovska PM. Collective dynamics in a binary mixture of hydrodynamically coupled microrotors. Phys Rev Lett. 2015;114:188301. doi: 10.1103/PhysRevLett.114.188301. [DOI] [PubMed] [Google Scholar]
- 44.Aragones JL, Steimel JP, Alexander-Katz A. Elasticity-induced force reversal between active spinning particles in dense passive media. Nat Commun. 2016;7:11325. doi: 10.1038/ncomms11325. [DOI] [PMC free article] [PubMed] [Google Scholar]
- 45.van Zuiden BC, Paulose J, Irvine WTM, Bartolo D, Vitelli V. Spatiotemporal order and emergent edge currents in active spinner materials. Proc Natl Acad Sci USA. 2016;113:12919–12924. doi: 10.1073/pnas.1609572113. [DOI] [PMC free article] [PubMed] [Google Scholar]
- 46.Espinosa G, López-Montero I, Monroy F, Langevin D. Shear rheology of lipid monolayers and insights on membrane fluidity. Proc Natl Acad Sci USA. 2011;108:6008–6013. doi: 10.1073/pnas.1018572108. [DOI] [PMC free article] [PubMed] [Google Scholar]
- 47.Matthies D, et al. Cell-free expression and assembly of ATP synthase. J Mol Biol. 2011;413:593–603. doi: 10.1016/j.jmb.2011.08.055. [DOI] [PubMed] [Google Scholar]
- 48.Spetzler D, et al. Microsecond time scale rotation measurements of single F1-ATPase molecules. Biochemistry. 2006;45:3117–3124. doi: 10.1021/bi052363n. [DOI] [PMC free article] [PubMed] [Google Scholar]
- 49.Ishmukhametov R, Hornung T, Spetzler D, Frasch WD. Direct observation of stepped proteolipid ring rotation in E. coli F0F1-ATP synthase. EMBO J. 2010;29:3911–3923. doi: 10.1038/emboj.2010.259. [DOI] [PMC free article] [PubMed] [Google Scholar]
- 50.Choi SQ, Steltenkamp S, Zasadzinski JA, Squires TM. Active microrheology and simultaneous visualization of sheared phospholipid monolayers. Nat Commun. 2011;2:312. doi: 10.1038/ncomms1321. [DOI] [PMC free article] [PubMed] [Google Scholar]
- 51.Rouser G, Fkeischer S, Yamamoto A. Two dimensional then layer chromatographic separation of polar lipids and determination of phospholipids by phosphorus analysis of spots. Lipids. 1970;5:494–496. doi: 10.1007/BF02531316. [DOI] [PubMed] [Google Scholar]
- 52.Towbin H, Staehelin T, Gordon J. Electrophoretic transfer of proteins from polyacrylamide gels to nitrocellulose sheets: Procedure and some applications. Proc Natl Acad Sci USA. 1979;76:4350–4354. doi: 10.1073/pnas.76.9.4350. [DOI] [PMC free article] [PubMed] [Google Scholar]
- 53.Schneider CA, Rasband WS, Eliceiri KW. NIH Image to ImageJ: 25 years of image analysis. Nat Methods. 2012;9:671–675. doi: 10.1038/nmeth.2089. [DOI] [PMC free article] [PubMed] [Google Scholar]
- 54.Johnson LV, Walsh ML, Chen LB. Localization of mitochondria in living cells with rhodamine-123. Proc Natl Acad Sci USA. 1980;77:990–994. doi: 10.1073/pnas.77.2.990. [DOI] [PMC free article] [PubMed] [Google Scholar]
- 55.Usenik P, Vrtovec T, Pernuš F, Likar B. Automated tracking and analysis of phospholipid vesicle contours in phase contrast microscopy images. Med Biol Eng Comput. 2011;49:957–966. doi: 10.1007/s11517-011-0789-0. [DOI] [PubMed] [Google Scholar]
- 56.Gov N. Membrane undulations driven by force fluctuations of active proteins. Phys Rev Lett. 2004;93:268104. doi: 10.1103/PhysRevLett.93.268104. [DOI] [PubMed] [Google Scholar]
- 57.Manneville JB, Bassereau P, Levy D, Prost J. Activity of transmembrane proteins induces magnification of shape fluctuations of lipid membranes. Phys Rev Lett. 1999;82:4356–4359. [Google Scholar]
Associated Data
This section collects any data citations, data availability statements, or supplementary materials included in this article.


