Significance
Arginine-rich cell-penetrating peptides are promising candidates for intracellular drug delivery. These cationic peptides spontaneously traverse biological membranes via a direct mode of entry which is not yet fully understood. In this study, we report the complex solution behavior of the cell-penetrating peptide deca-arginine. Despite its large net positive charge, deca-arginine self-associates at low-to-intermediate ionic strengths, owing to an interaction mode which is present in the structure of a significant number of proteins. Self-association may thus enhance the bioavailability of deca-arginine. Our findings provide the key to the understanding of the self-association mechanism in deca-arginine with implications for the potential biological roles of this unusual binding motif.
Keywords: cell-penetrating peptide, self-association, MD simulations, SAXS, NMR
Abstract
Small-angle X-ray scattering (SAXS) measurements reveal a striking difference in intermolecular interactions between two short highly charged peptides—deca-arginine (R10) and deca-lysine (K10). Comparison of SAXS curves at high and low salt concentration shows that R10 self-associates, while interactions between K10 chains are purely repulsive. The self-association of R10 is stronger at lower ionic strengths, indicating that the attraction between R10 molecules has an important electrostatic component. SAXS data are complemented by NMR measurements and potentials of mean force between the peptides, calculated by means of umbrella-sampling molecular dynamics (MD) simulations. All-atom MD simulations elucidate the origin of the R10–R10 attraction by providing structural information on the dimeric state. The last two C-terminal residues of R10 constitute an adhesive patch formed by stacking of the side chains of two arginine residues and by salt bridges formed between the like-charge ion pair and the C-terminal carboxyl groups. A statistical analysis of the Protein Data Bank reveals that this mode of interaction is a common feature in proteins.
Recent studies focusing on interactions of charged proteins in electrolyte solutions have highlighted the interplay of two counteracting electrostatic forces (1–4). The first one originates from the presence of a localized distribution of charges defining an electrostatic patch on the protein surface. Depending on relative orientations, the charge distributions in the patches on the protein molecules can become complementary, thereby leading to an attractive electrostatic force (5). This anisotropic force is short ranged and is hereafter referred to as the electrostatic adhesive force. The other force is the double-layer force arising from the Coulombic repulsion between like-charged molecules in the electrolyte medium. Both electrostatic adhesive and double-layer forces are weakened by the presence of salt in the solution. As a nontrivial consequence, the propensity of the proteins to aggregate is heightened at low-to-intermediate ionic strengths (1–3, 6). This is because of lowering of Coulombic repulsion due to salt screening of the net charge of the protein, in conjunction with the presence of the adhesive force, which operates at shorter distances and is therefore less efficiently screened.
In this work, the competition between electrostatic adhesive and double-layer forces, together with a chemically specific like-charge attraction between guanidinium (Gdm+) side-chain groups, is reported for solutions of a small highly charged peptide. Observation of the complex aggregation behavior for a relatively simple molecule is substantiated by a comparative investigation of deca-arginine (R10) and deca-lysine (K10), in high and low ionic strength solutions, conducted using small-angle X-ray scattering (SAXS) measurements, all-atom molecular dynamics (MD) simulations, and 1H-13C heteronuclear single quantum coherence (HSQC) NMR measurements.
The choice of the peptides is motivated by the biological interest in the high cellular uptake of arginine-rich peptides (RRPs), which has been the subject of several comparative studies (7–11). Oligo-arginine chains of 6–15 aa readily translocate across cell membranes (7, 12), while the translocation efficiency of oligo-lysines of equal length is considerably lower (7, 13). If a certain threshold peptide concentration is exceeded, cell penetration of RRPs can occur in a nonendocytotic mode (14). Although the molecular details of this transduction mechanism still need to be clarified, an important feature has been identified as the Gdm+ moiety of the arginine side chain, which can form bidentate hydrogen bonds with phosphate and glycerol groups of the lipid molecules in the cell membrane. These interactions may promote the adsorption of RRPs on the membrane surface and perturb the packing of lipids in the bilayer (10), as well as significantly increase the lifetime of transient membrane pores (15). Further, it has been proposed that transduction is enhanced by a cooperative action between RRPs (15). This occurs when the timescale of the peptide-induced kinetic stabilization of the pores is faster than the timescale of the lateral diffusion of adsorbed peptides to a transient pore. Since the coverage of the membrane surface by the peptides influences the proposed phenomenon, the aggregation of oligo-arginines may contribute to their superior uptake rate, compared with oligo-lysines. In fact, MD simulations support the tendency for oligo-arginine molecules to dimerize, as reported for R10 adsorbed on negatively charged lipid bilayers (9, 16).
In the following sections, we first present experimental findings based on SAXS measurements on solutions of R10 and K10, as well as of R8KR and K8RK molecules. The latter two molecules are mutants of R10 and K10, respectively, resulting from a ninth residue interchange. Based on the SAXS results, we infer that an attraction, which is mainly of electrostatic origin, is present between R10 molecules, while the other molecules solely repel each other. Moreover, SAXS data for R10 at low ionic strength are consistent with the presence of dimers or oligomeric forms in solution.
Subsequently, we report HSQC NMR data and potentials of mean force (PMFs) obtained from all-atom MD simulations, which support the interpretation of the scattering data and provide an atomistic description of R10 dimers. Finally, we analyze the occurrence of the inferred mode of interaction in biological systems by inspection of protein crystal structures in the Protein Data Bank (PDB).
Results
Scattering Intensity Curves.
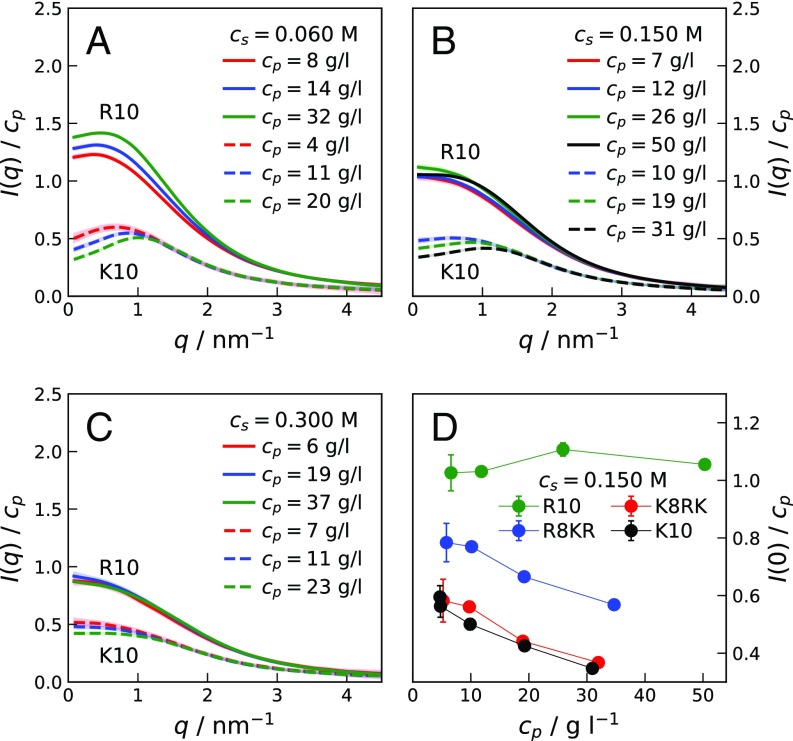
Fig. 1 shows SAXS measurements on R10 and K10 concentration series at increasing ionic strength, , at 293 K and pH 7.8. The scattering intensities , normalized by the peptide concentration, , are reported as a function of the scattering vector, .
Fig. 1.
(A–C) Concentration-normalized scattering intensities for R10 (solid lines) and K10 (dashed lines) at various peptide concentrations, , in 0.020 M Tris buffer solutions of 0.060 M (A), 0.150 M (B), and 0.300 M (C) ionic strength, . (D) Extrapolated values for samples of R10, K10, R8KR, and K8RK of increasing at M. Lines connecting points in D are guides to the eye.
At M and M, the crowding effect on the scattering profiles of the two peptides is strikingly different. At low values, decreases with increasing for K10, while it increases for R10. Scattering intensity curves obtained for K10 are as expected for polyelectrolyte solutions of low ionic strength (17, 18), displaying an increasingly pronounced maximum that shifts to higher with increasing . Maxima are also observed in for R10; however, with increasing the shift of the maxima to higher is less pronounced than for K10. At M, at low decreases with increasing for K10, while an oscillating trend is observed for R10. Fig. 1D shows values extrapolated to (SI Materials and Methods) for solutions of R10, K10, R8KR, and K8RK for increasing at M. While for K10 and K8RK values are similar to each other (as expected), the discrepancy in values between R10 and R8KR is large compared with the small difference in molecular weights (SI Materials and Methods and Fig. S1). Finally, vs. has the same decreasing trend for K10, R8KR, and K8RK, while it has an increasing trend for R10 (SI Results and Fig. S2).
Fig. S1.
(A) Guinier plots of R10 (red line), R8KR (blue line), K10 (green line), and K8RK (black line) from SAXS curves at the lowest measured at M. The s obtained from the linear fit (black thin lines) are 0.82 0.01 nm, 0.80 0.01 nm, 0.75 0.01 nm, and 0.73 0.01 nm for R10, R8KR, K10, and K8RK, respectively. Calculated s are 1,581 2 Da, 1,353 3 Da and 1,327 4 Da, 1,250 3 Da for R10, R8KR, K10, and K8RK, respectively. (B) Log–log plot of SAXS curves at the lowest measured at M.
Fig. S2.
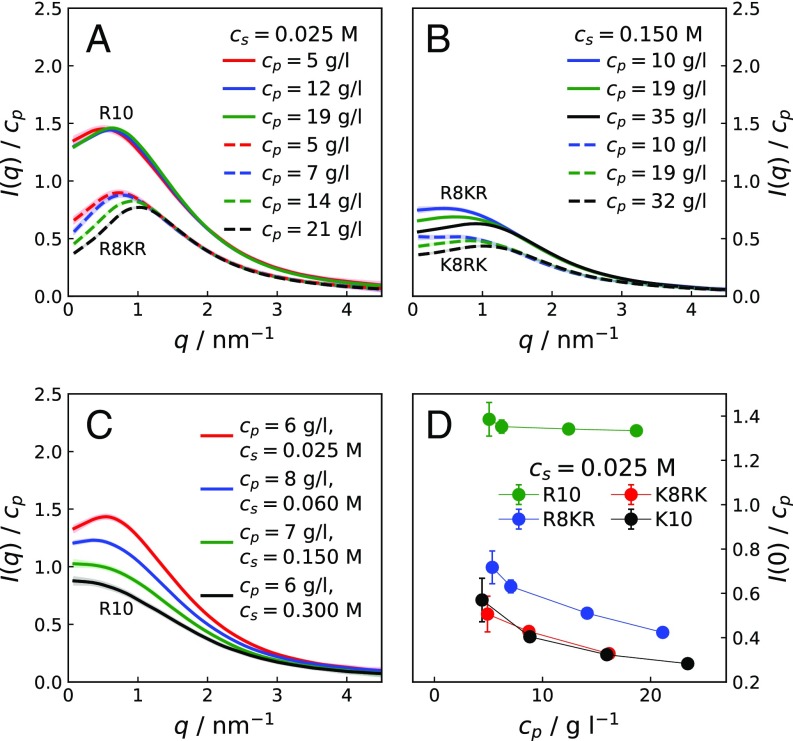
(A and B) Concentration-normalized scattering intensities for R10 (solid lines) and R8KR (dashed lines) at M (A) and for R8KR (solid lines) and K8RK (dashed lines) at M (B) for various . (C) Concentration-normalized scattering intensities for R10 at similar and increasing . (D) Extrapolated values for samples of R10, K10, R8KR, and K8RK of increasing at M. Lines connecting points in D are guides to the eye.
PMFs.
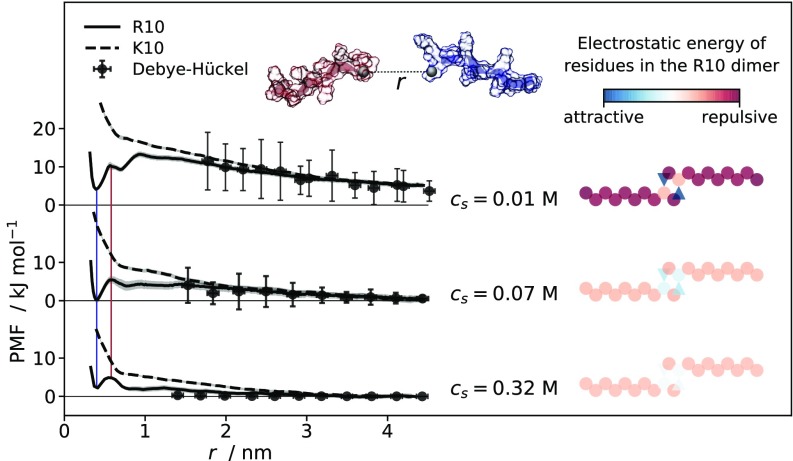
Fig. 2 shows the PMFs obtained from umbrella-sampling MD simulations for pairs of R10 and K10, as a function of the intermolecular separation (SI Materials and Methods and Fig. S3). The intermolecular separation for R10 corresponds to the distance between the guanidino-C atoms of the ninth residues. This reaction coordinate was chosen based on inspection of the R10 dimer observed in previous MD simulations (9). Analogously, the intermolecular separation for K10 is calculated as the distance between the -C atoms of the ninth residues. At M, the free energy of interaction between pairs of K10 molecules is repulsive and decays with increasing interparticle separation, as expected for two like-charged molecules in solution. In contrast, the PMF for R10 chains shows at low ionic strength a minimum at 0.4 nm, followed by two maxima at separations of 0.58 nm and 0.93 nm. As evidenced by the red and blue lines in Fig. 2, the positions of the minima are preserved at higher . At M, PMFs of both R10 and K10 show lower free energy values than at , corresponding to a decreased repulsion between the like-charged molecules due to electrostatic screening. At M, the decay of the repulsive interaction with increasing intermolecular separation is considerably steeper than for the PMFs at lower ; nonetheless the free energy of the minimum at 0.4 nm separation between R10 molecules is higher compared with M. At large separations, the PMFs agree with the Debye–Hückel approximation, shown by the black points in Fig. 2. The vertical error bars reflect the fluctuation of separations between the center of mass of the peptides in the umbrella-sampling simulation windows. While K10 molecules repel each other at all length scales and salt concentrations, R10 displays salt-dependent attraction at short separation. The free energy of the minimum at 0.4 nm varies nonmonotonically with , and it is the lowest at M. On the contrary, the difference in free energy between the maximum at 0.58 nm and the minimum at 0.4 nm decreases with increasing . To facilitate further discussion of the nonmonotonic trend for the free energy minimum, Fig. 2 displays 2D schematic representations of the R10 dimeric structures.
Fig. 2.
(Left) PMFs calculated from umbrella-sampling MD simulations for pairs of R10 (solid line) and K10 (dashed line) molecules at M, M, and M as a function of the separation between the guanidino-C and the -C atoms of the ninth residues. Shaded areas along the PMFs represent standard deviations (SD) of bootstrapped free energy profiles. Colored vertical lines connect maxima and minima that are common to all PMFs. Points represent free energy values calculated using the Debye–Hückel approximation, while error bars reflect SD of mass–center separations between peptides in the umbrella-sampling simulation windows. (Top Center) Generic representation of the deca-peptides where the ninth residues’ guanidino-C/-C atoms are the black spheres and the dashed line between them represents the reaction coordinate, . (Right) Schematic illustration of R10 dimeric structures. The circles and triangles represent positively charged arginine residues and negatively charged C-terminal carboxyl groups, respectively; while the coloring is based on the Debye–Hückel free energy calculated for each charge site interacting with all of the others, in the geometry adopted for the illustration.
Fig. S3.
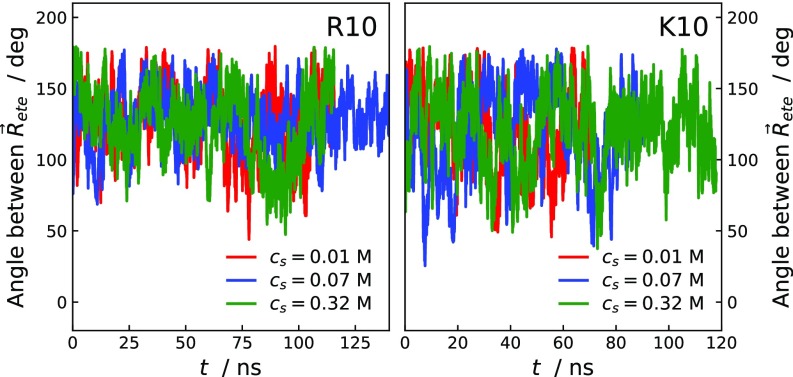
Relative orientation of pairs of R10 and K10 peptides at close separation estimated by the angle between the end-to-end vectors. The calculation was performed over trajectories from umbrella-sampling simulation windows at the lower end of the reaction coordinate.
Hydrogen Bonding in Dimeric Structures.
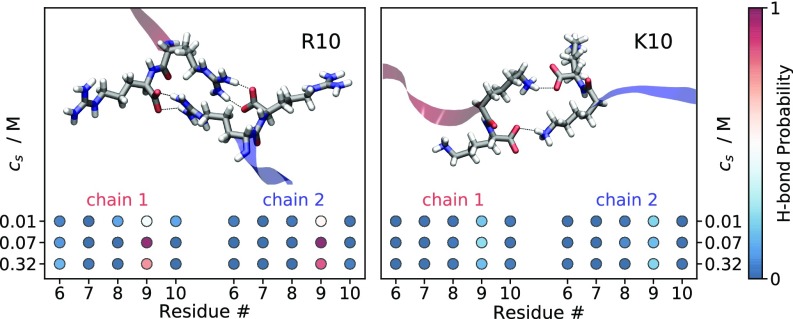
Fig. 3 displays the probability to form an H bond between the C-terminal carboxyl group (COO−) of the first peptide and the last five C-terminal residues of the second peptide. The H-bond probabilities are calculated from umbrella-sampling MD simulation windows, where the model peptides are at the closest separation along the reaction coordinate. It is evident for both R10 and K10 that the C-terminal COO− of the first peptide is most likely to form H bonds with the ninth residue of the second peptide. A nonmonotonic dependence on is observed for the H-bond probability between the C-terminal COO− and the ninth residue. Specifically for R10 it increases approximately twofold from M to M, while at M it drops back to an intermediate value. The H-bond probability between the COO− group and the ninth residue is significantly larger for R10 than for K10. Representative snapshots from the analyzed trajectories are included in Fig. 3 to show the H-bonding pattern in the C-terminal residues of R10 and K10. In the R10 dimer, H bonds are formed between the C-terminal COO− and the Gdm+ moiety of the arginine side chains and are likely to be bidentate; whereas, in the K10 dimer, monodentate H bonds are formed between the C-terminal COO− and the amino group of the lysine side chains.
Fig. 3.
Snapshots from MD simulations illustrating the interaction between C-terminal residues of two R10 and two K10 molecules at close separation. Dashed lines represent the hydrogen bonds between the negatively charged carboxyl groups and the positively charged guanidinium and ammonium moieties of the ninth residues. Colored circles represent the probability of H bonds between the carboxyl groups of one peptide and the last five residues of the other peptide. Snapshots and probabilities are obtained from MD simulations with separations of 0.43 0.04 nm and 0.74 0.06 nm between the ninth residues’ guanidino-C and -C atoms, respectively.
1H-13C HSQC NMR Spectra.
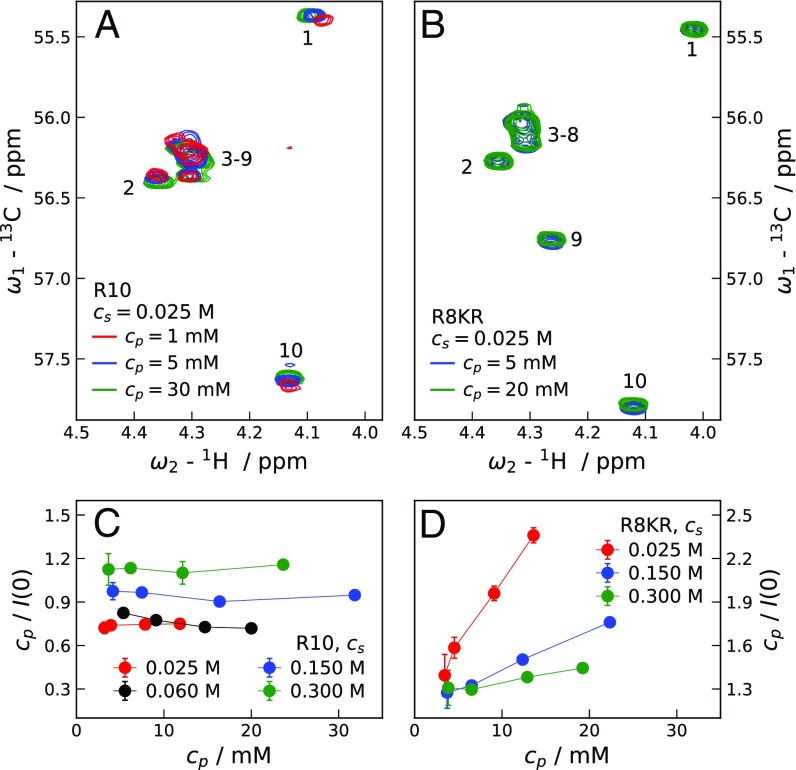
Fig. 4 shows the regions of 2D 1H-13C HSQC NMR spectra of R10 and R8KR corresponding to correlations between C and H atoms. Peptide solutions have M, pH 5, and are measured at 293 K (SI Results and Fig. S4 for corresponding SAXS curves). With increasing , R8KR spectra superpose almost perfectly, indicating the absence of significant peptide–peptide attractions for R8KR. For R10 small changes in chemical shifts are observed for both N-terminal and C-terminal residues. As is proportional to the derivative of the osmotic pressure, , with respect to , Fig. 4 C and D help to interpret the NMR data. At the lowest , R10 solutions have significantly lower at M than at M, while dilute R8KR solutions display a less pronounced and opposite trend for vs. . This suggests that at M dimers may be present in the dilute -mM R10 solution, which also displays a different chemical shift for the N-terminal residue compared with the R8KR solution of mM. The weak dependence of on observed for R10 at M might be due to the repulsive nature of monomer–dimer and dimer–dimer interactions, as well as to a slight increase in dimer population. The latter is also reflected in the small changes in chemical shifts observed for R10 in the explored range (Fig. 4A).
Fig. 4.
(A and B) Regions corresponding to the correlations between C and H atoms of 2D 1H-13C HSQC NMR spectra of R10 (A) and R8KR (B) at various peptide concentrations, , pH 5, and ionic strength 0.025 M. Cross-peaks are labeled with the residue numbers to which they are assigned. (C and D) Extrapolated values for samples of R10 (C) and R8KR (D) of increasing and at pH 7.8. Error bars represent SD. Lines connecting points in C and D are guides to the eye.
Fig. S4.
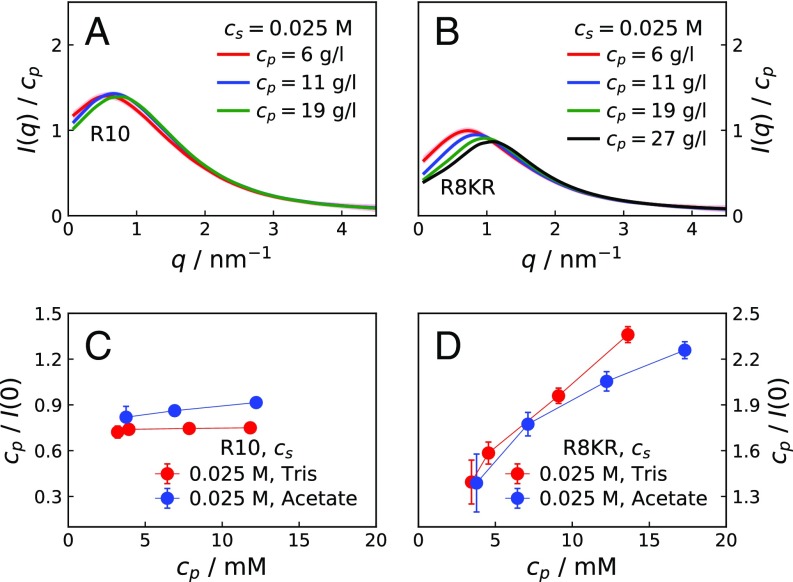
(A and B) Concentration-normalized scattering intensities for R10 (A) and R8KR (B) solutions of various peptide concentrations, , in 0.035 M acetate buffer solutions of 0.025 M ionic strength, . (C and D) Extrapolated values for solutions of various of R10 (C) and R8KR (D) in acetate or Tris buffer at M. Error bars represent SD. Lines connecting points in D are guides to the eye.
Occurrence of the Observed Mode of Interaction in Proteins.
We searched a selection of 10,388 entries of the PDB (SI Materials and Methods) for the observed mode of interaction in R10 dimers, consisting of H bonding of two C-terminal COO− groups with a Gdm+–Gdm+ ion pair. It was found to be present in 231 of the 1,697 protein crystal structures featuring at least one pair of stacked arginine residues (complete list in SI Results). The analysis focused on the COO− groups of aspartate and glutamate side chains. However, in two proteins (PDB entries 5INJ and 4AZS), the Gdm+–Gdm+ pair is in the active site and interacts with the COO− of the substrate. These enzymes are prenyltransferase PriB (19) and bifunctional methyl-transferase/kinase WbdD (20), while the substrates are tryptophan and S-adenosylmethionine, respectively.
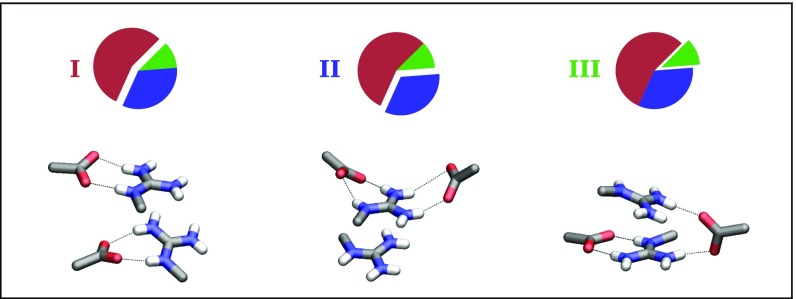
Fig. 5 shows three characteristic structures which exemplify the geometries of the interacting Gdm+ and COO− moieties found in the crystal structures. In the most frequent arrangement I, each COO− is H bonded with a different Gdm+ moiety. In arrangement II, only one Gdm+ moiety is involved in the interaction with two COO− groups. Finally, in the least-occurring arrangement III, one of the COO− groups is H bonded with one Gdm+, whereas the second COO− is approximately perpendicular to the molecular planes of the two Gdm+ and forms H bonds with both Gdm+ moieties in the ion pair. The residues involved in the interactions belong to different protein chains in 45.4% of the occurrences, while in the remaining 54.6% the interaction is between residues of the same chain. The analysis further showed that geometrical arrangements involving like-charge ion pairing of lysine side chains, stabilized by salt bridges with COO− groups of aspartate and glutamate, are considerably less frequent than the mode of interaction characterized by arginine stacking (SI Results).
Fig. 5.
Summary illustration of the analysis of the PDB of the interaction between the Gdm+ ion pair and the two carboxyl groups. The 231 selected protein structures are divided into three categories differing in the geometrical arrangement of the groups involved in the interaction. From Bottom to Top: Structures exemplifying the geometrical arrangements and pie charts showing the incidence of the arrangements.
SI Materials and Methods
Materials.
R10 (1.58 kDa), K10 (1.3 kDa), R8KR (1.552 kDa), and K8RK (1.328 kDa) were purchased from American Peptide Company Inc. Sodium chloride (NaCl) and tris(hydroxymethyl)aminomethane (Tris) of analytical grade are manufactured by Scharlau and Saveen Werner AB, respectively. The water used was of MilliQ grade. For SAXS experiments, buffer solutions contained 0.02 M Tris which, besides keeping a constant pH, acts as hydroxyl radical scavenger (38), lowering the risk of radiation damage (39). NaCl was added to obtain ionic strength, , of 0.025 M, 0.06 M, 0.15 M, and 0.3 M. The pH was set to 7.8 by addition of 1 M HCl in volumes of 3.5 mL and 3.9 mL to low- and high- solutions, respectively. For NMR experiments, we used 0.035 M acetate buffer solutions, pH 5, prepared by mixing glacial acetic acid (Scharlau SA) and 1N NaOH (Merck KGaA). The buffer has M, and NaCl (Scharlau) was added to obtain M.
Sample Purification Procedure.
For each dilution series in peptide concentration, , around 40 mg of peptide powder was dissolved in 2 mL MilliQ water. To remove the buffer and salts in the peptide powder, the aqueous solution was ultrafiltrated with Vivaspin 2 Hydrosart Columns (molecular weight cutoff of 2 kDa). Ultrafiltration was performed at 277 K and 3,500 g, adding aliquots of buffer solution until a volume of 5 mL had flowed through the column. The 150-L concentrate was dialyzed on a rocking plate with Slide-A-Lyze MINI Dialysis Devices (Hydrosart membrane with molecular weight cutoff of 2 kDa) for at least 20 h at 277 K against 3.4 mL of the same buffer solution used for the ultrafiltration. Serial dilutions of R10 and K10 in the concentration range 2.5–45 g/L were made from the concentrated dialyzed solutions and the buffer solution in contact with the semipermeable membrane. This protocol provides peptide solutions of well-defined composition as well as buffer solutions that exactly match the background solution.
Peptide Concentration Measurements.
The peptide concentration was measured from the adsorbance at 214 nm, using a Nano-Drop 2000 Spectrophotometer. The extinction coefficients were determined by amino acid analysis (Aminosyraanalyscentralen). Before SAXS measurement, each sample was centrifuged (14,000 g for 45 min at 277 K). The supernatant was collected, stirred, and quantified for peptide concentration immediately before the SAXS measurement. Peptide absorption at 214 nm is mainly due to the transition in the peptide bond, with minor contributions from the arginine and lysine side chains as well as from the carboxyl group (40). The measured molar extinction coefficients are 10,800 100 M−1⋅ (SD) and 9,400 100 M−1⋅ (SD) for arginine- and lysine-rich peptides, respectively. Our measured extinction coefficients differ by less than 14% from those estimated according to Kuipers and Gruppen (40).
Small-Angle Scattering Measurements.
Scattering measurements were performed in beamline BM29 (41) at the European Synchrotron Radiation Facility (ESRF), Grenoble, France. The distance between the Pilatus 1M detector and the sample was set to 2.872 m, while the wavelength of the incident beam was 0.099 nm. The range of the scattering vector was nm. The sample holder was thermostated at 293 K. For each measurement, 10 frames separated in time were collected and compared to assess the absence of radiation damage. Each measurement required 50 L of sample and, with the aim of improving the signal-to-noise ratio, measurements on 3-mM solutions were repeated three times. The buffer was measured before and after each sample measurement, and the average intensities of the buffer were subtracted from the intensities of the sample using PRIMUS (ATSAS package 2.7.1) (42). The reproducibility of the results was verified by measuring SAXS on samples obtained from independent preparation procedures, during three beam times in September 2015, April 2016, and November 2016. The SAXS curves reported in Fig. 1 and Figs. S2 and S4 were smoothed using the LOWESS method (43). values reported in Figs. 1 and 4 and Figs. S2 and S4 are obtained from averaging in the range nm.
1H-13C HSQC NMR Measurements.
NMR measurements were performed at 293 K on Agilent or Bruker spectrometers operating at 600 MHz (room temperature probe). Solutions of R10 and R8KR molecules are prepared in 0.035 M acetate buffer solutions, pH 5. The ionic strength of the buffer is M. Samples of M are obtained by addition of NaCl.
SAXS-Derived Molecular Weights.
The monodispersity of our samples at high and low was probed by evaluating the molecular weights of the peptides from the scattering intensity extrapolated at = 0 via Guinier plots. We used (44), where is the molecular weight of the peptide, is the absolute scattering intensity at zero angle calculated using the Guinier approximation, is the partial specific volume [K10 and K8RK, 0.84 /g, R10 and R8KR, 0.80 /g (45)], is the scattering density of the peptide (K10, 11.3 × ; R10, 12.1 × ) while is the scattering density of a 300-mM NaCl solution [9.51 × (46)]. The Guinier plots (Fig. S1A) for R10 and K10 samples with the lowest measured and M were linearly fitted to (39), where is the peptide radius of gyration. The small discrepancies between SAXS-derived s and theoretical values can be attributed to the uncertainty on the partial specific volume or to the presence of intermolecular interactions (44). Fig. S1B shows the log–log plot of the scattering intensities used for the Guinier plots. The plateaus in the low- range confirm that the samples were monodisperse.
MD Simulation Protocol.
R10 and K10 are modeled with the all-atom force field A03 with the correction of protein–water interaction proposed by Best et al. (34) and the TIP4P/2005 water model. The correction consists of increasing the Lennard–Jones parameter by 10%, between oxygen atoms of water molecules and all peptide atoms. R10 and K10 have a net charge number of +10. The carboxyl group is negatively charged, while the amino acid side chains and the N-terminal amine group are protonated. Umbrella sampling (47) was used to calculate the PMF as a function of separation between guanidino-C and -C of the ninth residues of R10 and K10, respectively.
MD simulations were performed with the GROMACS package (48), version 4.6.5. Systems were generated containing two chains which were hydrated in rhombic dodecahedral boxes of volume 1,200 nm3 with 20 ( M), 62 ( M), and 246 or 239 (R10 and K10 at M, respectively) chloride ions and sodium ions to attain electroneutrality. After energy minimization of the initial configurations with the steepest-descents algorithm, systems were simulated in the ensemble, using the velocity rescaling thermostat (49) at 293 K with relaxation time of 0.1 ps and Parrinello–Rahman pressure coupling (50) at 1 bar with relaxation time of 2 ps and isothermal compressibility of 4.5 × . Coulomb interactions were treated with the particle-mesh Ewald (51) method with fourth-order B-splines interpolations, direct space cutoff of 1 nm, and error tolerance . Lennard–Jones interactions were calculated within a cutoff of 1 nm. All bonds were constrained using the LINCS algorithm (52). Starting from the last configuration of the simulation, the pulling was carried out in the ensemble, at a rate of 2 nm, by applying a harmonic potential of force constant kJmol−1⋅ with equilibrium distance of 0.4 nm. Configurations with ninth residues’ guanidino-C/-C separations differing by 0.2 nm were extracted from the pulling trajectory and used to start the umbrella-sampling simulations, in the ensemble. The two peptides are kept at a given average ninth residues’ guanidino-C/-C separation by a harmonic potential of force constant 5 × kJmol−1⋅. The PMF was constructed using the WHAM method (53), estimating the uncertainty by performing 10 bootstraps of the free energy profile. The convergence of the PMFs was evaluated by inspecting the effect of increasing the simulation time of the umbrella-sampling windows by 20 ns. A simulation time of at least 70 ns was sampled for each umbrella-sampling window. The degree of thoroughness of sampling is shown in Fig. S3 by the time evolution of the angle between the end-to-end vectors of two peptides, , calculated from umbrella-sampling windows at the lower end of the reaction coordinate. Molecular structures were rendered using the computer program VMD (54).
Hydrogen Bond Probabilities.
H bonds between C-terminal carboxyl groups and amine groups on the residues’ side chains are identified based on the criterion outlined previously (55), using the routine implemented in MDTraj (56). The analysis is performed on umbrella-sampling simulations where the peptides are at the closest distance along the reaction coordinate. A maximum of one H bond is counted for each residue in each frame, so that monodentate and bidentate H bonds are weighted equally.
Analysis of the Protein Data Bank.
The PISCES web server (57) was used to obtain a list of PDB X-ray crystal structures with maximum 25% sequence identity, minimum resolution of 0.25 nm, and R factor lower than 0.25. The list was generated on July 5, 2017 and included 10,388 entries. The corresponding PDB files were downloaded from the Research Collaboratory for Structural Bioinformatics PDB (58) and parsed using a Python script. MDTraj v1.7.2 (56) was used to search arginine guanidino-C atoms or lysine -C atoms closer than 0.4 nm, as well as to identify H bonds between like-charged ion pairs and carboxyl groups of glutamate or aspartate residues. In the case of arginine and lysine pairing, 1,594 of 1,697 and 395 of 423 protein crystal structures, respectively, were missing hydrogen atoms. Hydrogen atoms were added to the protein structures, using PDBFixer v1.4, a routine of the OpenMM molecular simulation toolkit (59). Proteins presenting at least one pair of stacked arginine/lysine residues forming H bonds with two carboxyl groups were selected.
Debye–Hückel Predictions.
The Debye–Hückel approximation is used to estimate free energies of interaction between peptides at large separations. Each umbrella-sampling window corresponds to a restricted position along the reaction coordinate and to a more extensively fluctuating mass–center separation, . The Debye–Hückel free energy was calculated, for each umbrella-sampling window, using the average mass–center separation, , and , where = 10 is the net charge number of the peptides, nm is the Bjerrum length for water at K, is the Debye screening length of a solution of ionic strength , and is the gas constant. Electrostatic free energies at the th charge site, in the schematic illustration of the R10 dimer shown in Fig. 2 in the main text, were calculated with , where is the distance between the th and th sites, of charges and , respectively.
Datasets and Jupyter Notebooks for reproducing the analyses of SAXS data, MD simulations, and PDB, as well as all presented plots can be accessed at Zenodo, https://doi.org/10.5281/zenodo.825460.
SI Results
Scattering Intensity Curves.
Fig. S2 A and B presents SAXS measurements on R10, R8KR, and K8RK concentration series for M and M at 293 K and pH 7.8. At low values, with increasing , decreases for both R8KR and K8RK, while it increases for R10. Fig. S2C shows the effect of on the scattering curves of R10 at g/L: For , increases with increasing , indicating that self-association is heightened at low-to-intermediate ionic strength. Fig. S2D shows values extrapolated to for solutions of R10, K10, R8KR, and K8RK of increasing at M. As observed at M, values for R10 are much larger than expected based on the molecular weight, indicating oligomerization. Fig. S4 A and B shows SAXS curves for R10 and R8KR molecules in 0.035 M acetate buffer, pH 5, i.e., at the same solution conditions of the 1H-13C HSQC NMR measurements. Comparison with Fig. S2A shows that scattering curves for R10 and R8KR are very similar in 0.020 M Tris buffer, pH 7.8, and in 0.035 M acetate buffer, pH 5. Interestingly, R10 solutions in acetate buffer yield higher values than in Tris buffer, suggesting that the acetate cosolute may compete with the C-terminal carboxyl groups and hamper the dimerization of R10.
Force-Field Dependence of the PMFs.
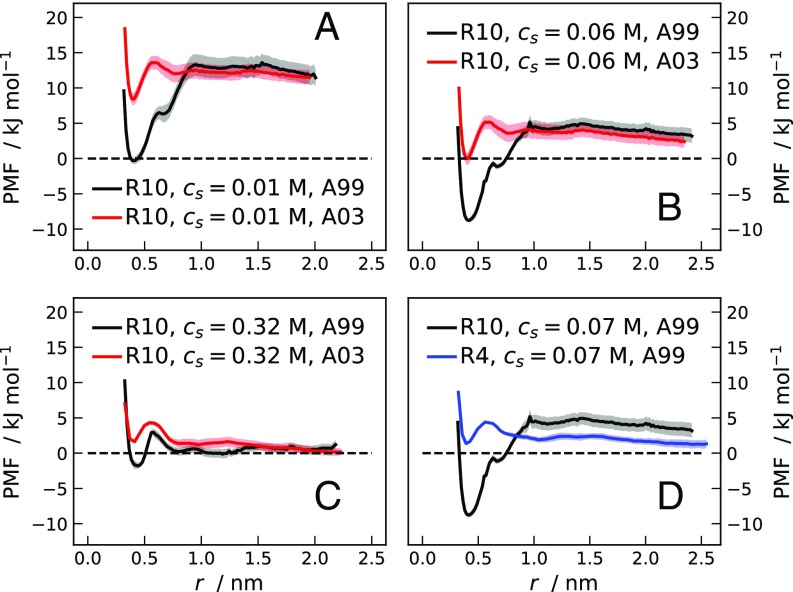
The preference of the AMBER ff03WS force field over the OPLS/AA or CHARMM22 force fields, used in previous comparative simulation studies on homopolymers of arginine and lysine (9, 10), is motivated by two reasons. First, the correction proposed by Best et al. (34) has been shown to be able to reproduce the conformational properties of small intrinsically disordered proteins, whereas widely used force fields developed for globular proteins generate significantly less extended structures (34, 35). Second, the OPLS/AA and CHARMM22 force fields, as opposed to the AMBER ff03 force field, have been shown to overestimate the probability of arginine/aspartate association (30).
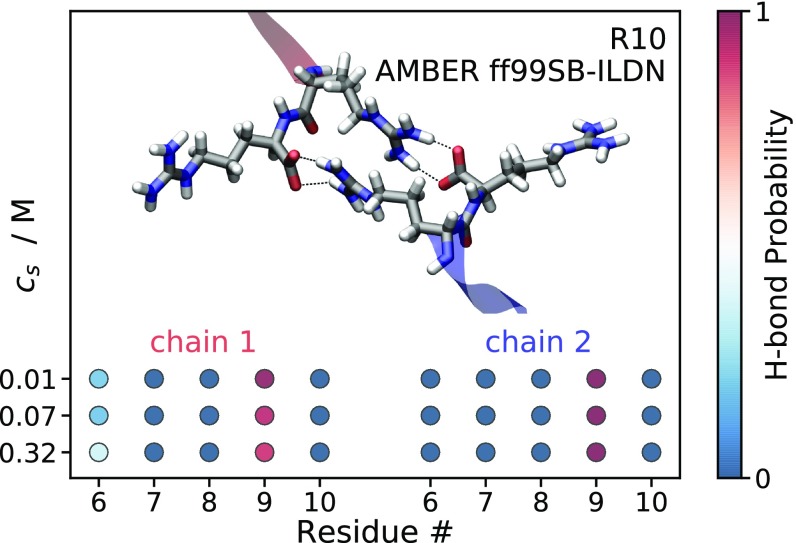
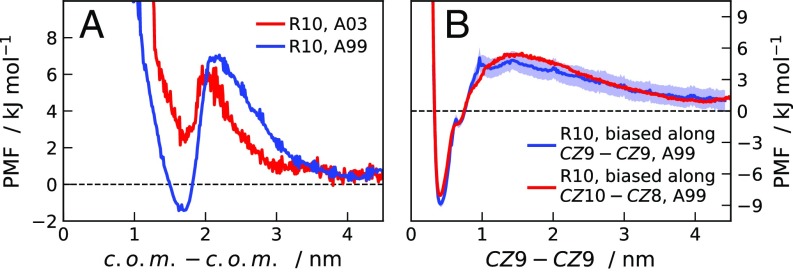
Umbrella-sampling MD simulations of the R10 systems were additionally performed with the AMBER ff99SB-ILDN force field and the TIP4P-Ew water model. Fig. S5 shows a comparison between PMFs for R10 obtained using the AMBER ff03WS (A03) and AMBER ff99SB-ILDN (A99) force fields. The latter predicts a stronger adhesive attraction between R10 molecules and more stable salt bridges (Fig. S6); however, the nonmonotonic trend in the free energy values of the minimum at 0.4 nm separation is yielded by both force fields.
Fig. S5.
(A–C) PMFs for pairs of R10 molecules as a function of the separation between the guanidino-C atoms of the ninth residues. PMFs are from umbrella-sampling MD simulations, using the A99 (black line) and A03 (red line) force fields, at M (A), M (B), and M (C). (D) PMFs for pairs of R10 (black line) and R4 (blue line) from simulations with the A99 force field at M.
Fig. S6.
Snapshot from MD simulations illustrating the interaction between C-terminal residues of two R10 molecules at close separation. Dashed lines represent the hydrogen bonds between the negatively charged carboxyl groups and the positively charged guanidinium moieties of the ninth residues. Colored circles represent the probability of H bonds between the carboxyl groups of one peptide and the last five residues of the other peptide. Probabilities are obtained from MD simulations performed using the A99 force field and constraining the separations between the ninth residues’ guanidino-C atoms to 0.42 0.04 nm.
PMF Between Tetra-Arginine Molecules.
Fig. S5 shows the PMF between two tetra-arginine (R4) molecules at M as a function of separation between guanidino-C atoms of the third residues. The free energy profile has a considerably shallower local minimum compared with the PMF for R10 at similar . This result suggests that the arginine side chains contribute in an additive fashion to lowering the electrostatic repulsion. Moreover, the lower propensity to self-associate of R4, compared with R10, might be related to the lower bioavailability observed experimentally.
Additional Interaction Modes Between R10 Molecules.
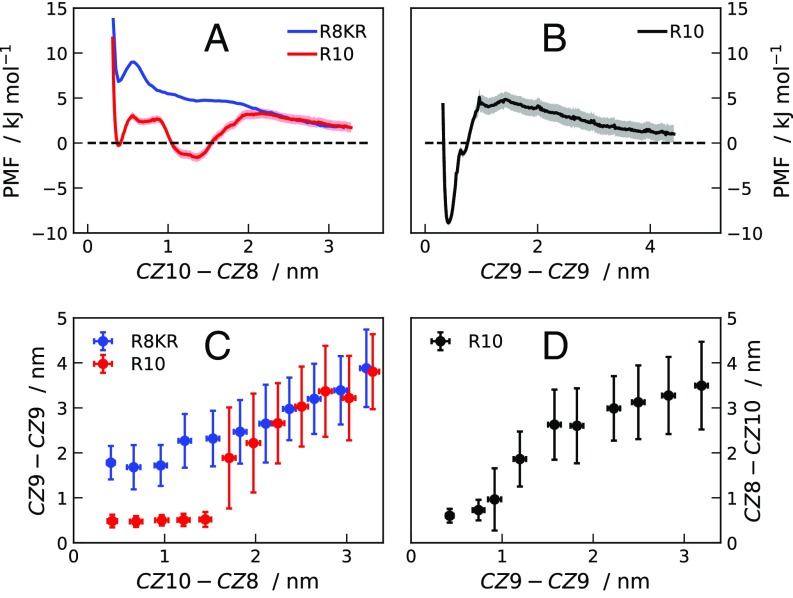
Side-chain stacking of the ninth arginine residues is necessary for the attractive interaction. On top of it, as shown by the scattering curves for K8RK molecules, the other arginine residues have a fundamental role in lowering the electrostatic repulsion. Fig. S8A shows a comparison between PMFs for R10 and R8KR calculated as a function of the distance between guanidino-C atoms of the 10th, , and 8th, , residues of the two molecules. While R8KR molecules repel each other at all separations, for R10 we observe two minima between – = 0.4 nm and nm. Fig. S8C shows that the average – separation is close to the stacking distance in the umbrella-sampling simulations where R10 molecules are constrained at nm, whereas nm in the corresponding simulations for R8KR molecules. These data confirm that the driving force for the self-association of R10 is the specific interaction involving the ninth residues. Fig. S8 B and D indicates that, also in umbrella-sampling simulations where the is constrained, the copresence of nm and nm leads to a free energy minimum.
Fig. S8.
(A) PMFs for pairs of R10 (red line) and R8KR (blue line) molecules as a function of the separation between the guanidino-C atoms of the 10th and 8th residues (). (B) PMFs for pairs of R10 (black line) molecules as a function of the separation between the guanidino-C atoms of the ninth residues (). PMFs are from umbrella-sampling MD simulations, using the A99 force field, for systems at M. (C) Average calculated from simulations of R8KR (blue points) and R10 (red points) molecules at constrained . (D) Average calculated from simulations of R10 (black points) molecules at constrained .
Interaction Between N Terminus and Binding Region.
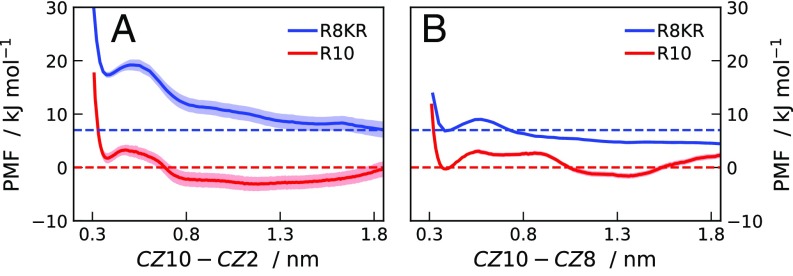
Fig. S10A presents PMFs for R10 and R8KR molecules, at a fixed nm, as a function of the – intermolecular separation. In the R10 dimer, the N terminus favorably interacts with the binding region: When is constrained at 0.4 nm, the free energy profiles vs. have a local minimum at stacking separation, as well as a wider and deeper minimum between nm and nm.
Fig. S10.
(A and B) PMFs for pairs of R10 (red lines) and R8KR (blue lines) molecules as a function of the separation between the guanidino-C atoms of the 10th and 2nd residues () (A) and of the 10th and 8th residues () (B). PMFs are from umbrella-sampling MD simulations, using the A99 force field, for systems at M. PMFs in A are shifted to make the free energy at large separation coincide with the free energy of the local minimum at nm in the corresponding PMFs in B.
PMFs as a Function of Peptide–Peptide Center-of-Mass Separation.
A 2D implementation of the weighted histogram analysis (WHAM) method (36) is used to obtain PMFs as a function of peptide–peptide center-of-mass () separation from MD umbrella simulations where the constrained distance is either or . For the derivation of the Jacobian correction, we consider the probability distributions of separation for constant values of the constrained coordinate. In the case of umbrella-sampling simulations along , we calculate the average distances between and in each peptide. The Jacobian correction is obtained from the sum, over the explored values, of the distributions of distances between points on the surfaces of two spheres of radius equal to the and centers at separation. Fig. S7A shows PMFs as a function of for R10 molecules at M obtained using the A99 and A03 force fields. Fig. S7B shows the comparison between PMFs as a function of obtained by applying the 2D WHAM method on simulations biased along or directly by biasing the reaction coordinate. The good agreement between these PMFs indicates that the simulations are converged. Assuming that the PMFs as a function of separation can be considered to be pair potentials at infinite dilution, we estimate the dissociation constant of the dimerization process according to (37)
| [S1] |
where is the separation, delimits the binding region, and it is set to 2 nm and 2.2 nm for the PMF obtained with the A03 and A99 force fields, respectively. Using the A99 force field for R10 at M, we estimate a dissociation constant M, whereas the corresponding value obtained using the A03 force field is M.
Fig. S7.
(A) PMFs for pairs of R10 molecules as a function of the separation between the centers of mass () at M. PMFs are calculated using the A99 (blue line) and A03 (red line) force fields. (B) PMFs for pairs of R10 molecules as a function of the separation between the guanidino-C atoms of the ninth residues () calculated from umbrella-sampling MD simulations where the biased coordinate is (blue line) and (red line).
PDB Entries Featuring the Observed Mode of Interaction.
The PDB entries of the crystal structures displaying arrangement I of Fig. 5 in the main text are 4AZS, 2I71, 1V4E, 2NXF, 1YLL, 2ZDS, 4HTP, 3N0U, 5IKJ, 1V7Z, 3EKH, 1UI5, 2QCU, 5LUS, 5ELN, 2FIQ, 4ZBO, 4X2P, 5IPY, 5I0G, 2XXP, 1GQI, 5HHJ, 1M5Q, 3P7L, 2GMH, 3AHN, 3OXP, 4EU9, 1C8U, 4ML9, 5G3Q, 3H14, 5HNO, 1JIX, 4PE6, 5EJ8, 5L7A, 3ESL, 1M55, 4OGE, 5B2R, 5BP8, 1R2J, 2AHU, 4PZ3, 2APJ, 1PN0, 2WFW, 1F5V, 5A0N, 1PIX, 2CAY, 5UAM, 2AL6, 4ZFL, 3E3M, 3AK5, 4KPP, 3HKA, 5D6O, 2DQB, 3KKI, 4MUV, 3PPL, 3E57, 5FVN, 4BHU, 5J41, 5NGD, 5K8P, 3T6S, 4TW5, 1YLX, 4QXL, 5CZL, 3I3W, 3OOQ, 3M33, 3R44, 1CS0, 5HT2, 5H3Z, 1VJV, 3PF7, 1T0B, 2I00, 2JE6, 5LX8, 3BLZ, 5KLP, 5CYW, 1KAE, 4CPC, 2Z0J, 3NG7, 2HA8, 2RH0, 2OIZ, 3C8D, 2VS7, 5CQG, 3MEM, 1VJU, 5G23, 2ZGY, 5K3W, 3LVY, 3CK1, 2WBM, 4PW2, 1Z45, 5C90, 5KLA, 4PAW, 1GPP, 4BJS, 3U7Q, 5TQB, 1GU9, 3G3T, 2W3P, 4OKO, 3HF5, 3QHB, 1V84, 1TZP, 3AYJ, 4UA6; those displaying arrangement II are 5INJ, 5HZU, 4YJ1, 1K32, 1WB9, 4OPM, 4M85, 5CWG, 3D3S, 5A6W, 3DTZ, 5CO8, 4ACF, 3O4H, 4W66, 4F0Q, 2CXI, 1S5U, 2B0T, 5IL2, 2I7X, 3DMC, 4EFI, 5HB7, 2VAK, 2POC, 3Q1T, 3O0Q, 5HWN, 5K0P, 2I3O, 4OPC, 1E9R, 1L0S, 5C8A, 2JIS, 3BJQ, 2J6L, 2F2H, 5GZK, 4CW4, 3CH4, 3LY1, 3CMN, 5MFA, 3H4L, 2X8T, 4L77, 2JDJ, 3DSK, 3NSX, 2ZZJ, 3QF2, 1XO0, 3V2U, 1RF6, 2OAJ, 3K6M, 4QMK, 4OLT, 5FEW, 2JE8, 3C2G, 1H16, 3SQ7, 2NXW, 3IU0, 4N8G, 3AOW, 5G1W, 2WJR, 5B7E, 1WDD, 5KAG, 4AMW, 1XFK; and those displaying arrangement III are 3TPD, 2ZPA, 4DOY, 4ZD6, 4XB6, 2YQY, 3UV0, 3AXG, 2I2O, 4GU5, 1D3B, 4K70, 5MQP, 3HI0, 1DJN, 1D3Y, 4PVK, 4HZO, 2CVD, 3R5G, 5L44, 5C8Z, 3KEB, 4Z13, 3D19, 5GMC.
Occurrence of Lysine Like-Charge Ion Pairs in Proteins.
Lysine side chains participate in geometrical arrangements involving like-charge ion pairing in 423 protein crystal structures in the PDB. The ion pairs are stabilized by salt bridges, formed with the side chains of aspartate and glutamate, in the following PDB entries: 3M1R, 5FOE, 1O88, 2SQC, 4N13, 3IX3, 5JJA, 1WWJ, 4G5H, 2XMP, 5JRH, 2W42, 4EQL.
Coordination with Chloride Ions.
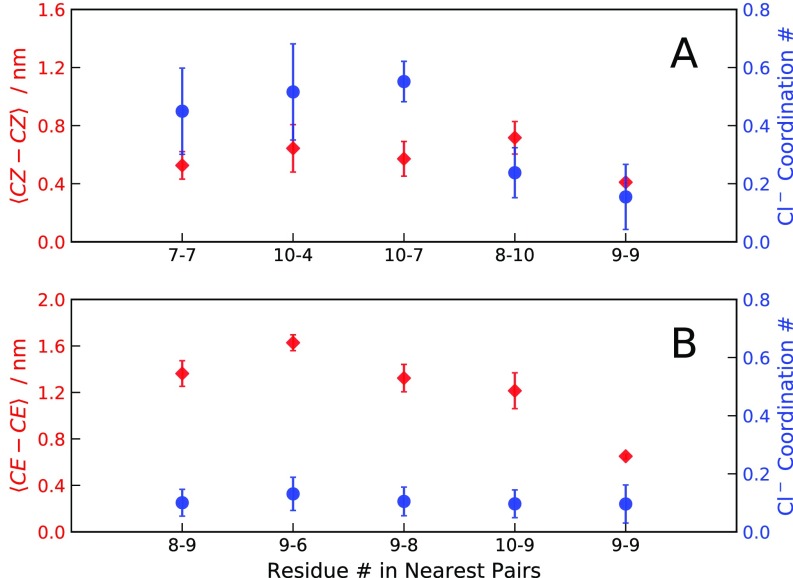
We calculated radial distribution functions (RDFs) between chloride ions and pairs of residues of two interacting peptides. The analysis is performed on umbrella-sampling simulation windows at M where the ninth residues of two R10 or K10 peptides are restrained at close separation. RDFs are calculated as a function of the distance between the ions and the guanidino-C or -C atoms of two arginine and lysine side chains, respectively. The first peak of the RDF is integrated to obtain the number of chloride ions coordinated with the pair of residues. Average residue–residue separations are measured as the distance between guanidino-C () and -C () atoms. Fig. S9 shows that stacked side chains of R10 coordinate with chloride anions except for the 9-9 and 8-10 pairs, as a consequence of the vicinity of the C-terminal carboxyl groups. In contrast, all residues of K10 display similar propensity to coordinate with the anions. Chloride ions bind more strongly to arginine than to lysine side chains, and the coordination of anions to the positively charged arginine side chains may contribute to lowering of the electrostatic repulsion between like-charged peptides. The high average number of ions coordinated with the stacked residues in R10 suggests that the nonspecific interaction is counterion mediated (31). However, coordination numbers are low for the 9-9 and 10-8 pairs of residues in R10, indicating that the mode of interaction identified in this work does not involve chloride ions.
Fig. S9.
(A) Average separation between guanidino-C atoms () and coordination numbers with chloride anions of closely spaced residues on two interacting R10 molecules simulated with the A03 force field. (B) Average separation between -C atoms () and coordination numbers with chloride anions of closely spaced residues on two interacting K10 molecules simulated with the A03 force field.
Discussion
In the SAXS curves of K10 at low (dashed lines in Fig. 1) we observe a typical polyelectrolyte behavior—the intermolecular interactions are repulsive, causing in the low- range to decrease with increasing , owing to the drop in osmotic compressibility (17). The high- region is dominated by intramolecular scattering and is thus independent. The maxima of observed at result from intermolecular distance correlations (18); the inverse of is related to the mean distance between nearest neighbors in solution. SAXS curves collected for R10 samples at M and M (solid lines in Fig. 1 A and B) reveal a striking difference in intermolecular interactions compared with the case of K10. The increase of in the low- range with increasing corresponds to an increase in osmotic compressibility, indicating a net attractive interaction between the R10 peptides. That is, in R10 solutions at intermediate an attraction dominates over the repulsive double-layer force.
For solutions of M (Fig. 1C), where electrostatic interactions are effectively screened, scattering intensities for K10 at increasing suggest an excluded-volume effect, i.e., an effective repulsion caused by the loss of entropy in the more crowded solutions. For R10 at M (Fig. 1C), the effect of on the scattering intensities shows a nonmonotonic trend in at small angles, indicating that the attractive interaction competes with the repulsive excluded-volume effect. Comparing SAXS curves for R10 at low and high , it can be inferred that the attractive interaction has an important electrostatic component. The electrostatic adhesive force is strong at low , where it overpowers the electrostatic repulsion between the highly charged peptides. In contrast, a much weaker attraction is required to compensate for the excluded-volume effect. In Fig. 1D, the decreasing trends of values for K10, K8RK, and R8KR solutions show that the net interaction between these molecules is repulsive, whereas the large and increasing values for R10 solutions of increasing indicate that at M a fraction of R10 molecules self-associates. SAXS data provide evidence that the ninth arginine residue is essential for the attractive interaction; nonetheless, as shown by the scattering curves for K8RK molecules (SI Results and Fig. S2), the remaining arginine residues have a role in lowering the electrostatic repulsion.
The PMFs (Fig. 2) show that K10 molecules repel each other at all length scales and salt concentrations, while R10 molecules, despite bearing the same net charge, display a salt concentration-dependent attraction at short separation. This result is qualitatively insensitive to the choice of the force field (SI Results and Figs. S5–S7). A minimum, at 0.4 nm separation, and an adjacent maximum, at 0.58 nm separation, are present in the PMFs of R10 at all , indicated by the blue and red vertical lines in Fig. 2. The free energy difference between the maximum and the minimum serves as an estimate of the strength of the adhesive force. The fact that the free energy difference diminishes with increasing confirms that the adhesive force has an important electrostatic component. The stability of the dimeric species is indicated by the free energy values of the minima in the PMFs of R10 and depends on the interplay between the double layer and the electrostatic adhesive force. From our simulation results, it can be inferred that the balance between the two forces, which is modulated by the ionic strength, favors the attraction at the intermediate M, where the R10 dimer corresponds to the lowest free energy value. This result can be explained by a simple electrostatic argument, schematically illustrated in Fig. 2. The color scheme exemplifies that with increasing the repulsion between the outer positively charged sites is screened more efficiently than the attraction of oppositely charged sites in the binding region between the two peptides. As a result of the different efficiency by which the short-range attraction and the long-range repulsion are screened with increasing , the net Debye–Hückel free energy of the dimer shows a nonmonotonic trend—the screening majorly affects like-charged side chains that are farther apart until is so large that even the short-range attractions in the binding region are effectively screened.
Competition between double-layer and electrostatic adhesive forces has been observed for other biomolecules, e.g., a monoclonal antibody mAb1 (1) and a globular milk protein lactoferrin (2). In both cases, the attraction stems from a charged patch on the protein surface and becomes dominant at a critical salt concentration.
MD simulations provide a detailed picture of the origin of the attraction between R10 peptides. The last two terminal residues of R10 can be identified as an adhesive patch displaying two oppositely charge sites. The positive site is the Gdm+ moiety of the ninth arginine residue while the negative site is the C-terminal carboxyl group (COO−). We suggest that the observed attraction between R10 molecules occurs through complementarity of the charged groups in the adhesive patch of two interacting peptides. When two patches are at close separation, the Gdm+ moieties of the ninth residues of the peptides form an ion pair. The divalent charge site, generated by the stacking of the arginine side chains, is stabilized by two intermolecular hydrogen bonds. These are salt bridges formed between the negatively charged C-terminal COO− and the positively charged Gdm+ of the ninth residues. Theoretical and experimental studies suggest that Gdm+ ions form weakly stable like-charge ion pairs in aqueous medium (21–28). The free energy of interaction between two Gdm+ ions is minimized when they are stacked parallel to each other in staggered geometry with carbon atoms with separation between 0.35 nm and 0.46 nm (28). The weak Gdm+–Gdm+ attraction in water is estimated to be around –2 kJ and is due to a combination of quadrupole–quadrupole interaction, dispersive forces, and the hydrophobic effect (28). The hydrophobicity of the surfaces of Gdm+, in conjunction with the ability of Gdm+ to form H bonds with functional groups in its molecular plane, has recently been confirmed from the analysis of interactions of arginine side chains in proteins in the PDB (29).
Our analysis of H bonding involving C termini of R10 or K10 (Fig. 3) shows that the probability of forming H bonds between the ninth residues at close separation and COO− is remarkably higher in R10 than in K10. Since salt bridges involving COO− and ammonium () or Gdm+ moieties have comparable strengths (30), the higher probability observed for R10 highlights the important role of the arginine side chain in the R10–R10 patchy attraction. Due to the approximately tetrahedral geometry of , restraining the position of two lysine side chains at close separation hinders the formation of H bonds with COO−. In contrast, the H bonding of Gdm+ occurs in the molecular plane and is unaffected by stacking. The probability for the formation of salt bridges involving the ninth residues of R10 and K10 has a nonmonotonic dependence on . The formation of salt bridges is the consequence of short-range attractive electrostatic interactions. Therefore, the trend can be rationalized by the same argument used to explain the dependence of the free energy minima in the PMFs of R10.
Our results highlight the fact that an important component of the described patchy attraction is of electrostatic origin and is imparted by two salt bridges. The main difference in the interaction between R10 and K10 lies in the favorable Gdm+–Gdm+ stacking. As shown by the H-bond probabilities calculated for K10, in the absence of pairing of the positively charged side chains, C-terminal salt bridges are substantially less energetically favorable.
The NMR data confirm that R8KR solutions are monodisperse in the explored range, while R10 molecules self-associate. The observed changes in chemical shifts in Fig. 4A are consistent with a nonspecific peptide–peptide interaction characterized by the stacking of side chains of several arginine residues of the R10 peptide. Accordingly, MD simulations indicate that, besides the 9th residue, the 8th and 10th residues also contribute to the attractive interaction (SI Results and Fig. S8) and that the stacking of Gdm+ moieties occurring between the remaining residues can be stabilized by chloride ions (31) (SI Results and Fig. S9). For the N-terminal residues, the changes in chemical shift with increasing may be explainable by the favorable interaction of the N terminus of one peptide with the binding region of the R10 dimer. Indeed, when the side chains of the 10th and 8th residues are constrained at stacking separations, the PMF as a function of distance between guanidino-C atoms of 10th and 2nd residues of R10 shows two local minima at close separations (SI Results and Fig. S10).
The mode of interaction responsible for the adhesive force between R10 molecules is well represented in the PDB (Fig. 5). A total of 231 X-ray crystal structures of 10,388 entries present at least one ion pair formed by the stacking of two arginine side chains, which interacts with two carboxyl groups of aspartate or glutamate residues. Arginine residues are also found at protein–protein interfaces more frequently than lysine residues, reflected in the “stickiness” scale proposed by Levy and coworkers (32).
The concentration effect observed in the SAXS data from the dilution series of R10 at low-to-intermediate (Fig. 1, SI Results, and Fig. S2 A and C) is consistent with a monomer–oligomer equilibrium where the population of oligomeric forms in solution increases with increasing . This is further supported by concentration-dependent NMR 1H and 13C chemical shifts (Fig. 4), assuming fast exchange on the NMR chemical shift timescale between monomeric and oligomeric forms.
Self-aggregation has been recently shown to be important for the effective translocation of a 9-aa-long peptide across the plasma membrane (33). As a consequence, the propensity of R10 molecules to aggregate may contribute to the explanation of the high cellular uptake of RRPs.
The transduction efficiency of oligo-arginines depends on the number of residues. It is maximal for chains of 6–15 aa, but considerably lower for shorter as well as longer peptides (7, 12). As the number of positively charged residues increases, the force balance governing the self-association of oligo-arginines gradually moves toward the repulsive double-layer force. The presence of an upper limit in the range of optimal chain lengths may reflect the importance of self-association in the transduction of oligo-arginines.
Conclusions
We have used a combination of MD simulations with SAXS and NMR experiments with the aim of elucidating the molecular mechanism of self-association of arginine-rich oligopeptides. Concentration studies point to an important electrostatic component of the attraction between R10 molecules, while single-point mutations underline a binding motif involving the C terminus and the adjacent arginine residues. The present results not only support the notion of the important role of self-aggregation in the transduction of cell-penetrating peptides, but also open the path to future studies of the potential biological roles of the newly discovered binding motif, as exemplified by its abundant occurrence in the PDB.
Acknowledgments
We are grateful to Dr. Petra Pernot and Dr. Martha Brennich at the European Synchrotron Radiation Facility (ESRF), Grenoble, for providing assistance in using beamline BM29 and to Ellen Rieloff for experimental assistance. We thank the Swedish Research Council, the Swedish Foundation for Strategic Research, Lunarc in Lund for computational resources, and ESRF for providing beam time. This study was supported by the Science Faculty project grant program for research with neutrons and synchrotron light [Lund University (LU) Strategic funds for MAX-IV and European Spallation Source (ESS); Grant V2016/1301]. P.J. acknowledges the Czech Science Foundation for support via Grant 16-01074S. This work used the platforms of the Grenoble Instruct-ERIC Center [Integrated Structural Biology Grenoble (ISBG): Unité Mixte de Service (UMS) 3518 CNRS-Commissariat à l’Énergie Atomique et aux Énergies Alternatives (CEA)-Univ. Grenoble Alpes (UGA)-European Molecular Biology Laboratory (EMBL)] with support from French Infrastructure for Integrated Structural Biology (FRISBI) (ANR-10-INSB-05-02) and Grenoble Alliance for Integrated Structural Cell Biology (GRAL) (ANR-10-LABX-49-01) within the Grenoble Partnership for Structural Biology.
Footnotes
The authors declare no conflict of interest.
This article is a PNAS Direct Submission.
Data deposition: Datasets and Jupyter Notebooks for reproducing the analyses of SAXS data, MD simulations, and PDB structures, as well as all presented plots can be accessed at Zenodo, https://doi.org/10.5281/zenodo.825460.
This article contains supporting information online at www.pnas.org/lookup/suppl/doi:10.1073/pnas.1712078114/-/DCSupplemental.
References
- 1.Roberts D, et al. The role of electrostatics in protein–protein interactions of a monoclonal antibody. Mol Pharm. 2014;11:2475–2489. doi: 10.1021/mp5002334. [DOI] [PubMed] [Google Scholar]
- 2.Li W, et al. Charge-induced patchy attractions between proteins. J Phys Chem B. 2015;119:503–508. doi: 10.1021/jp512027j. [DOI] [PubMed] [Google Scholar]
- 3.Li W, Persson BA, Lund M, Bergenholtz J, Oskolkova MZ. Concentration-induced association in a protein system caused by a highly directional patch attraction. J Phys Chem B. 2016;120:8953–8959. doi: 10.1021/acs.jpcb.6b06873. [DOI] [PubMed] [Google Scholar]
- 4.Ohnuki J, Yodogawa A, Takano M. Electrostatic balance between global repulsion and local attraction in reentrant polymerization of actin. Cytoskeleton. 2017 doi: 10.1002/cm.21391. [DOI] [PubMed] [Google Scholar]
- 5.Roberts CJ, Blanco MA. Role of anisotropic interactions for proteins and patchy nanoparticles. J Phys Chem B. 2014;118:12599–12611. doi: 10.1021/jp507886r. [DOI] [PMC free article] [PubMed] [Google Scholar]
- 6.Dumetz AC, Snellinger-O’Brien AM, Kaler EW, Lenhoff AM. Patterns of protein-protein interactions in salt solutions and implications for protein crystallization. Protein Sci. 2007;16:1867–1877. doi: 10.1110/ps.072957907. [DOI] [PMC free article] [PubMed] [Google Scholar]
- 7.Mitchell D, Steinman L, Kim D, Fathman C, Rothbard J. Polyarginine enters cells more efficiently than other polycationic homopolymers. J Pept Res. 2000;56:318–325. doi: 10.1034/j.1399-3011.2000.00723.x. [DOI] [PubMed] [Google Scholar]
- 8.Strömstedt AA, Pasupuleti M, Schmidtchen A, Malmsten M. Oligotryptophan-tagged antimicrobial peptides and the role of the cationic sequence. Biochim Biophys Acta. 2009;1788:1916–1923. doi: 10.1016/j.bbamem.2009.06.001. [DOI] [PubMed] [Google Scholar]
- 9.Vazdar M, et al. Aggregation of oligoarginines at phospholipid membranes: Molecular dynamics simulations, time-dependent fluorescence shift, and biomimetic colorimetric assays. J Phys Chem B. 2013;117:11530–11540. doi: 10.1021/jp405451e. [DOI] [PubMed] [Google Scholar]
- 10.Wu Z, Cui Q, Yethiraj A. Why do arginine and lysine organize lipids differently? Insights from coarse-grained and atomistic simulations. J Phys Chem B. 2013;117:12145–12156. doi: 10.1021/jp4068729. [DOI] [PubMed] [Google Scholar]
- 11.Li L, Vorobyov I, Allen TW. The different interactions of lysine and arginine side chains with lipid membranes. J Phys Chem B. 2013;117:11906–11920. doi: 10.1021/jp405418y. [DOI] [PMC free article] [PubMed] [Google Scholar]
- 12.Futaki S, et al. Arginine-rich peptides. An abundant source of membrane-permeable peptides having potential as carriers for intracellular protein delivery. J Biol Chem. 2000;276:5836–5840. doi: 10.1074/jbc.M007540200. [DOI] [PubMed] [Google Scholar]
- 13.Tünnemann G, et al. Live-cell analysis of cell penetration ability and toxicity of oligo-arginines. J Pept Sci. 2008;14:469–476. doi: 10.1002/psc.968. [DOI] [PubMed] [Google Scholar]
- 14.Lättig-Tünnemann G, et al. Backbone rigidity and static presentation of guanidinium groups increases cellular uptake of arginine-rich cell-penetrating peptides. Nat Commun. 2011;2:453. doi: 10.1038/ncomms1459. [DOI] [PMC free article] [PubMed] [Google Scholar]
- 15.Sun D, Forsman J, Lund M, Woodward CE. Effect of arginine-rich cell penetrating peptides on membrane pore formation and life-times: A molecular simulation study. Phys Chem Chem Phys. 2014;16:20785–20795. doi: 10.1039/c4cp02211d. [DOI] [PubMed] [Google Scholar]
- 16.Robison AD, et al. Polyarginine interacts more strongly and cooperatively than polylysine with phospholipid bilayers. J Phys Chem B. 2016;120:9287–9296. doi: 10.1021/acs.jpcb.6b05604. [DOI] [PMC free article] [PubMed] [Google Scholar]
- 17.Nierlich M, et al. Small angle neutron scattering by semi-dilute solutions of polyelectrolyte. J Phys. 1979;40:701–704. [Google Scholar]
- 18.Hayter J, Janninck G, Brochard-Wyart F, de Gennes P. Correlations and dynamics of polyelectrolyte solutions. J Phys Lett. 1980;41:451–454. [Google Scholar]
- 19.Elshahawi SI, et al. Structure and specificity of a permissive bacterial c-prenyltransferase. Nat Chem Biol. 2017;13:366–368. doi: 10.1038/nchembio.2285. [DOI] [PMC free article] [PubMed] [Google Scholar]
- 20.Hagelueken G, et al. Structure of WbdD: A bifunctional kinase and methyltransferase that regulates the chain length of the O antigen in Escherichia coli O9a. Mol Microbiol. 2012;86:730–742. doi: 10.1111/mmi.12014. [DOI] [PMC free article] [PubMed] [Google Scholar]
- 21.Mason PE, Neilson GW, Dempsey CE, Barnes AC, Cruickshank JM. The hydration structure of guanidinium and thiocyanate ions: Implications for protein stability in aqueous solution. Proc Natl Acad Sci USA. 2003;100:4557–4561. doi: 10.1073/pnas.0735920100. [DOI] [PMC free article] [PubMed] [Google Scholar]
- 22.Mason PE, et al. The structure of aqueous guanidinium chloride solutions. J Am Chem Soc. 2004;126:11462–11470. doi: 10.1021/ja040034x. [DOI] [PubMed] [Google Scholar]
- 23.Mason PE, Brady JW, Neilson GW, Dempsey CE. The interaction of guanidinium ions with a model peptide. Biophys J. 2007;93:L04–L06. doi: 10.1529/biophysj.107.108290. [DOI] [PMC free article] [PubMed] [Google Scholar]
- 24.Vazdar M, Vymětal J, Heyda J, Vondrášek J, Jungwirth P. Like-charge guanidinium pairing from molecular dynamics and ab initio calculations. J Phys Chem A. 2011;115:11193–11201. doi: 10.1021/jp203519p. [DOI] [PubMed] [Google Scholar]
- 25.Vazdar M, Uhlig F, Jungwirth P. Like-charge ion pairing in water: An ab initio molecular dynamics study of aqueous guanidinium cations. J Phys Chem Lett. 2012;3:2021–2024. [Google Scholar]
- 26.Wernersson E, et al. Counterion condensation in short cationic peptides: Limiting mobilities beyond the Onsager-Fuoss theory. Electrophoresis. 2012;33:981–989. doi: 10.1002/elps.201100602. [DOI] [PubMed] [Google Scholar]
- 27.Shih O, et al. Cation-cation contact pairing in water: Guanidinium. J Chem Phys. 2013;139:035104. doi: 10.1063/1.4813281. [DOI] [PubMed] [Google Scholar]
- 28.Allolio C, Baxova K, Vazdar M, Jungwirth P. Guanidinium pairing facilitates membrane translocation. J Phys Chem B. 2016;120:143–153. doi: 10.1021/acs.jpcb.5b10404. [DOI] [PubMed] [Google Scholar]
- 29.Armstrong CT, Mason PE, Anderson JLR, Dempsey CE. Arginine side chain interactions and the role of arginine as a gating charge carrier in voltage sensitive ion channels. Sci Rep. 2016;6:21759. doi: 10.1038/srep21759. [DOI] [PMC free article] [PubMed] [Google Scholar]
- 30.Debiec KT, Gronenborn AM, Chong LT. Evaluating the strength of salt bridges: A comparison of current biomolecular force fields. J Phys Chem B. 2014;118:6561–6569. doi: 10.1021/jp500958r. [DOI] [PMC free article] [PubMed] [Google Scholar]
- 31.Formaneck MS, Ma L, Cui Q. Effects of temperature and salt concentration on the structural stability of human lymphotactin: Insights from molecular simulations. J Am Chem Soc. 2006;128:9506–9517. doi: 10.1021/ja061620o. [DOI] [PMC free article] [PubMed] [Google Scholar]
- 32.Levy ED, De S, Teichmann SA. Cellular crowding imposes global constraints on the chemistry and evolution of proteomes. Proc Natl Acad Sci USA. 2012;109:20461–20466. doi: 10.1073/pnas.1209312109. [DOI] [PMC free article] [PubMed] [Google Scholar]
- 33.Macchi S, et al. Spontaneous membrane-translocating peptides: Influence of peptide self-aggregation and cargo polarity. Sci Rep. 2015;5:16914. doi: 10.1038/srep16914. [DOI] [PMC free article] [PubMed] [Google Scholar]
- 34.Best RB, Zheng W, Mittal J. Balanced protein–water interactions improve properties of disordered proteins and non-specific protein association. J Chem Theory Comput. 2014;10:5113–5124. doi: 10.1021/ct500569b. [DOI] [PMC free article] [PubMed] [Google Scholar]
- 35.Henriques J, Cragnell C, Skepö M. Molecular dynamics simulations of intrinsically disordered proteins: Force field evaluation and comparison with experiment. J Chem Theory Comput. 2015;11:3420–3431. doi: 10.1021/ct501178z. [DOI] [PubMed] [Google Scholar]
- 36.Minh DDL. Multidimensional potentials of mean force from biased experiments along a single coordinate. J Phys Chem B. 2007;111:4137–4140. doi: 10.1021/jp068656n. [DOI] [PubMed] [Google Scholar]
- 37.Jong DHD, et al. Determining equilibrium constants for dimerization reactions from molecular dynamics simulations. J Comput Chem. 2011;32:1919–1928. doi: 10.1002/jcc.21776. [DOI] [PubMed] [Google Scholar]
- 38.Hicks M, Gebicki JM. Rate constants for reaction of hydroxyl radicals with tris, tricine and hepes buffers. FEBS Lett. 1986;199:92–94. [Google Scholar]
- 39.Grishaev A. Sample preparation, data collection, and preliminary data analysis in biomolecular solution X-Ray scattering. Curr Protoc Protein Sci. 2001;70:17.14.1–17.14.18. doi: 10.1002/0471140864.ps1714s70. [DOI] [PMC free article] [PubMed] [Google Scholar]
- 40.Kuipers BJH, Gruppen H. Prediction of molar extinction coefficients of proteins and peptides using UV absorption of the constituent amino acids at 214 nm to enable quantitative reverse phase high-performance liquid chromatography-mass spectrometry analysis. J Agric Food Chem. 2007;55:5445–5451. doi: 10.1021/jf070337l. [DOI] [PubMed] [Google Scholar]
- 41.Pernot P, et al. Upgraded ESRF BM29 beamline for SAXS on macromolecules in solution. J Synchrotron Radiat. 2013;20:660–664. doi: 10.1107/S0909049513010431. [DOI] [PMC free article] [PubMed] [Google Scholar]
- 42.Konarev PV, Volkov VV, Sokolova AV, Koch MHJ, Svergun DI. Primus: A windows PC-based system for small-angle scattering data analysis. J Appl Crystallogr. 2003;36:1277–1282. [Google Scholar]
- 43.Cleveland WS. Robust locally weighted regression and smoothing scatterplots. J Am Stat Assoc. 1979;74:829–836. [Google Scholar]
- 44.Jacques DA, Trewhella J. Small-angle scattering for structural biology—expanding the frontier while avoiding the pitfalls. Protein Sci. 2010;19:642–657. doi: 10.1002/pro.351. [DOI] [PMC free article] [PubMed] [Google Scholar]
- 45.Kharakoz DP. Partial volumes and compressibilities of extended polypeptide chains in aqueous solution: Additivity scheme and implication of protein unfolding at normal and high pressure. Biochemistry. 1997;36:10276–10285. doi: 10.1021/bi961781c. [DOI] [PubMed] [Google Scholar]
- 46.Whitten AE, Cai S, Trewhella J. MULCh: Modules for the analysis of small-angle neutron contrast variation data from biomolecular assemblies. J Appl Crystallogr. 2008;41:222–226. [Google Scholar]
- 47.Torrie G, Valleau J. Nonphysical sampling distributions in Monte Carlo free-energy estimation: Umbrella sampling. J Comput Phys. 1977;23:187–199. [Google Scholar]
- 48.Pronk S, et al. GROMACS 4.5: A high-throughput and highly parallel open source molecular simulation toolkit. Bioinformatics. 2013;29:845–854. doi: 10.1093/bioinformatics/btt055. [DOI] [PMC free article] [PubMed] [Google Scholar]
- 49.Bussi G, Donadio D, Parrinello M. Canonical sampling through velocity rescaling. J Chem Phys. 2007;126:014101. doi: 10.1063/1.2408420. [DOI] [PubMed] [Google Scholar]
- 50.Parrinello M, Rahman A. Polymorphic transitions in single crystals: A new molecular dynamics method. J Appl Phys. 1981;52:7182–7190. [Google Scholar]
- 51.Darden T, York D, Pedersen L. Particle mesh Ewald: An nlog(n) method for Ewald sums in large systems. J Chem Phys. 1993;98:10089–10092. [Google Scholar]
- 52.Hess B. P-LINCS: A parallel linear constraint solver for molecular simulation. J Chem Theor Comput. 2008;4:116–122. doi: 10.1021/ct700200b. [DOI] [PubMed] [Google Scholar]
- 53.Hub JS, de Groot BL, van der Spoel D. g_wham—a free weighted histogram analysis implementation including robust error and autocorrelation estimates. J Chem Theor Comput. 2010;6:3713–3720. [Google Scholar]
- 54.Humphrey W, Dalke A, Schulten K. VMD: Visual molecular dynamics. J Mol Graphics. 1996;14:33–38. doi: 10.1016/0263-7855(96)00018-5. [DOI] [PubMed] [Google Scholar]
- 55.Wernet P. The structure of the first coordination shell in liquid water. Science. 2004;304:995–999. doi: 10.1126/science.1096205. [DOI] [PubMed] [Google Scholar]
- 56.McGibbon RT, et al. MDTraj: A modern open library for the analysis of molecular dynamics trajectories. Biophys J. 2015;109:1528–1532. doi: 10.1016/j.bpj.2015.08.015. [DOI] [PMC free article] [PubMed] [Google Scholar]
- 57.Wang G, Dunbrack RL. PISCES: A protein sequence culling server. Bioinformatics. 2003;19:1589–1591. doi: 10.1093/bioinformatics/btg224. [DOI] [PubMed] [Google Scholar]
- 58.Berman HM. The Protein Data Bank. Nucleic Acids Res. 2000;28:235–242. doi: 10.1093/nar/28.1.235. [DOI] [PMC free article] [PubMed] [Google Scholar]
- 59.Eastman P, et al. OpenMM 4: A reusable, extensible, hardware independent library for high performance molecular simulation. J Chem Theor Comput. 2013;9:461–469. doi: 10.1021/ct300857j. [DOI] [PMC free article] [PubMed] [Google Scholar]


