Summary
Elongation of RNA Polymerase II (Pol II) is thought to be an important mechanism for regulating gene expression [1]. We measured the first wave of de novo transcription in living Drosophila embryos using dual-fluorescent detection of nascent transcripts containing 5′ MS2 and 3′ PP7 RNA stem loops. Pol II elongation rates of 2.4-3.0 kb/min were observed, approximately twice as fast as earlier estimates [2–6]. The revised rates permit substantial levels of zygotic gene activity prior to the mid-blastula transition. We also provide evidence that variable rates of elongation are not a significant source of differential gene activity, suggesting that transcription initiation and Pol II release are the key determinants of gene control in development.
Results and Discussion
Classical studies provide a disparity in the rates of Pol II elongation and the timing of gene activity in the Drosophila embryo. A variety of methods suggest rates of 1.1-1.5 kb/min [2–6], but these rates are inadequate to permit expression of large genes during the short interphase periods that characterize pre-cellular stages of development. For example, the BMP inhibitor Short gastrulation (Sog) is encoded by a transcription unit that is ∼22 kb in length, but it nonetheless produces detectable full-length transcripts during the ∼10-12 min interphase of nuclear cycle (nc) 13 [7]. Moreover, recent live imaging studies revealed highly dynamic transcriptional bursting profiles that are incompatible with traditional estimates of Pol II elongation rates [8, 9]. Here, we employ newly developed quantitative imaging methods to determine the rates of Pol II elongation in living Drosophila embryos.
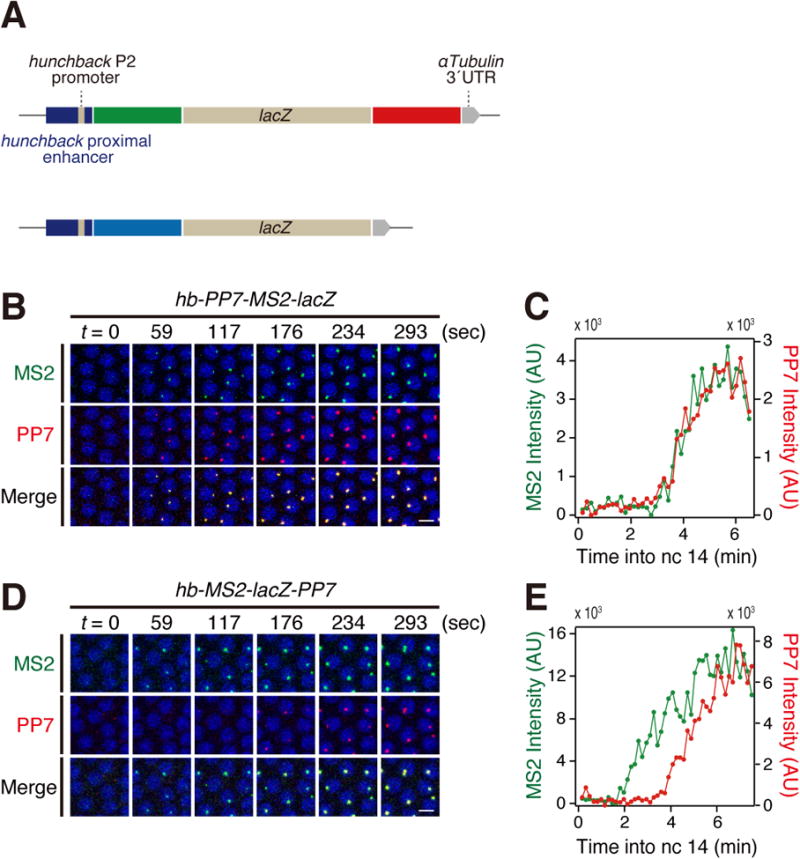
For this purpose, we created a lacZ reporter gene containing 24× MS2 RNA stem loops at the 5′ UTR and 24× PP7 RNA stem loops at the 3′ UTR, and placed it under the control of a 787 bp regulatory DNA containing the hunchback (hb) proximal enhancer and P2 promoter (Figure 1A; top). As a control, we examined a lacZ reporter containing tandem repeats of intermixed PP7/MS2 loops at the 5′ UTR (Figure 1A; bottom). These reporter genes were integrated into a specific landing site using phiC31-mediated transgenesis [10]. Nascent transcripts were visualized using MCP-GFP and mCherry-PCP fusion proteins, which detect MS2 and PP7 RNA stem loops, respectively [9, 11]. The hb proximal enhancer mediates faithful activation of reporter gene expression in anterior regions of transgenic embryos (Movie S1).
Figure 1. Visualization of Pol II elongation in living embryos.

(A) Schematic representation of MS2-lacZ-PP7 and PP7-MS2-lacZ reporter genes containing hb proximal enhancer and P2 promoter.
(B) Representative snapshots of embryo expressing hb-PP7-MS2-lacZ at the onset of nc 14. Nuclei were visualized with His2Av-eBFP2. Scale bar indicates 5 μm.
(C) Representative trajectory of MS2 and PP7 intensities in an individual nucleus expressing hb-PP7-MS2-lacZ. The time resolution is 9.77 sec (same in all subsequent figures).
(D) Representative snapshots of embryo expressing hb-MS2-lacZ-PP7 at the onset of nc 14. Nuclei were visualized with His2Av-eBFP2. Scale bar indicates 5 μm.
(E) Representative trajectory of MS2 and PP7 intensities in an individual nucleus expressing hb-MS2-lacZ-PP7.
See also Movie S1-3.
As expected, the control hb-PP7-MS2-lacZ reporter gene containing intermixed 5′ MS2 and PP7 RNA stem loops displays simultaneous GFP and mCherry fluorescent dots during the onset of nc 14 (Figure 1B and C and Movie S2). In contrast, the hb-MS2-lacZ-PP7 reporter gene containing separate 5′ MS2 and 3′ PP7 RNA stem loops displays sequential GFP and mCherry signals (Figure 1D and E and Movie S3). The lag in appearance of these dots depends on the rate of Pol II elongation during the transcription of the lacZ reporter gene.
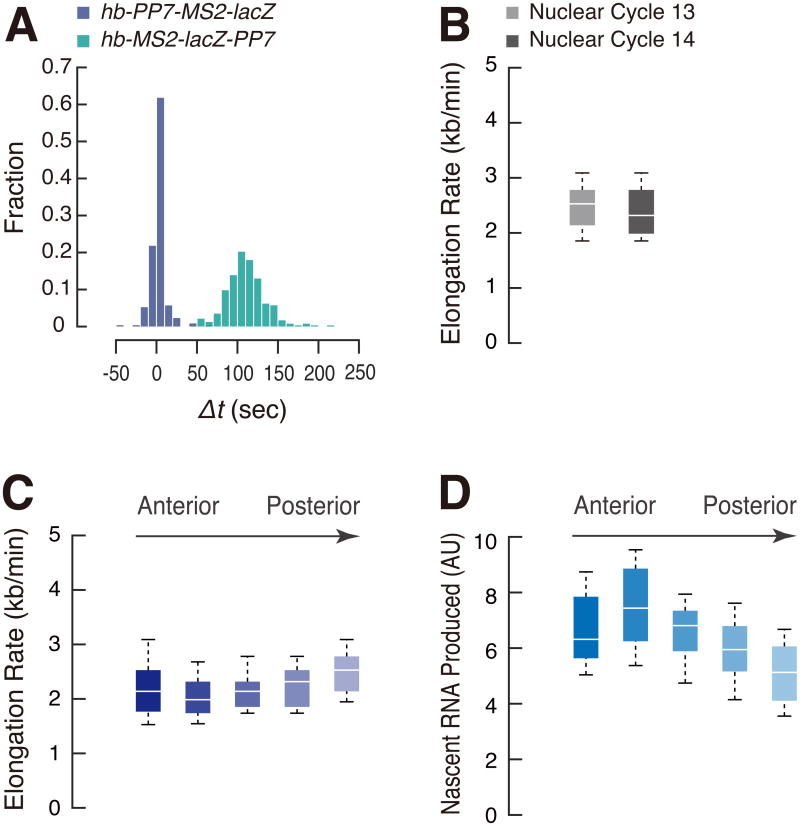
We used a variety of computational methods to measure Pol II elongation rates, including the time to reach 30% peak intensity of MS2 and PP7 signals in quantitative traces of individual nuclei (Figure S1; see Experimental Procedures). We observed an average lag (Δt) of ∼120 sec in the detection of MS2 and PP7 signals (Figure 2A), suggesting a Pol II elongation rate of ∼40 bp/sec (2.4 kb/min; Figure 2B and Figure S2A). This value is significantly faster than the original estimates provided by northern blotting assays using Drosophila larval tissues [5] or nuclear run-on assays using Drosophila S2 cell extracts [3]. It is possible that the “open” chromatin of pre-cellular embryos contributes to this rapid rate of elongation [12]. Moreover, many of the earlier estimates of Pol II elongation are based on the analysis of heat shock genes, and it is conceivable that the elevated temperatures needed for induction result in attenuated rates of elongation [2, 3, 6]. Here, we employ noninvasive methods of measurement and optimal culturing temperatures (22-23 °C). The revised estimate permits large patterning genes such as sog to produce mature mRNAs during the short interphase periods that occur prior to the onset of nc 14 [13, 14].
Figure 2. Rapid rates of Pol II elongation in early embryos.
(A) Differential activation kinetics of hb-PP7-MS2-lacZ and hb-MS2-lacZ-PP7 at the onset of nc 14. Δt values from a single embryo were plotted for each reporter.
(B) Boxplots showing the distribution of elongation rate per nucleus. 287 and 877 nuclei from two independent embryos (nc 13) and three independent embryos (nc 14) were analyzed. The box indicates the lower (25%) and upper (75%) quantile and the solid line indicates the median. Whiskers extend to 10 th and 90 th percentile of distribution (and in all subsequent figures). Elongation rate was calculated by dividing the length of the template DNA (lacZ plus 24× PP7; 4537 bp) by Δt.
(C, D) Boxplot showing the distribution of elongation rate (C) and output (D) in AP binned nuclei. 23, 49, 66, 80 and 72 nuclei from the same embryo at nc 14 were analyzed.
See also Figure S1 and S2.
We next sought to determine whether there is a correlation between the rates of Pol II elongation and the levels of gene expression. A gradient of the maternal Bicoid activator regulates anterior-posterior (AP) patterning genes such as hb in a concentration-dependent manner [15]. To examine the relationship between the levels of Bicoid activator and rates of Pol II elongation, we measured the rates for hb-expressing nuclei in five 20 μm windows across the AP axis. There is very little variation in these regions (Figure 2C and Figure S2B and D), despite significant differences in the levels of total RNA output (Figure 2D and Figure S2C and E).
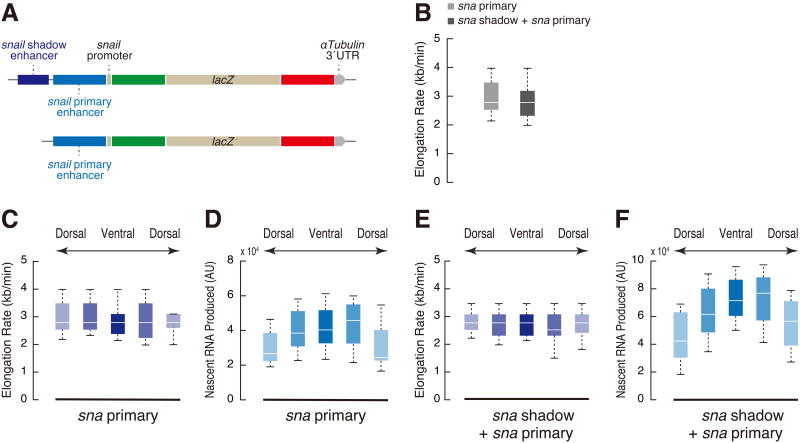
We next asked whether different regulatory DNAs might produce distinct rates of Pol II elongation. Towards this end, the MS2-lacZ-PP7 reporter gene was placed under the control of the snail (sna) shadow and primary enhancers [16, 17] (Figure 3A). The sna-lacZ reporter genes exhibit slightly faster elongation rates (∼2.8 kb/min) than the hb-lacZ reporter (∼2.4 kb/min; Figure 3B and Figure S3A). Similar rates were observed for transgenes containing both enhancers or only the primary enhancer alone, despite significant differences in total RNA output [18] (Figure 3C-F and Figure S3B-E). These results suggest that the levels of gene expression depend on the rates of transcription initiation and Pol II release, and not elongation (see below). However, the rates of RNA synthesis are near the theoretical limit in the early Drosophila embryo, and it is conceivable that differential rates of Pol II elongation are important for the slower developmental processes seen in mammals and other vertebrates.
Figure 3. Elongation rate does not scale with the level of nascent RNA synthesis.
(A) Schematic representation of MS2-lacZ-PP7 reporter genes containing sna shadow enhancer, sna proximal enhancer and minimal 100 bp sna promoter.
(B) Boxplots showing the distribution of elongation rate per nucleus. 379 (sna primary) and 573 (sna primary + shadow) nuclei from two independent embryos at nc 14 were analyzed.
(C, D) Boxplot showing the distribution of elongation rate (C) and output (D) in dorsal-ventral binned nuclei in the transgenic embryo expressing sna primary-MS2-lacZ-PP7. 17, 55, 55, 44 and 15 nuclei from the same embryo were analyzed.
(E, F) Boxplot showing the distribution of elongation rate (E) and output (F) in dorsal-ventral binned nuclei in the transgenic embryo expressing sna shadow-sna primary-MS2-lacZ-PP7. 30, 67, 78, 70 and 52 nuclei from the same embryo were analyzed.
See also Figure S3.
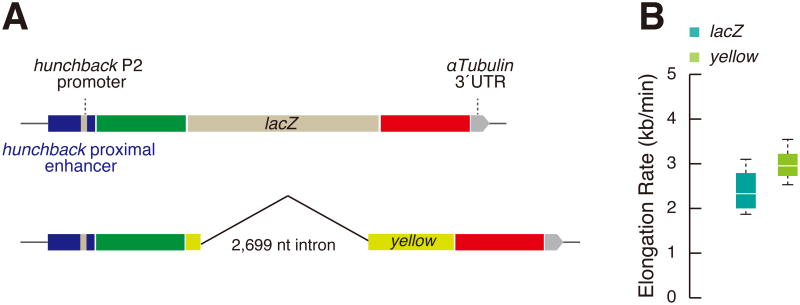
We also examined the impact of intronic sequences on the rate of Pol II elongation. The preceding analysis employed an intron-less lacZ transcription unit. A recent GRO-Seq study suggests that introns can augment the rate of Pol II elongation in mouse ES cells [19]. To determine whether something similar might occur in Drosophila, we replaced the intron-less lacZ transcription unit with the native Drosophila yellow gene, which contains a 2.7 kb intron (Figure 4A). Pol II exhibits a ∼20% faster rate of elongation on this template as compared with lacZ (Figure 4B). This observation is consistent with the idea that co-transcriptional RNA processing events do not impede Pol II elongation, but instead might augment processivity. The kinetics of transcriptional bursting also suggest rapid rates of Pol II elongation for MS2-yellow reporter genes under the control of defined developmental enhancers [9] (Figure S4). This might explain why so many early-acting patterning genes contain short introns (typically a few hundred bp in length), despite constraints on gene size imposed by the rapid interphase cycles of pre-cellular embryos [20]. We cannot currently exclude the possibility that the faster elongation rate seen for the yellow reporter gene is due to DNA sequence features such as GC content rather than the presence of an intron.
Figure 4. Splicing does not impede Pol II elongation.
(A) Schematic representation of MS2-yellow-PP7 reporter gene containing hb proximal enhancer and P2 promoter.
(B) Boxplots showing the distribution of elongation rate per nucleus at the onset of nc 14. 599 nuclei from two independent embryos expressing hb-MS2-yellow-PP7 were analyzed. The plot in Figure 2B (hb-MS2-lacZ-PP7) was shown for comparison. Elongation rate was calculated by dividing the length the template DNA (yellow plus 24× PP7; 5771 bp) by Δt.
See also Figure S4.
Pol II elongation is thought to represent an important mechanism of differential gene activity in development, since previous studies suggest highly variable (4-5 fold) rates of elongation across different genes [21–24]. However, we observe fairly constant rates of elongation in the early Drosophila embryo, with less than 25% variation (2.4-3.0 kb/min) for different activators, promoters and reporter genes. Moreover, elongation rates do not appear to scale with the levels of total RNA output. This agrees with the idea that Pol II elongation is probably not the rate limiting step in transcription [25]. By contrast, there is a clear correlation between RNA output and the frequency of transcriptional bursting [9]. We therefore conclude that transcription initiation and Pol II release are the key determinants of gene control in the early Drosophila embryo.
Experimental Procedures
Site specific transgenesis by phiC31 system
All reporter plasmids were integrated into a unique landing site on the third chromosome using strain 9750 (Bloomington Drosophila Stock Center). The nanos>SV40NLS-mCherry-PCP, His2Av-eBFP2 expression vector was integrated into a unique landing site on the second chromosome using strain 9723 (Bloomington Drosophila Stock Center).
Fly strains
Maternal expression of the MCP-GFP fusion protein was obtained using a transgenic strain carrying a nanos>MCP-GFP transgene that was integrated onto the third chromosome by P-element mediated transformation [26]. Maternal expression of mCherry-PCP and His2Av-eBFP2 fusion proteins were obtained using a transgenic strain carrying nanos>SV40NLS-mCherry-PCP and His2Av-eBFP2 transgenes on the second chromosome. These were mated to create the fly line yw; nanos>SV40NLS-mCherry-PCP, His2Av-eBFP2 / CyO; nanos>MCP-GFP in order to obtain co-expression of MCP-GFP, mCherry-PCP and His2Av-eBFP2.
Live imaging
yw; nanos>SV40NLS-mCherry-PCP, His2Av-eBFP2 / CyO; nanos>MCP-GFP virgins were mated with males carrying the MS2/PP7 reporter genes. The resulting embryos were dechorinated and mounted between a semipermeable membrane (In Vitro Systems & Services) and a coverslip (18 mm × 18 mm) and embedded in Halocarbon oil 27 (Sigma). Embryos were imaged using a Zeiss LSM 880 confocal microscope. Plan-Apochromat 40× / 1.3N.A. oil immersion objective was used. The pixel size was set to 320 nm and a single image consisted of 512 × 512 pixels. At each time point, a stack of 21 images separated by 0.5 μm was acquired and the final time resolution is 9.77 sec. A typical time-lapse imaging was done from the beginning of mitosis to about 10 min into the interphase, where MS2 and PP7 signals reach a plateau. Images were captured in 16 bit. The same laser power and microscope setting were used throughout this study.
Image analysis
MS2 and PP7 signal intensities were extracted by analyzing a live imaging movie where each frame is a maximum projection of a 10 μm z-stacks. Nuclei segmentation, nuclei tracking, and MS2 and PP7 signal recording were performed using the previously described method [9]. Only the nuclei with active MS2 and PP7 signals were analyzed to measure the elongation rate.
Measurement of elongation rate
Three different methods were used to calculate the elongation rate. (1) In the first method, the raw trajectories were smoothened using the local regression (LOESS), and then the point at which the signal intensity reaches 30% of the maximum MS2 or PP7 signal was determined. The time delay (Δt) between MS2 and PP7 activation was obtained for each nucleus, and elongation rate was calculated by dividing the length of the template DNA (lacZ plus 24× PP7 or yellow plus 24× PP7) by the Δt. This method was used in Figure 2-4. In Figure S1A, three different threshold levels (10%, 30%, 50% of the maximum intensity) were used to test the consistency of the measurement.
(2) In the second method, elongation rate was measured by fitting the MS2 and PP7 trajectories to an equation. For time t < t0, where t0 is defined as the time point when the first MS2 or PP7 signal is detected, f(t) = 0. For t > t0, f(t)=(r0/k)(1-e-(t-t0)k), where r0 is a scaling parameter for the amplitude and k is a parameter with the unit of inverse time. t0 for MS2 and PP7 traces were obtained for each nucleus, and the Δt was defined by subtracting the t0-MS2 from t0-PP7. Then Δt was used to calculate the elongation rate (Figure S1B and C).
(3) The third method used a least squares optimization to find the time delay (Δt) between MS2 and PP7 traces. PP7 traces were first scaled to match the maximum amplitude of the MS2 traces, by multiplying with a scaling factor. Then by shifting the PP7 traces in incremental time, Δt that minimizes the squared sum between shifted PP7 trace and the corresponding MS2 trace was obtained. Δt for each nucleus was measured, and it was subsequently used to calculate the elongation rate (Figure S1D-F).
For the anterior-posterior or the dorsal-ventral bins, size of each bin spans 20 μm. In Figure S4, the time delay from the peak to the baseline (decay time) was measured from the profile of transcriptional bursting obtained in [9]. The elongation rate was estimated by dividing the length of the template DNA (yellow) by the decay time.
Supplementary Material
Acknowledgments
We thank Evangelos Gatzogiannis for instruction and help with confocal imaging, and the Bloomington Drosophila Stock Center for fly strains. We are also grateful to Thomas Gregor and members of the Levine laboratory for discussions. T.F. is the recipient of a Human Frontier Science Program Long-Term Fellowship. B.L. is the recipient of a National Institutes of Health postdoctoral fellowship (1F32GM122186). This study was funded by grants from the National Institutes of Health (U01EB021239 and GM118147).
Footnotes
Author Contributions: T.F. and M.L. designed the experiments and wrote the manuscript. T.F. performed the experiments and B.L. performed the image analysis. All the authors discussed the results and approved the manuscript.
Publisher's Disclaimer: This is a PDF file of an unedited manuscript that has been accepted for publication. As a service to our customers we are providing this early version of the manuscript. The manuscript will undergo copyediting, typesetting, and review of the resulting proof before it is published in its final citable form. Please note that during the production process errors may be discovered which could affect the content, and all legal disclaimers that apply to the journal pertain.
References
- 1.Jonkers I, Lis JT. Getting up to speed with transcription elongation by RNA polymerase II. Nat Rev Mol Cell Biol. 2015;16:167–177. doi: 10.1038/nrm3953. [DOI] [PMC free article] [PubMed] [Google Scholar]
- 2.Ardehali MB, Yao J, Adelman K, Fuda NJ, Petesch SJ, Webb WW, Lis JT. Spt6 enhances the elongation rate of RNA polymerase II in vivo. EMBO J. 2009;28:1067–1077. doi: 10.1038/emboj.2009.56. [DOI] [PMC free article] [PubMed] [Google Scholar]
- 3.O'Brien T, Lis JT. Rapid changes in Drosophila transcription after an instantaneous heat shock. Mol Cell Biol. 1993;13:3456–3463. doi: 10.1128/mcb.13.6.3456. [DOI] [PMC free article] [PubMed] [Google Scholar]
- 4.Shermoen AW, O'Farrell PH. Progression of the cell cycle through mitosis leads to abortion of nascent transcripts. Cell. 1991;67:303–310. doi: 10.1016/0092-8674(91)90182-x. [DOI] [PMC free article] [PubMed] [Google Scholar]
- 5.Thummel CS, Burtis KC, Hogness DS. Spatial and temporal patterns of E74 transcription during Drosophila development. Cell. 1990;61:101–111. doi: 10.1016/0092-8674(90)90218-4. [DOI] [PubMed] [Google Scholar]
- 6.Yao J, Ardehali MB, Fecko CJ, Webb WW, Lis JT. Intranuclear distribution and local dynamics of RNA polymerase II during transcription activation. Mol Cell. 2007;28:978–990. doi: 10.1016/j.molcel.2007.10.017. [DOI] [PubMed] [Google Scholar]
- 7.Bothma JP, Magliocco J, Levine M. The Snail repressor inhibits release, not elongation, of paused Pol II in the Drosophila embryo. Curr Biol. 2011;21:1571–1577. doi: 10.1016/j.cub.2011.08.019. [DOI] [PMC free article] [PubMed] [Google Scholar]
- 8.Bothma JP, Garcia HG, Esposito E, Schlissel G, Gregor T, Levine M. Dynamic regulation of eve stripe 2 expression reveals transcriptional bursts in living Drosophila embryos. Proc Natl Acad Sci U S A. 2014;111:10598–10603. doi: 10.1073/pnas.1410022111. [DOI] [PMC free article] [PubMed] [Google Scholar]
- 9.Fukaya T, Lim B, Levine M. Enhancer Control of Transcriptional Bursting. Cell. 2016;166:358–368. doi: 10.1016/j.cell.2016.05.025. [DOI] [PMC free article] [PubMed] [Google Scholar]
- 10.Groth AC, Fish M, Nusse R, Calos MP. Construction of transgenic Drosophila by using the site-specific integrase from phage phiC31. Genetics. 2004;166:1775–1782. doi: 10.1534/genetics.166.4.1775. [DOI] [PMC free article] [PubMed] [Google Scholar]
- 11.Hocine S, Raymond P, Zenklusen D, Chao JA, Singer RH. Single-molecule analysis of gene expression using two-color RNA labeling in live yeast. Nat Methods. 2013;10:119–121. doi: 10.1038/nmeth.2305. [DOI] [PMC free article] [PubMed] [Google Scholar]
- 12.Blythe SA, Wieschaus EF. Establishment and maintenance of heritable chromatin structure during early Drosophila embryogenesis. Elife. 2016;5 doi: 10.7554/eLife.20148. [DOI] [PMC free article] [PubMed] [Google Scholar]
- 13.Esposito E, Lim B, Guessous G, Falahati H, Levine M. Mitosis-associated repression in development. Genes Dev. 2016;30:1503–1508. doi: 10.1101/gad.281188.116. [DOI] [PMC free article] [PubMed] [Google Scholar]
- 14.Nien CY, Liang HL, Butcher S, Sun Y, Fu S, Gocha T, Kirov N, Manak JR, Rushlow C. Temporal coordination of gene networks by Zelda in the early Drosophila embryo. PLoS Genet. 2011;7:e1002339. doi: 10.1371/journal.pgen.1002339. [DOI] [PMC free article] [PubMed] [Google Scholar]
- 15.Driever W, Nüsslein-Volhard C. The bicoid protein is a positive regulator of hunchback transcription in the early Drosophila embryo. Nature. 1989;337:138–143. doi: 10.1038/337138a0. [DOI] [PubMed] [Google Scholar]
- 16.Dunipace L, Ozdemir A, Stathopoulos A. Complex interactions between cis-regulatory modules in native conformation are critical for Drosophila snail expression. Development. 2011;138:4075–4084. doi: 10.1242/dev.069146. [DOI] [PMC free article] [PubMed] [Google Scholar]
- 17.Perry MW, Boettiger AN, Bothma JP, Levine M. Shadow enhancers foster robustness of Drosophila gastrulation. Curr Biol. 2010;20:1562–1567. doi: 10.1016/j.cub.2010.07.043. [DOI] [PMC free article] [PubMed] [Google Scholar]
- 18.Bothma JP, Garcia HG, Ng S, Perry MW, Gregor T, Levine M. Enhancer additivity and non-additivity are determined by enhancer strength in the Drosophila embryo. Elife. 2015;4 doi: 10.7554/eLife.07956. [DOI] [PMC free article] [PubMed] [Google Scholar]
- 19.Jonkers I, Kwak H, Lis JT. Genome-wide dynamics of Pol II elongation and its interplay with promoter proximal pausing, chromatin, and exons. Elife. 2014;3:e02407. doi: 10.7554/eLife.02407. [DOI] [PMC free article] [PubMed] [Google Scholar]
- 20.Chen K, Johnston J, Shao W, Meier S, Staber C, Zeitlinger J. A global change in RNA polymerase II pausing during the Drosophila midblastula transition. Elife. 2013;2:e00861. doi: 10.7554/eLife.00861. [DOI] [PMC free article] [PubMed] [Google Scholar]
- 21.Danko CG, Hah N, Luo X, Martins AL, Core L, Lis JT, Siepel A, Kraus WL. Signaling pathways differentially affect RNA polymerase II initiation, pausing, and elongation rate in cells. Mol Cell. 2013;50:212–222. doi: 10.1016/j.molcel.2013.02.015. [DOI] [PMC free article] [PubMed] [Google Scholar]
- 22.Fuchs G, Voichek Y, Benjamin S, Gilad S, Amit I, Oren M. 4sUDRB-seq: measuring genomewide transcriptional elongation rates and initiation frequencies within cells. Genome Biol. 2014;15:R69. doi: 10.1186/gb-2014-15-5-r69. [DOI] [PMC free article] [PubMed] [Google Scholar]
- 23.Hocine S, Raymond P, Zenklusen D, Chao JA, Singer RH. Single-molecule analysis of gene expression using two-color RNA labeling in live yeast. Nat Methods. 2013;10:119–121. doi: 10.1038/nmeth.2305. [DOI] [PMC free article] [PubMed] [Google Scholar]
- 24.Veloso A, Kirkconnell KS, Magnuson B, Biewen B, Paulsen MT, Wilson TE, Ljungman M. Rate of elongation by RNA polymerase II is associated with specific gene features and epigenetic modifications. Genome Res. 2014;24:896–905. doi: 10.1101/gr.171405.113. [DOI] [PMC free article] [PubMed] [Google Scholar]
- 25.Corrigan AM, Tunnacliffe E, Cannon D, Chubb JR. A continuum model of transcriptional bursting. Elife. 2016;5 doi: 10.7554/eLife.13051. [DOI] [PMC free article] [PubMed] [Google Scholar]
- 26.Garcia HG, Tikhonov M, Lin A, Gregor T. Quantitative imaging of transcription in living Drosophila embryos links polymerase activity to patterning. Curr Biol. 2013;23:2140–2145. doi: 10.1016/j.cub.2013.08.054. [DOI] [PMC free article] [PubMed] [Google Scholar]
Associated Data
This section collects any data citations, data availability statements, or supplementary materials included in this article.


