

ABSTRACT
Myeloid-derived suppressor cells (MDSC) promote tumor growth by blocking anti-tumor T cell responses. Recent reports show that MDSC increase fatty acid uptake and fatty acid oxidation (FAO) to support their immunosuppressive functions. Inhibition of FAO promoted a therapeutic T cell-mediated anti-tumor effect. Here, we sought to determine the mechanisms by which tumor-infiltrating MDSC increase the uptake of exogenous lipids and undergo metabolic and functional reprogramming to become highly immunosuppressive cells. The results showed that tumor-derived cytokines (G-CSF and GM-CSF) and the subsequent signaling through STAT3 and STAT5 induce the expression of lipid transport receptors with the resulting increase in the uptake of lipids present at high concentrations in the tumor microenvironment. The intracellular accumulation of lipids increases the oxidative metabolism and activates the immunosuppressive mechanisms. Inhibition of STAT3 or STAT5 signaling or genetic depletion of the fatty acid translocase CD36 inhibits the activation of oxidative metabolism and the induction of immunosuppressive function in tumor-infiltrating MDSC and results in a CD8+ T cell-dependent delay in tumor growth. Of note, human tumor-infiltrating and peripheral blood MDSC also upregulate the expression of lipid transport proteins, and lipids promote the generation of highly suppressive human MDSC in vitro. Our data therefore provide a mechanism by which tumor-derived factors and the high lipid content in the tumor microenvironment can cause the profound metabolic and functional changes found in MDSC and suggest novel approaches to prevent or reverse these processes. These results could further enhance the efficacy of cancer immunotherapy.
KEYWORDS: Immunometabolism, immune suppression, lipids, MDSC, tumor microenvironment
Introduction
Myeloid-derived suppressor cells (MDSC) represent an important barrier to the full therapeutic success of cancer immunotherapy. MDSC represent a heterogeneous population of myeloid progenitor cells whose normal maturation into macrophages, dendritic cells (DC), and neutrophils is impaired in tumors and other chronic inflammatory conditions.1-4 MDSC suppress anti-tumor T cell responses by depleting arginine, secreting reactive oxygen and nitrogen species, and expressing immune checkpoint ligands.5,6 Additionally, MDSC directly support tumor cells by promoting cancer stemness, angiogenesis, and metastasis.7,8 Despite their importance in tumor progression, strategies to block MDSC have been limited to the use of myelosuppressive drugs (cyclophosphamide and gemcitabine) and multi-tyrosine kinase inhibitors (sunitinib) that are only partially effective and, in the case of chemotherapy, indirectly promote the expansion of MDSC.9,10
Recent evidence has shown that metabolic reprogramming from glycolysis to lipid metabolism is an important regulator of the differentiation and function of distinct subsets of myeloid cells. For instance, IL-4-induced M2 macrophages rely on fatty acid oxidation (FAO) to proliferate and support their function. This process is mediated through signal transducer and activator of transcription 6 (STAT6) and PPARγ-co-activator 1β (PGC1β).11,12 More recent work has shown that the uptake of triacylglycerols followed by lipolysis is critical for M2 activation.13 Inhibition of this process inhibits M2 function and blocks a therapeutic response to helminth infections.13 Likewise, tumor-infiltrating DC accumulate high levels of intracellular triglycerides, a process that is in part mediated through endoplasmic reticulum (ER) stress response factor XBP1.14 The increased lipid accumulation in DC impairs their ability to process and present antigens and therefore to stimulate T cells.15,16 Decreasing the lipid content by inhibiting fatty acid synthesis restores DC functions and improves the efficacy of cancer vaccines.15 More recently, polymorphonuclear MDSC (PMN-MDSC) have been shown to overexpress lectin-type oxidized LDL receptor-1 (LOX1), which could identify a sub-population of ER-stressed, immunosuppressive PMN-MDSC in cancer patients.17 Overall, these accumulated reports have increased the realization that myeloid immune cells can choose the metabolic programs that allow them to meet their survival and functional demands under the conditions present in the surrounding microenvironment. As such, a better understanding of these metabolic pathways could provide novel therapeutic targets in cancer and other chronic inflammatory diseases.18,19
In light of these findings, we recently reported that tumor-infiltrating MDSC use FAO as their primary source of ATP.20,21 Moreover, pharmacologic inhibition of FAO blocks the immunosuppressive function of MDSC, delays tumor growth in a T cell-dependent manner, and enhances the efficacy of low-dose chemotherapy and adoptive T cell therapy.21 In this study, we investigated the mechanisms by which the tumor microenvironment would induce the uptake of exogenous lipids and enhance the metabolic and functional reprogramming of tumor-associated MDSC. The results showed that tumor-derived cytokines (G-CSF and GM-CSF) induce the upregulation of lipid transport receptors in tumor-infiltrating myeloid cells, which results in an increased uptake of lipids found at high concentrations in the tumor microenvironment. This coincides with an enhanced oxidative metabolism and activation of immunosuppressive mechanisms. Interestingly, human tumor-infiltrating and peripheral blood MDSC also express noticeable levels of lipid transport proteins, and lipids favor the development of more immunosuppressive human MDSC in vitro. The data presented here suggest that tumor-derived factors facilitate the lipid uptake, accumulation, and metabolism by myeloid cells, which lead to the induction of immunosuppressive functions characteristic of MDSC. This may provide novel targets for therapeutic intervention that could enhance the efficacy of chemotherapy or immunotherapy of cancer.
Results
Tumor-infiltrating MDSC have increased expression of lipid transport receptors and uptake of different forms of lipids
We recently reported that upon infiltrating the tumor microenvironment, myeloid cells increase the uptake of fatty acids and activate FAO that eventually leads to the upregulation of their immunosuppressive function.21 Therefore, we aimed to determine the possible mechanisms regulating this process. To this end, we initially examined the expression of receptors involved in lipid uptake in CD11b+Gr1+ cells harvested from subcutaneous Lewis lung carcinoma 3LL (tumor-infiltrating MDSC) and the spleens of tumor-bearing mice (splenic MDSC), compared with normal myeloid cells from the spleens of control mice (immature myeloid cells; iMC). Tumor-infiltrating MDSC showed an increased mRNA encoding for lipid transport receptors that participate in the uptake fatty acids and/or triacylglycerol-carrying lipoprotein, including Slc27a1 (Fatp1), Slc27a3 (Fatp3), Slc27a6 (Fatp6), Fabp5, Acsl3, Acsl4, Msr1, CD36, CD68, Lrp1, Vldlr, and Ldlr (Fig. 1A). The highest expression levels were seen in Slc27a1 (Fatp1), Slc27a6 (Fatp6), Msr1, CD36, and Vldlr. We then tested the ability of the same myeloid cell populations to acquire different lipid species. Tumor-infiltrating MDSC took up higher amounts of fluorescently labeled free fatty acids (Bodiby FL C16; Fig. 1B) and triacylglycerol-rich very low density lipoprotein VLDL (Dil VLDL; Fig. 1C) and low density lipoprotein LDL (Dil LDL; Fig. 1D), compared with splenic MDSC or iMC. This resulted in an increase in the total intracellular fat content as evidenced by staining with Bodipy 493/503 (Fig. 1E). These results were confirmed using MDSC isolated from ascites of mice bearing peritoneal EL-4 tumors, which also showed an increased uptake of Bodiby FL C16 (Fig. 1F) and neutral lipid content (Bodipy 493/503; Fig. 1G), when compared with iMC isolated from the peritoneum of normal mice. Our data further showed that tumor-infiltrating PMN-MDSC (CD11b+Ly6ClowLy6G+) and monocytic MDSC (M-MDSC; CD11b+Ly6ChighLy6G−) could similarly take up higher amounts of Bodiby FL C16 (Fig. S1A) and accumulate more lipids (Bodipy 493/503; Fig. S1B) than cells sharing the same phenotype within the spleens of tumor-bearing mice or normal mice. These results suggest that, upon entering the tumor microenvironment, MDSC encounter signals that induce the expression of lipid transport receptors, which could then internalize lipids from the microenvironment.
Figure 1.

Tumor-infiltrating MDSC upregulate the expression of lipid transport receptors and take up substantial amounts of exogenous lipids. C57BL/6J mice were subcutaneously injected with 1 × 10⁶ 3LL cells, and tumors and spleens were harvested 3 weeks later. Spleens were also harvested from control mice. (A) RT-PCR of genes that facilitate lipid uptake in sorted iMC, splenic MDSC, and tumor-infiltrating MDSC (T-MDSC), and relative expression heat map is also shown. A gene is differentially expressed when fold > 2 and P < 0.05. (B-D) Lipid uptake was determined in iMC, splenic MDSC, and tumor-infiltrating MDSC by staining single cell suspensions with CD11b and Gr1 followed by the incubation with Bodipy FL C16 (B), DiI VLDL (C), or DiI LDL (D). Histograms were gated on CD11b+Gr1+ cells, and average MFI is shown for each staining. (E) Similarly, intracellular lipid content was measured by staining with Bodipy 493/503, and average MFI is also depicted. (F-G) C57BL/6J mice were intraperitoneally injected with 5 × 10⁵ EL-4 cells, and malignant ascites or normal peritoneal lavage was harvested after 3 weeks. Bodipy FL C16 (F) and Bodipy 493/503 (G) staining were determined in T-MDSC from ascites or iMC from normal peritoneal lavage. Average MFI is shown. Data = mean ± SEM; representative of at least 3 independent experiments; *, P < 0.05; **, P < 0.01; ***, P < 0.001; ****, P < 0.0001.
Tumor-derived factors trigger lipid uptake, oxidative metabolism, and tolerogenic function in MDSC
We next investigated which tumor-derived factors could upregulate the expression of lipid transport receptors in tumor-infiltrating MDSC. We first measured the concentration of several inflammatory cytokines in 3LL tumor explant supernatant (TES). The results consistently showed elevated inflammatory cytokines, with G-CSF, GM-CSF, and IL-6 displaying the highest levels (Fig. 2A). Other cytokines such as IL-1β and IL10 were also found in TES but at significantly lower levels. A similar profile of inflammatory cytokines was observed in supernatants of EL-4 ascites relative to peritoneal fluid of normal mice (Fig. S2A). However, 3LL and EL-4 tumor cell lines produced minimal concentrations (0–10 pg/mL) of these cytokines in vitro. To identify the source of these factors in the tumor microenvironment, we examined the expression of G-CSF, GM-CSF, and IL-6 in CD49f+ tumor cells and CD11b+ myeloid cells sorted from 3LL subcutaneous tumors. We found that tumor cells expressed more G-CSF and GM-CSF, while myeloid cells expressed higher levers of IL-6 (Fig. 2B). Additionally, as expected the increase in these factors appeared to be a characteristic of chronic inflammatory conditions, particularly cancer, since peritoneal supernatants from thioglycolate-elicited mice showed modest levels of G-CSF, GM-CSF, and IL-6, compared with those from EL-4 ascites (Fig. S2B).
Figure 2.

Tumor-derived factors promote the expression of lipid transport receptors and lipid uptake in MDSC. (A) The indicated cytokines were measured in normal spleen explant supernatant, tumor-bearer spleen explant supernatant, or 3LL TES. (B) CD49f+ tumor cells and CD11b+ myeloid cells were sorted by flow cytometry from 3LL subcutaneous tumors. RT-PCR of the indicated genes was conducted. (C-E) BM precursors were cultured for 4 d with 20% TES, G-CSF, GM-CSF, or a combination of G-CSF, GM-CSF, and IL-6. Each cytokine was used at 40 ng/mL. Unstimulated freshly isolated BM cells were used as control. (C) RT-PCR of lipid uptake genes in BM-derived cells. Genes are differentially expressed when fold > 2 and P < 0.05. (D-E) Flow cytometric staining with Bodipy FL C16 (D) and Bodipy 493/503 (E) in CD11b+Gr1+ BM-derived cells. MFI averages are shown. Data = mean ± SEM; representative of at least 3 independent experiments; *, P < 0.05; **, P < 0.01; ***, P < 0.001; ****, P < 0.0001.
We then tested the effect of TES, G-CSF, GM-CSF, or a combination of these cytokines (G-CSF/GM-CSF/IL-6) on the induction of lipid transport receptors, lipid uptake, and metabolic reprogramming of bone marrow (BM) myeloid precursors. We used 40 ng/mL of each cytokine, a concentration widely used to generate MDSC in vitro.22,23 This cytokine concentration, however, was similar to or slightly higher than that found in TES or ascites preparations, which involve dilution in media (in case of TES) or PBS (in case of ascites supernatants). BM precursors cultured in TES, G-CSF, GM-CSF, or a combination of G-CSF, GM-CSF, and IL-6 (IL-6 alone could not maintain the viability of myeloid precursors) upregulated the expression of a similar group of genes coding for lipid transport receptors as found in tumor-infiltrating MDSC, namely Slc27a1 (Fatp1), Slc27a3 (Fatp3), Slc27a6 (Fatp6), Fabp1, Fabp3, Fabp4, Fabp5, Acsl3, Acsl4, Msr1, Marco, CD36, Scarb1, Lrp1, Lrp8, Vldlr, and Ldlr (Fig. 2C). Similar to tumor-infiltrating MDSC, we also found a significant increase in the uptake of Bodiby FL C16 (Fig. 2D) and accumulation of neutral lipids (Bodipy 493/503; Fig. 2E). Moreover, BM myeloid precursors cultured under these conditions developed the characteristic increase in oxidative phosphorylation,21 as demonstrated by an increased oxygen consumption rate (OCR; Fig. 3A), the induction of mRNA encoding for immunosuppressive mechanisms (arginase I and inducible nitric oxide synthase iNOS) (Fig. 3B), and the ability to suppress the proliferation of activated T cells (Fig. 3C). In addition, these immunometabolic results seemed to be most pronounced in MDSC generated in the presence of TES or a combination of G-CSF, GM-CSF, and IL-6, indicative of the role of multiple factors in the tumor microenvironment in the induction of MDSC.
Figure 3.

Tumor-derived factors and signaling through STAT3/5 are critical for inducing the metabolic and functional programming in MDSC. (A-C) BM precursors were cultured for 4 d with 20% TES, G-CSF, GM-CSF, or a combination of G-CSF, GM-CSF, and IL-6. Cytokines were used at 40 ng/mL each. Unstimulated freshly isolated BM cells served as control. (A) OCR (mean ± SD) measured by extracellular flux analysis. (B) RT-PCR of genes linked to MDSC immunosuppressive pathways. Genes are differentially expressed when fold > 2 and P < 0.05. (C) The suppressive function of BM-derived myeloid cells was measured. Activated CFSE-labeled CD3+ T cells were cocultured with BM-derived cells, and T cell proliferation was assessed by flow cytometry 3 d later. (D) STAT3 and STAT5 phosphorylation in BM cells stimulated with G-CSF, GM-CSF, IL-6, TES, a combination of G-CSF, GM-CSF, and IL-6, or vehicle for 30 minutes. (E-H) BM precursors were stimulated with a combination of G-CSF, GM-CSF, and IL-6 in the absence or presence of FLLL32 (3.5 μM) or pimozide (6.5 μM) for 4 d. Vehicle (DMSO) was included. (E) Flow cytometric staining with Bodipy 493/503 in CD11b+Gr1+ BM-derived cells. MFI average is depicted. (F) Mitochondrial respiration evaluated by OCR (mean ± SD). (G) RT-PCR of MDSC immunosuppressive genes. A gene is differentially expressed when fold > 2 and P < 0.05. (H) Suppressive function was assessed. Data = mean ± SEM; representative of at least 3 independent experiments; *, P < 0.05; **, P < 0.01; ****, P < 0.0001.
We further tested the role of G-CSF, GM-CSF, and IL-6 in the induction of metabolic reprograming of MDSC by blocking STAT3 or STAT5, the kinases associated with the receptors for these cytokines. Incubation of BM myeloid precursors with G-CSF, GM-CSF, IL-6, TES, or a combination of G-CSF/GM-CSF/IL-6 induced the phosphorylation of STAT3, while the phosphorylation of STAT5 was induced only by GM-CSF alone or combinations where GM-CSF was present (TES or G-CSF/GM-CSF/IL-6) (Fig. 3D). We then stimulated BM precursors with a combination of G-CSF, GM-CSF, and IL-6 in the absence or presence of the JAK2/STAT3 inhibitor FLLL32 or the STAT5 inhibitor pimozide for 4 d. The results showed that FLLL32 or pimozide did not significantly induce apoptosis of BM-derived MDSC (Fig. S3). Both inhibitors decreased the total intracellular neutral lipid (Bodipy 493/503) by approximately 45% (Fig. 3E) and significantly blocked the oxidative metabolism as measured by OCR (Fig. 3F), as compared with vehicle (DMSO). More importantly, both inhibitors also prevented the induction of arginase I and iNOS (Fig. 3G) and blocked the development of the immunosuppressive functions of MDSC (Fig. 3H). Thus, both STAT3 and STAT5 activated by tumor-derived factors are important mediators of the metabolic and functional polarization of MDSC.
Lipids in the tumor microenvironment promote the induction of immunosuppressive MDSC
Because of the rapid uptake of lipids by MDSC, we tested whether there was an increase in lipids in the tumor microenvironment, which types of lipids were elevated, and whether these lipids would promote the conversion of myeloid cells into metabolically active immunosuppressive MDSC. Lipidomic analysis was done in ascites of EL-4 bearing mice collected 21 d after tumor implantation and normal peritoneal fluid from control mice. The results showed significantly higher concentrations of monounsaturated and polyunsaturated fatty acids (Fig. 4A and 4B) and triacylglycerols (Fig. 4D). The data also showed higher levels of saturated fatty acids, but this increase did not achieve statistical significance (Fig. 4C). A detailed lipidomic analysis of the different fatty acids is shown in Fig. S4. We then tested the role of the different lipids in the induction of MDSC. For this, we generated BM-derived MDSC (stimulated with G-CSF, GM-CSF, and IL-6) in complete (10% FBS) tissue culture media (TCM), lipid-deprived tissue culture media (LDM), or LDM media supplemented with unsaturated fatty acids (oleic acid or linoleic acid),24,25 VLDL, or LDL13 at concentrations similar to those found in TCM (not shown). The results showed that MDSC derived in LDM accumulated significantly less neutral lipid than those cultured in TCM. However, all lipid species increased the intracellular accumulation of lipids, and this effect was particularly significant with VLDL (Fig. 5A). The differences in lipid content were also paralleled by corresponding increases in oxidative metabolism (OCR; Fig. 5B). Similarly, the supplementation of LDM with lipids increased the induction of mRNA for the immunosuppressive molecules arginase I and iNOS, while lipid depletion (LDM) prevented their upregluation (Fig. 5C). This coincided with the ability of BM-derived MDSC to suppress T cell proliferation, which was lowest in MDSC cultured in LDM, as compared with those cultured in linoleic and oleic acid, and was maximal at the higher concentrations of VLDL and LDL (Fig. 5D and 5E). Interestingly, culture of BM-derived MDSC in LDM containing the saturated fatty acid palmitate24 did not induce oxidative metabolic activity (OCR; Fig. 5F) or immunosuppressive function (Fig. 5G), without affecting the viability of cells (not shown). Furthermore, to test which pathway was most essential in the lipid-mediated immunosuppression in MDSC, we added nor-NOHA (arginase I inhibitor), L-NMMA (NOS inhibitor), or MnTBAP (peroxynitrite [PNT] scavenger) to the T cell-MDSC coculture. Given that arginine depletion via arginase I plays a critical role in MDSC-driven immune suppression independently of cell to cell contact,26,27 nor-NOHA had no effect. However, L-NMMA or MnTBAP abrogated the suppressive effect of TCM-cultured MDSC or LDM-cultured VLDL-supplemented MDSC (Fig. 5H), suggestive of the role of nitric oxide and PNT production in lipid-induced MDSC suppression. Collectively, our data indicate that MDSC are dependent on exogenous lipids to fuel oxidative metabolism and elicit immune suppression.
Figure 4.
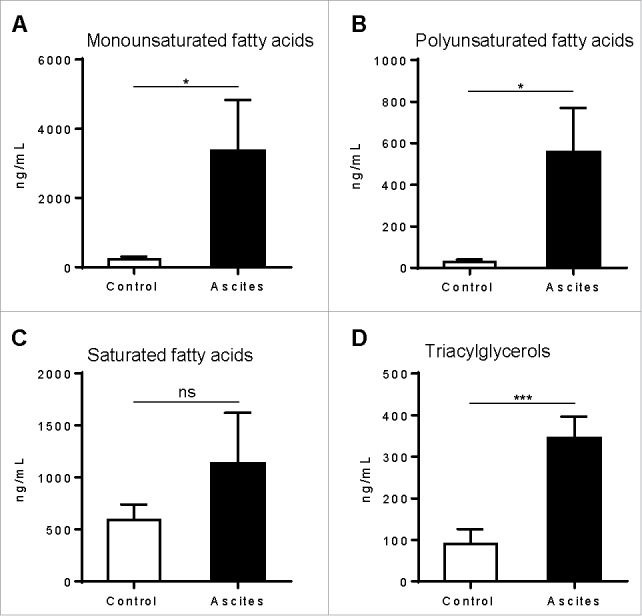
The tumor microenvironment is rich in lipids. C57BL/6J mice were intraperitoneally injected with 5 × 10⁵ EL-4 cells, and supernatants of malignant ascites or normal peritoneal fluid were harvested after 3 weeks using the same volume of PBS (1 mL). Fatty acids and triacylglycerols were extracted and quantitatively analyzed via LC-MS. Depicted are total monounsaturated (A) and polyunsaturated (B) fatty acids, saturated fatty acids (C), and triacylglycerols (D). Data = mean ± SEM; representative of 2 independent experiments; *, P < 0.05; ***, P < 0.001.
Figure 5.

Exogenous lipids enhance the generation of immunosuppressive MDSC. BM precursors were stimulated with a combination of G-CSF, GM-CSF, and IL-6 for 4 d using TCM, LDM, or LDM supplemented with oleic acid (25 μM), linoleic acid (25 μM), palmitate (25 μM), VLDL (50 μg/mL), or LDL (50 μg/mL). (A) Flow cytometric staining with Bodipy 493/503 in CD11b+Gr1+ BM-derived cells. (B) OCR (mean ± SD) was determined. (C) RT-PCR of MDSC immunosuppressive genes. A gene is differentially expressed when fold > 2 and P < 0.05. (D-E) The immunosuppressive ability of BM-derived cells to suppress T cell proliferation was measured. For the experiment in (E) VLDL and LDL were used at 5, 25, or 50 μg/mL. (F-G) OCR (mean ± SD; F) and suppressive function (G) of BM-derived cells cultured in palmitate-supplemented LDM. (H) Cytokine-stimulated BM cells were cultured in TCM, LDM, or LDM supplemented with VLDL (50 μg/mL). After 4 d, the suppressive function of BM-derived cells was determined with the addition of nor-NOHA (200 μM), L-NMMA (500 μM), or MnTBAP (100 μM) to the T cell-MDSC coculture. Data = mean ± SEM; representative of at least 3 independent experiments; *, P < 0.05; **, P < 0.01; ***, P < 0.001; ****, P < 0.0001.
Effect of CD36 deletion on the metabolism and function of tumor-infiltrating MDSC
We next tested whether inhibiting CD36, an important fatty acid translocase also known to be critical for M2 activation,13 would have an impact on the induction of tumor-associated MDSC. We used CD36 total KO mice due to the unavailability of CD36 conditional KO mice at present. We first compared tumor growth in wild type (WT) and CD36 knockout (KO) mice subcutaneously injected with murine tumors, 3LL lung carcinoma or MCA-38 colon cancer. We observed a significant delay in the growth of both tumors in CD36 KO mice (Fig. 6A and 6B). The anti-tumor effect was T cell dependent since the depletion of CD8+, but not CD4+, T cells eliminated the anti-tumor effect in 3LL-bearing CD36 KO mice (Fig. 6C). We further confirmed that the decreased tumor growth in the CD36 KO mice was related to the decreased immunosuppressive MDSC and not caused by other stromal defects (such as angiogenesis) affecting tumor growth by reconstituting lethally irradiated WT CD45.1+ mice with BM from CD36 KO mice (CD45.2+). Seven weeks after transplant, more than 90% chimerism was observed in all conditions (Fig. S5). Then, chimeric mice and non-irradiated CD45.2+ WT or CD36 KO mice were subcutaneously injected with 3LL cells, and tumor growth was recorded. A similar decrease in tumor growth kinetics was observed in mice reconstituted with CD36 KO BM and CD36 KO mice, compared with control mice (Fig. 6D). Interestingly, we found a moderate decrease in the number of total MDSC infiltrating the tumor in CD36 KO mice, with a preferential decrease in the percentage of PMN-MDSC (Fig. 6C). MDSC from CD36 KO mice had a decreased uptake of Bodiby FL C16 (Fig. 6D), diminished neutral lipid content (Fig. 6E), and lower oxidative metabolism (OCR; Fig. 6F), compared with MDSC from WT mice. Furthermore, CD36 KO MDSC showed a decreased expression of arginase I and iNOS (Fig. 6G) and were less immunosuppressive of T cell proliferation (Fig. 6H) than WT MDSC. Together, these results point out the role of CD36 in MDSC function and tumor growth.
Figure 6.

CD36 deletion delays tumor growth and alters the immunometabolic activity of tumor-infiltrating MDSC. (A-B) WT and CD36 KO mice were subcutaneously injected with 3LL cells (A) or MCA-38 cells (B), and tumor growth was recorded. (C) 3LL-bearing mice were injected with depleting antibodies for CD4+ or CD8+ T cells, and tumor growth was measured. (D) BM chimeras were constructed as described in Methods. Tumor growth is depicted. (E-J) WT and CD36 KO mice were subcutaneously injected with 3LL cells, and tumors were removed after 3 weeks for immunometaolic analyses. (E) The frequency of total MDSC, PMN-MDSC, and M-MDSC was determined in WT and CD36 KO tumor single cell suspensions by flow cytometry. (F-G) Flow cytometric staining with Bodipy FL C16 (F) or Bodipy 493/503 (G) in CD11b+Gr1+ tumor-infiltrating MDSC. (H) OCR (mean ± SD) of MDSC sorted from WT or CD36 KO tumors. (I) The expression of arginase I, iNOS, and β-actin was determined by western blot. (J) The immunosuppressive function of MDSC sorted from tumors. Data = mean ± SEM; representative of at least 2 independent experiments; *, P < 0.05; **, P < 0.01; ***, P < 0.001; ****, P < 0.0001.
Human tumor-infiltrating MDSC express lipid transport receptors, and lipids increase the suppressive function of human peripheral blood stem cell (PBSC)-derived MDSC
Next, we tested whether MDSC infiltrating human tumors demonstrate an increased expression of lipid transport receptors. Thus, we examined the expression of CD36 in biopsies from patients with colon adenocarcinoma and renal cell carcinoma. Immunohistochemistry showed a robust expression of CD36 in inflammatory cells, while tumor cells remained mostly negative. Double labeling with antibodies against CD36 and CD66b revealed the high expression of CD36 in MDSC associated with human cancer (Fig. 7A). Likewise, double labeling with antibodies to Msr1 and CD66b showed that human MDSC also expressed high levels of Msr1 (Fig. 7B). To further substantiate these measures, we determined the expression of several lipid transport receptors (CD36, Msr1, CD68, Ldlr, and LOX1) in peripheral blood MDSC from 10 patients with cancer (renal cell carcinoma, breast cancer, and colon cancer). Consistent with previous reports,17-21,28 PMN-MDSC (CD33+ HLA-DR−/low CD14− CD66b+) significantly expanded in cancer patients, while M-MDSC (CD33+ HLA-DRlow CD14+ CD66b−) comprised ∼1–2% of circulating MDSC (Fig. 7C). PMN isolated from 10 normal donors and from the same patients were used as controls. Of interest, PMN-MDSC significantly increased the expression of CD36, Msr1, Ldlr, and LOX1, while CD68 expression was lower than PMN controls (Fig. 7D). Therefore, in addition to LOX1,17 our study suggest that at least CD36 may serve as another marker for human PMN-MDSC. Next, we tested whether exogenous lipids could enhance the immunosuppressive function of human MDSC. For this, human PBSC harvested from G-CSF-treated donors were cultured in TCM with GM-CSF and IL-6 for 7 d and examined for the expression of CD36. Baseline peripheral blood progenitors expressed high levels of CD36, possibly due to the prior G-CSF treatment; however, PBSC-derived MDSC expressed markedly higher amounts of CD36 relative to baseline control (Fig. 7E). We then cultured PBSC-derived MDSC in the absence or presence of VLDL. Interestingly, the addition of exogenous VLDL significantly increased the inhibitory capacity of PBSC-derived MDSC (Fig. 7F), suggesting the importance of lipid uptake in function of human MDSC.
Figure 7.

Human cancer-associated MDSC express lipid transport proteins, and lipids promote the regulatory function of PBSC-derived MDSC. (A) Immunohistochemistry for CD36 in colon adenocarcinomas and renal cell carcinomas (left panels; original magnification is 400x). Double immunofluorescence labeling with anti-CD36 (fluorescein) and anti-CD66b (rhodamine) (right panels; nuclei are counterstained with DAPI; original magnification is 600x). (B) Double immunofluorescence labeling with anti-Msr1 (fluorescein) and anti-CD66b (rhodamine) (original magnification is 600x). Data in A-B represent 3 patients. (C) Phenotype of PMN-MDSC (CD33+ HLA-DR−/low CD14− CD66b+) and M-MDSC (CD33+ HLA-DRlow CD14+ CD66b−) from the peripheral blood of cancer patients. (D) The percentage of PMN-MDSC expressing CD36, Msr1, CD68, Ldlr, or LOX1 was determined in 10 patients with cancer by flow cytometry. PMN from 10 normal donors and from the same patients were used as controls. (E-F) Human PBSC harvested from G-CSF-treated donors were cultured in TCM with 20 ng/mL GM-CSF and IL-6 for 7 d. (E) The percentage of CD33+CD36+ cells was determined by flow cytometry, compared with baseline peripheral blood progenitor cells. (F) Human PBSC were cultured in the absence or presence of VLDL (50 μg/mL), and the suppressive function was assessed. Data in E-F represent 2 PBSC donors. Data = mean ± SEM; **, P < 0.01; ***, P < 0.001; ****, P < 0.0001.
Discussion
Recent reports have shown the importance of lipids in the function of immunosuppressive myeloid cells (M2 macrophages, dendritic cells, and PMN and M-MDSC) in cancer and chronic inflammatory conditions.12-15,17-21 We recently reported that upon entering the tumor microenvironment, myeloid cells undergo metabolic reprograming from glycolysis to FAO, a process that is paralleled by the activation of the immunosuppressive mechanisms arginase I and iNOS and the development of the ability to suppress T cell responses.20,21 This suggested that factors and metabolites in the tumor microenvironment could mediate the immunometabolic induction of MDSC. Herein, we aimed to determine which factors and metabolites might initiate this process. The results show that tumor-derived inflammatory cytokines such as G-CSF and GM-CSF induce the expression of lipid transport receptors that facilitate the uptake of lipids abundant in the tumor microenvironment, including free fatty acids and the triacylglycerol-carrying lipoproteins VLDL and LDL. The uptake, accumulation, and oxidation21 of these lipids sustain the activation of immunosuppressive MDSC. Importantly, human cancer-associated MDSC also express lipid transporters, and therefore human PBSC cultured in lipid-rich media develop into highly inhibitory MDSC.
Similar to our observation, other immune cells can take up and oxidize lipids to sustain their functions.13-25,29-31 While tumor-infiltrating MDSC showed an upregulation of multiple receptors that mediate lipid uptake, recent data indicated that IL-4-induced M2 macrophages mainly increased the expression of CD36 that enhanced the uptake of VLDL and LDL, activated FAO, and induced the characteristic M2 functions.13 A recent study reported that tumor-associated DC preferentially upregulated Msr1 expression, which was primarily responsible for the uptake of exogenous lipids and their accumulation.15 Furthermore, PMN-MDSC from cancer patients increased the expression of LOX1, and LOX1+ PMN-MDSC exhibited a high ER-stress and increased immunosuppressive function.17 Our experiments showed that genetic deletion of CD36 could significantly diminish fatty acid uptake and neutral lipid content, decrease oxidative metabolism, and delay tumor growth through a CD8+ T cell-mediated response. Consistent with the results that stromal CD36 could play an important role in the induction of tumor-infiltrating MDSC, scavenger receptors have previously been found to regulate the pro-tumorigenic function of other tumor-associated immune15 and non-immune32 cells.
Our findings are also significant because they show an abundance of lipids in the tumor microenvironment that can be acquired by MDSC. This observation supports previous reports that show increased levels of triglycerides, LDL-cholesterol, and VLDL-cholesterol in the circulation of cancer patients33-35 and patients with other chronic inflammatory diseases.29-36,37 However, the source of lipids in the tumor milieu remains elusive. Several studies indicated that lipid species released from the adipose tissue provide energy that sustains tumor cell growth and migration.38-40 Therefore, it will be important to explore the metabolic cross-talk between adipocytes and MDSC in the tumor microenvironment. In addition, the mechanisms by which MDSC mobilize the acquired lipids to support the increasing FAO remain to be determined. Adipocytes liberate fatty acids for FAO from lipids stored in lipid droplets by a process of lipolysis, which is regulated by several enzymes such adipose triglyceride lipase, hormone-sensitive lipase, and lysosomal acid lipase (LAL).41 Recent studies showed that LAL-mediated lipolysis was responsible for the release of fatty acids required to support FAO in IL-4-induced M2 macrophages13 and IL-15-driven memory T cells.42 Furthermore, lipids can act as ligands for peroxisome proliferator activated receptors (PPARs)43 that have been found to play key roles in the regulation of FAO.44 In line with this, PPARγ and PPARδ, which are induced by STAT6, are known to regulate the alternative activation in macrophages.44 Therefore, further investigation will help identify the exact fate of intracellular lipids in tumor-infiltrating MDSC.
We also show that the metabolic and functional reprogramming of MDSC is likely due to the presence of tumor-derived factors, consistent with data indicating that these factors induce lipid uptake and accumulation in tumor-associated DC.15,16 Although our in vitro results implicate tumor-derived G-CSF and GM-CSF as drivers of the oxidative metabolism and regulatory activity of MDSC, it is reasonable to think that other factors produced in vivo may also play important roles in the induction of MDSC. This study however strengthens the concept that the therapeutic use of G-CSF and GM-CSF may also increase the number and function of MDSC. In fact, several reports have demonstrated that tumor-derived cytokines are major mediators of MDSC differentiation and induction.45,46 GM-CSF, depending on the context and magnitude of stimulation, can either enhance or suppress the immune response. On the one hand, irradiated tumor cells, modified to secrete GM-CSF, can result in the recruitment and differentiation of dendritic cells, thus inducing T cell anti-tumor immunity.47 On the other hand, though, GM-CSF produced in a more sustained way by transplantable and spontaneous tumors has been linked to the generation of immunosuppressive MDSC.48-50
Previous studies indicated that G-CSF and GM-CSF preferentially signal through STAT3 and STAT5, respectively.45,46 Our results using pharmacologic inhibition of STAT3 or STAT5 signaling suggest a role for these regulators in switching myeloid precursors into FAO-dependent immunosuppressive MDSC. We base this on the observation that STAT3 or STAT5 inhibition blocks the lipid accumulation, mitochondrial metabolism, and regulatory mechanisms in MDSC. Congruent with these data, other studies have shown that STAT3 regulates the expression of several genes that are linked to MDSC expansion or function such as IRF8, S100A9, C/EBPβ, IDO1, and PD-L1,23,51-53 thus implying the possibility that these targets might be separately regulated via the same STAT-dependent pathway. It remains to be investigated whether STAT3/5 signaling simultaneously promotes the oxidative metabolism and immunosuppressive mechanisms in MDSC or whether these events are partitioned and take place in a particular order.
Taken together, our findings suggest a critical role of lipid uptake and accumulation in the metabolic and functional reprogramming in MDSC. The regulation of these processes by tumor-derived factor/STAT3/5-dependent mechanisms provide an opportunity to simultaneously target the multiple immunosuppressive pathways harnessed by tumor-associated MDSC. Therefore, future work is needed to assess whether blocking G-CSF, GM-CSF, or STAT3/5 signaling would increase host anti-tumor immune responses and whether these agents would synergize with cancer immunotherapies.
Materials and methods
Human peripheral blood cells
Specimens were obtained from 10 consented cancer patients (renal cell carcinoma, breast cancer, and colon cancer) and 10 normal donors under approved IRB protocols through the Louisiana Cancer Research Center (LCRC) tissue biorepository core. Peripheral blood mononuclear cells (PBMC) were separated on Ficoll-Paque Plus (GE Healthcare Life Sciences). Polymorphonuclear cells (PMN) were isolated from patient and donor samples by suspension over 3% dextran, as described previously.54
Mice and tumor models
C57BL/6J were purchased from Envigo and The Jackson Laboratory. CD36 knockout (KO) mice were obtained from The Jackson Laboratory. Lewis lung carcinoma (3LL), MCA-38 colon adenocarcinoma, and EL-4 thymoma (all from American Type Culture Collection) were cultured in tissue culture media (TCM) RPMI 1640 (Lonza-Biowhittaker) supplemented with 10% FBS (Hyclone), 25 mmol/L HEPES, 4 mmol/L L-glutamine, and 100 U/mL penicillin, streptomycin (all from Life Technologies). Mice were subcutaneously injected with 1 × 10⁶ 3LL cells or 2.5 × 10⁵ MCA-38 cells. We optimized the number of cells to obtain a comparable rate of subcutaneous tumor growth in all tumor models. Tumor volume was measured using calipers and calculated using the formula [(small diameter)2x(large diameter)x0.5]. In vivo measurements were made from non-necrotic tumors, and the average tumor volume at the first measurement (d7) in WT mice was ∼150–200 mm3. In some experiments, mice were intraperitoneally injected with 5 × 10⁵ EL-4 cells, and malignant ascites or normal peritoneal lavage was collected 3 weeks after tumor inoculation. For T cell depletion, mice were intraperitoneally injected with 500 μg/mouse anti-CD4 (GK1.5) or anti-CD8 (2.43) (both from BioXCell) 1 day before and 2 d after tumor injection, followed by injection of 250 μg/mouse every 5 d throughout the experiment.
Bone marrow (BM) chimeras were set up as described previously.55 Briefly, recipient mice (CD45.1) were lethally irradiated with 950 rads followed by the infusion of 1 × 10⁷ BM cells and 1 × 10⁶ splenocytes from CD36 KO donor mice (CD45.2). Chimeric engraftment was verified in peripheral blood 6 weeks after transplantation by flow cytometry. One week later, mice were subcutaneously injected with 1 × 10⁶ 3LL cells, and tumor growth was recorded. The LSU-Institutional animal care and usage committee approved experiments with animals.
Cell culture and drug treatments
To generate MDSC in vitro, freshly isolated murine BM precursors were cultured for 4 d with 20% 3LL tumor explant supernatant (TES)55 or a combination of murine G-CSF, GM-CSF, and IL-6 (all from R&D Systems and used at 40 ng/mL)23 in TCM. In some experiments, BM cells were cultured in lipid-deprived media (LDM) prepared with PHM-L Liposorb (EMD Millipore) per manufacturer's instructions. LDM cultures were supplemented without or with 25 μM palmitate, oleic acid or linoleic acid (all from Sigma) or 5, 25, or 50 μg/mL very low density lipoprotein (VLDL) or low density lipoprotein (LDL) (both from Kalen Biomedical). Fatty acids were prepared and conjugated to bovine serum albumin as described previously.24 When indicated, the following agents were added to BM cells: 3.5 μM JAK2/STAT3 inhibitor FLLL32 (EMD Millipore), 6.5 μM STAT5 inhibitor pimozide (EMD Millipore), 200 μM arginase I inhibitor Nω-hydroxy-nor-Arginine (nor-NOHA; Cayman), 500 μM nitric oxide synthase (NOS) inhibitor L-NG-Monomethylarginine (L-NMMA; EMD Millipore), 100 μM peroxynitrite (PNT) scavenger MnTBAP (EMD Millipore), or vehicle (H2O or DMSO).
Cell isolation
Tumors were digested with DNAse and Liberase (Roche) at 37°C for 1 hour, and tumor-infiltrating MDSC were isolated from tumor single-cell suspensions as described.21-55 Likewise, splenic MDSC and iMC were isolated from spleens of tumor-bearing mice and control mice, respectively. Purity ranged from 90% to 99% as determined by flow cytometry. CD3+ T cells were isolated from spleens of control mice using T cell negative selection kit (eBioscience), and purity exceeded 95%.
Immune suppression assay
CD3+ T cells were labeled with 1 μmol/L carboxyfluorescein diacetate succinimidyl ester (CFSE; Molecular Probes) and were cocultured with tumor or BM-derived MDSC at a ratio of 8 T cells to 1 MDSC in the presence of plate-bound anti-CD3 (145–2C11)/anti-CD28 (37.51); both antibodies were from BD Biosciences and used at 1 μg/mL each. T cell proliferation was measured by flow cytometry 3 d later as indicated by CFSE dilution.
Flow cytometry
The following fluorochrome-conjugated human antibodies were used to characterize cell subtypes: CD33 (WM53), HLA-DR (G46–6), CD36 (NL07), Ldlr (C7), CD68 (Y1/82A), Msr1 (U23–56) (all from BD Biosciences), CD14 (61D3; eBioscence), CD66b (80H3; Beckman Coulter), and LOX1 (15C4; BioLegend). Fluorochrome-conjugated mouse antibodies specific for CD11b (M1/70), Gr1 (RB6–8C5), Ly6C (AL-21), Ly6G (1A8), and CD49f (GOH3) were purchased from BD Biosciences. Live/Dead cell staining kit was from Molecular Probes (Life Technologies). To quantify the neutral lipid content, cells were first stained with surface markers and then with 250 ng/mL Bodipy 493/503 (Life Technologies) in PBS for 10 minutes at room temperature. To test the uptake of lipids in vitro, cells were stained with surface markers and then incubated at 37°C for 30 minutes with 1 μM Bodipy-conjugated palmitate (Bodipy FL C16; Life Technologies) or 0.5 μg/mL Dil-conjugated VLDL (Dil VLDL) or LDL (Dil LDL; both from Kalen Biomedical) in TCM.
Extracellular flux analysis
Oxygen consumption rate (OCR) was measured using XFe-24 Extracellular Flux Analyzers (Agilent) following the manufacturer's instructions. OCR was measured in XF media containing 11 mmol/L glucose and 1 mmol/L sodium pyruvate under basal conditions and in response to 1 μmol/L oligomycin, 1 μmol/L carbonyl cyanide p-trifluoromethoxyphenylhydrazone (FCCP), and 0.1 μmol/L rotenone plus 0.1 μmol/L antimycin A.
RT-PCR
Total RNA was isolated using RNAeasy Mini Kit (Qiagen), and cDNA was generated using the iScript cDNA Synthesis Kit (Bio-Rad). All RT-PCR was performed using Taqman primers from Applied Biosystems, and gene expression was normalized to β-actin.
Western blot
Using standard protocols, cell lysates were electrophoresed in TrisGlycine gels, transferred to PVDF membranes, and immunoblotted with antibodies against phospho-STAT3 (Tyr705; Cell Signaling), STAT3 (84; BD Biosciences), phospho-STAT5 (Tyr694; Cell Signaling), STAT5 (Cell Signaling), arginase I (19; BD Biosciences), inducible nitric oxide synthase (iNOS; 54; BD Biosciences), and β-actin (AC-74; Sigma).
Cytokine assessment
Cytokines were assessed with the Millipore Milliplex (EMD Millipore), per the manufacturer's instructions.
Lipidomics
For lipidomic analysis, supernatants from EL-4 malignant ascites or normal peritoneal fluid were harvested, and fatty acids and triacylglycerols were extracted and quantitatively analyzed via LC-MS at the Lipidomics Core Facility of Wayne State University School of Medicine.56,57
Human tumor tissues and in vitro generated MDSC
Archival biopsy samples from patients with colon mucinous adenocarcinoma and renal clear cell carcinoma were de-identified and obtained from the LCRC tissue biorepository core. Immunostaining of samples from 3 patients was conducted as described previously.21 Antibodies to CD36 (ab78054; Abcam), Msr1 (ab123946), and CD66b (LS-B7134; Lifespan Biosciences) were used. Human MDSC were generated in vitro from peripheral blood stem cells (PBSC) harvested from G-CSF-treated donors consented under approved IRB protocols. PBSC were cultured in TCM with 20 ng/mL human GM-CSF and IL-6 (R&D Systems) for 7 d in the absence or presence of 50 μg/mL VLDL. To assess their regulatory function, PBSC-derived MDSC were cocultured with autologous CFSE-labeled CD3+ T cells at a ratio of 1 T cell to 1 MDSC in the presence of plate-bound anti-CD3 (OKT3; eBioscence; 1 μg/mL)/anti-CD28 (L293; BD Biosciences; 0.5 μg/mL). T cell proliferation was examined via CFSE dilution after 3 d.
Data analysis
Unless otherwise indicated, all experiments were repeated at least 3 times. Data (n = 3–6) were analyzed by one-way ANOVA followed by Tukey's multiple comparison test or Student's t test using GraphPad Prism software. OCR data were expressed as mean ± SD, while other results were shown as mean ± SEM. P values are presented in figures as *, P < 0.05; **, P < 0.01; ***, P < 0.001; or ****, P < 0.0001.
Supplementary Material
Disclosure of potential conflicts of interest
No potential conflicts of interest were disclosed.
Funding
This work was funded in part by R01AI112402, R01CA082689, and R01CA107974 to ACO; P30GM114732 to AAA (Program Director, ACO); and from LA CaTS Center (U54GM104940) to AAA and ACO
References
- 1.Bronte V, Brandau S, Chen SH, Colombo MP, Frey AB, Greten TF, Mandruzzato S, Murray PJ, Ochoa A, Ostrand-Rosenberg S, et al.. Recommendations for myeloid-derived suppressor cell nomenclature and characterization standards. Nat Commun 2016; 7:12150; PMID:27381735; https://doi.org/ 10.1038/ncomms12150 [DOI] [PMC free article] [PubMed] [Google Scholar]
- 2.Macatangay BJ, Landay AL, Rinaldo CR. MDSC: A new player in HIV immunopathogenesis. AIDS 2012; 26:1567-9; PMID:22810370; https://doi.org/ 10.1097/QAD.0b013e328355e682 [DOI] [PMC free article] [PubMed] [Google Scholar]
- 3.Makarenkova VP, Bansal V, Matta BM, Perez LA, Ochoa JB. CD11b+/Gr-1+ myeloid suppressor cells cause T cell dysfunction after traumatic stress. J Immunol 2006; 176:2085-94; PMID:16455964; https://doi.org/ 10.4049/jimmunol.176.4.2085 [DOI] [PubMed] [Google Scholar]
- 4.Marvel D, Gabrilovich DI. Myeloid-derived suppressor cells in the tumor microenvironment: Expect the unexpected. J Clin Invest 2015; 125:3356-64; PMID:26168215; https://doi.org/ 10.1172/JCI80005 [DOI] [PMC free article] [PubMed] [Google Scholar]
- 5.Parker KH, Beury DW, Ostrand-Rosenberg S. Myeloid-derived suppressor cells: Critical cells driving immune suppression in the tumor microenvironment. Adv Cancer Res 2015; 128:95-139; PMID:26216631; https://doi.org/ 10.1016/bs.acr.2015.04.002 [DOI] [PMC free article] [PubMed] [Google Scholar]
- 6.Ugel S, De SF, Mandruzzato S, Bronte V. Tumor-induced myeloid deviation: When myeloid-derived suppressor cells meet tumor-associated macrophages. J Clin Invest 2015; 125:3365-76; PMID:26325033; https://doi.org/ 10.1172/JCI80006 [DOI] [PMC free article] [PubMed] [Google Scholar]
- 7.De SF, Bronte V, Ugel S. Tumor-induced myeloid-derived suppressor cells. Microbiol Spectr 2016; 4; PMID:27337449; https://doi.org/ 10.1128/microbiolspec.MCHD-0016-2015 [DOI] [PubMed] [Google Scholar]
- 8.Condamine T, Ramachandran I, Youn JI, Gabrilovich DI. Regulation of tumor metastasis by myeloid-derived suppressor cells. Annu Rev Med 2015; 66:97-110; PMID:25341012; https://doi.org/ 10.1146/annurev-med-051013-052304 [DOI] [PMC free article] [PubMed] [Google Scholar]
- 9.Ko JS, Zea AH, Rini BI, Ireland JL, Elson P, Cohen P, Golshayan A, Rayman PA, Wood L, Garcia J, et al.. Sunitinib mediates reversal of myeloid-derived suppressor cell accumulation in renal cell carcinoma patients. Clin Cancer Res 2009; 15:2148-57; PMID:19276286; https://doi.org/ 10.1158/1078-0432.CCR-08-1332 [DOI] [PubMed] [Google Scholar]
- 10.Wesolowski R, Markowitz J, Carson WE III. Myeloid derived suppressor cells - a new therapeutic target in the treatment of cancer. J Immunother Cancer 2013; 1:10; PMID:24829747; https://doi.org/ 10.1186/2051-1426-1-10 [DOI] [PMC free article] [PubMed] [Google Scholar]
- 11.Odegaard JI, Chawla A. Alternative macrophage activation and metabolism. Annu Rev Pathol 2011; 6:275-97; PMID:21034223; https://doi.org/ 10.1146/annurev-pathol-011110-130138 [DOI] [PMC free article] [PubMed] [Google Scholar]
- 12.Vats D, Mukundan L, Odegaard JI, Zhang L, Smith KL, Morel CR, Wagner RA, Greaves DR, Murray PJ, Chawla A. Oxidative metabolism and PGC-1beta attenuate macrophage-mediated inflammation. Cell Metab 2006; 4:13-24; PMID:16814729; https://doi.org/ 10.1016/j.cmet.2006.05.011 [DOI] [PMC free article] [PubMed] [Google Scholar]
- 13.Huang SC, Everts B, Ivanova Y, O'Sullivan D, Nascimento M, Smith AM, Beatty W, Love-Gregory L, Lam WY, O'Neill CM, et al.. Cell-intrinsic lysosomal lipolysis is essential for alternative activation of macrophages. Nat Immunol 2014; 15:846-55; PMID:25086775; https://doi.org/ 10.1038/ni.2956 [DOI] [PMC free article] [PubMed] [Google Scholar]
- 14.Cubillos-Ruiz JR, Silberman PC, Rutkowski MR, Chopra S, Perales-Puchalt A, Song M, Zhang S, Bettigole SE, Gupta D, Holcomb K, et al.. ER stress sensor XBP1 controls anti-tumor immunity by disrupting dendritic cell homeostasis. Cell 2015; 161:1527-38; PMID:26073941; https://doi.org/ 10.1016/j.cell.2015.05.025 [DOI] [PMC free article] [PubMed] [Google Scholar]
- 15.Herber DL, Cao W, Nefedova Y, Novitskiy SV, Nagaraj S, Tyurin VA, Corzo A, Cho HI, Celis E, Lennox B, et al.. Lipid accumulation and dendritic cell dysfunction in cancer. Nat Med 2010; 16:880-6; PMID:20622859; https://doi.org/ 10.1038/nm.2172 [DOI] [PMC free article] [PubMed] [Google Scholar]
- 16.Ramakrishnan R, Tyurin VA, Veglia F, Condamine T, Amoscato A, Mohammadyani D, Johnson JJ, Zhang LM, Klein-Seetharaman J, Celis E, et al.. Oxidized lipids block antigen cross-presentation by dendritic cells in cancer. J Immunol 2014; 192:2920-31; PMID:24554775; https://doi.org/ 10.4049/jimmunol.1302801 [DOI] [PMC free article] [PubMed] [Google Scholar]
- 17.Condamine T, Dominguez GA, Youn JI, Kossenkov AV, Mony S, Alicea-Torres K, Tcyganov E, Hashimoto A, Nefedova Y, Lin C, et al.. Lectin-type oxidized LDL receptor-1 distinguishes population of human polymorphonuclear myeloid-derived suppressor cells in cancer patients. Sci Immunol 2016; 1; PMID:28417112; https://doi.org/ 10.1126/sciimmunol.aaf8943 [DOI] [PMC free article] [PubMed] [Google Scholar]
- 18.Al-Khami AA, Rodriguez PC, Ochoa AC. Energy metabolic pathways control the fate and function of myeloid immune cells. J Leukoc Biol 2017; PMID:28515225; https://doi.org/ 10.1189/jlb.1VMR1216-535R [DOI] [PMC free article] [PubMed] [Google Scholar]
- 19.Buck MD, Sowell RT, Kaech SM, Pearce EL. Metabolic instruction of immunity. Cell 2017; 169:570-86; PMID:28475890; https://doi.org/ 10.1016/j.cell.2017.04.004 [DOI] [PMC free article] [PubMed] [Google Scholar]
- 20.Al-Khami AA, Rodriguez PC, Ochoa AC. Metabolic reprogramming of myeloid-derived suppressor cells (MDSC) in cancer. OncoImmunology 2016; 5:e1200771; PMID:27622069; https://doi.org/ 10.1080/2162402X.2016.1200771 [DOI] [PMC free article] [PubMed] [Google Scholar]
- 21.Hossain F, Al-Khami AA, Wyczechowska D, Hernandez C, Zheng L, Reiss K, Valle LD, Trillo-Tinoco J, Maj T, Zou W, et al.. Inhibition of fatty acid oxidation modulates immunosuppressive functions of myeloid-derived suppressor cells and enhances cancer therapies. Cancer Immunol Res 2015; 3:1236-47; PMID:26025381; https://doi.org/ 10.1158/2326-6066.CIR-15-0036 [DOI] [PMC free article] [PubMed] [Google Scholar]
- 22.Haverkamp JM, Smith AM, Weinlich R, Dillon CP, Qualls JE, Neale G, Koss B, Kim Y, Bronte V, Herold MJ, et al.. Myeloid-derived suppressor activity is mediated by monocytic lineages maintained by continuous inhibition of extrinsic and intrinsic death pathways. Immunity 2014; 41:947-59; PMID:25500368; https://doi.org/ 10.1016/j.immuni.2014.10.020 [DOI] [PMC free article] [PubMed] [Google Scholar]
- 23.Marigo I, Bosio E, Solito S, Mesa C, Fernandez A, Dolcetti L, Ugel S, Sonda N, Bicciato S, Falisi E, et al.. Tumor-induced tolerance and immune suppression depend on the C/EBPbeta transcription factor. Immunity 2010; 32:790-802; PMID:20605485; https://doi.org/ 10.1016/j.immuni.2010.05.010 [DOI] [PubMed] [Google Scholar]
- 24.Lee J, Walsh MC, Hoehn KL, James DE, Wherry EJ, Choi Y. Regulator of fatty acid metabolism, acetyl coenzyme a carboxylase 1, controls T cell immunity. J Immunol 2014; 192:3190-9; PMID:24567531; https://doi.org/ 10.4049/jimmunol.1302985 [DOI] [PMC free article] [PubMed] [Google Scholar]
- 25.Yan D, Yang Q, Shi M, Zhong L, Wu C, Meng T, Yin H, Zhou J. Polyunsaturated fatty acids promote the expansion of myeloid-derived suppressorcells by activating the JAK/STAT3 pathway. Eur J Immunol 2013; 43:2943-55; PMID:23897117; https://doi.org/ 10.1002/eji.201343472 [DOI] [PubMed] [Google Scholar]
- 26.Rodriguez PC, Ochoa AC. Arginine regulation by myeloid derived suppressor cells and tolerance in cancer: Mechanisms and therapeutic perspectives. Immunol Rev 2008; 222:180-91; PMID:18364002; https://doi.org/ 10.1111/j.1600-065X.2008.00608.x [DOI] [PMC free article] [PubMed] [Google Scholar]
- 27.Raber PL, Thevenot P, Sierra R, Wyczechowska D, Halle D, Ramirez ME, Ochoa AC, Fletcher M, Velasco C, Wilk A, et al.. Subpopulations of myeloid-derived suppressor cells impair T cell responses through independent nitric oxide-related pathways. Int J Cancer 2014; 134:2853-64; PMID:24259296; https://doi.org/ 10.1002/ijc.28622 [DOI] [PMC free article] [PubMed] [Google Scholar]
- 28.Poschke I, Kiessling R. On the armament and appearances of human myeloid-derived suppressor cells. Clin Immunol 2012; 144:250-68; PMID:22858650; https://doi.org/ 10.1016/j.clim.2012.06.003 [DOI] [PubMed] [Google Scholar]
- 29.Freigang S, Ampenberger F, Weiss A, Kanneganti TD, Iwakura Y, Hersberger M, Kopf M. Fatty acid-induced mitochondrial uncoupling elicits inflammasome-independent IL-1alpha and sterile vascular inflammation in atherosclerosis. Nat Immunol 2013; 14:1045-53; PMID:23995233; https://doi.org/ 10.1038/ni.2704 [DOI] [PubMed] [Google Scholar]
- 30.Michalek RD, Gerriets VA, Jacobs SR, Macintyre AN, MacIver NJ, Mason EF, Sullivan SA, Nichols AG, Rathmell JC. Cutting edge: Distinct glycolytic and lipid oxidative metabolic programs are essential for effector and regulatory CD4+ T cell subsets. J Immunol 2011; 186:3299-303; PMID:21317389; https://doi.org/ 10.4049/jimmunol.1003613 [DOI] [PMC free article] [PubMed] [Google Scholar]
- 31.Robblee MM, Kim CC, Porter AJ, Valdearcos M, Sandlund KL, Shenoy MK, Volmer R, Iwawaki T, Koliwad SK. Saturated fatty acids engage an IRE1alpha-dependent pathway to activate the NLRP3 inflammasome in myeloid cells. Cell Rep 2016; 14:2611-23; PMID:26971994; https://doi.org/ 10.1016/j.celrep.2016.02.053 [DOI] [PMC free article] [PubMed] [Google Scholar]
- 32.Hale JS, Otvos B, Sinyuk M, Alvarado AG, Hitomi M, Stoltz K, Wu Q, Flavahan W, Levison B, Johansen ML, et al.. Cancer stem cell-specific scavenger receptor CD36 drives glioblastoma progression. Stem Cells 2014; 32:1746-58; PMID:24737733; https://doi.org/ 10.1002/stem.1716 [DOI] [PMC free article] [PubMed] [Google Scholar]
- 33.Laisupasin P, Thompat W, Sukarayodhin S, Sornprom A, Sudjaroen Y. Comparison of serum lipid profiles between normal controls and breast cancer patients. J Lab Physicians 2013; 5:38-41; PMID:24014967; https://doi.org/ 10.4103/0974-2727.115934 [DOI] [PMC free article] [PubMed] [Google Scholar]
- 34.Delimaris I, Faviou E, Antonakos G, Stathopoulou E, Zachari A, Dionyssiou-Asteriou A. Oxidized LDL, serum oxidizability and serum lipid levels in patients with breast or ovarian cancer. Clin Biochem 2007; 40:1129-34; PMID:17673194; https://doi.org/ 10.1016/j.clinbiochem.2007.06.007 [DOI] [PubMed] [Google Scholar]
- 35.Fiorenza AM, Branchi A, Sommariva D. Serum lipoprotein profile in patients with cancer. A comparison with non-cancer subjects. Int J Clin Lab Res 2000; 30:141-5; PMID:11196072; https://doi.org/ 10.1007/s005990070013 [DOI] [PubMed] [Google Scholar]
- 36.Incio J, Liu H, Suboj P, Chin SM, Chen IX, Pinter M, Ng MR, Nia HT, Grahovac J, Kao S, et al.. Obesity-induced inflammation and desmoplasia promote pancreatic cancer progression and resistance to chemotherapy. Cancer Discov 2016; 6:852-69; PMID:27246539; https://doi.org/ 10.1158/2159-8290.CD-15-1177 [DOI] [PMC free article] [PubMed] [Google Scholar]
- 37.Worm SW, Kamara DA, Reiss P, Kirk O, El-Sadr W, Fux C, Fontas E, Phillips A, D'Arminio Monforte A, De Wit S, et al.. Elevated triglycerides and risk of myocardial infarction in HIV-positive persons. AIDS 2011; 25:1497-504; PMID:21633288; https://doi.org/ 10.1097/QAD.0b013e32834917c6 [DOI] [PubMed] [Google Scholar]
- 38.Balaban S, Shearer RF, Lee LS, van Geldermalsen M, Schreuder M, Shtein HC, Cairns R, Thomas KC, Fazakerley DJ, Grewal T, et al.. Adipocyte lipolysis links obesity to breast cancer growth: Adipocyte-derived fatty acids drive breast cancer cell proliferation and migration. Cancer Metab 2017; 5:1; PMID:28101337; https://doi.org/ 10.1186/s40170-016-0163-7 [DOI] [PMC free article] [PubMed] [Google Scholar]
- 39.Nieman KM, Kenny HA, Penicka CV, Ladanyi A, Buell-Gutbrod R, Zillhardt MR, Romero IL, Carey MS, Mills GB, Hotamisligil GS, et al.. Adipocytes promote ovarian cancer metastasis and provide energy forrapid tumor growth. Nat Med 2011; 17:1498-503; PMID:22037646; https://doi.org/ 10.1038/nm.2492 [DOI] [PMC free article] [PubMed] [Google Scholar]
- 40.Pascual G, Avgustinova A, Mejetta S, Martín M, Castellanos A, Attolini CS, Berenguer A, Prats N, Toll A, Hueto JA, et al.. Targeting metastasis-initiating cells through the fatty acid receptor CD36. Nature 2017; 541:41-5; PMID:27974793; https://doi.org/ 10.1038/nature20791 [DOI] [PubMed] [Google Scholar]
- 41.Zechner R, Zimmermann R, Eichmann TO, Kohlwein SD, Haemmerle G, Lass A, Madeo F. FAT SIGNALS–lipases and lipolysis in lipid metabolism and signaling. Cell Metab 2012; 15:279-91; PMID:22405066; https://doi.org/ 10.1016/j.cmet.2011.12.018 [DOI] [PMC free article] [PubMed] [Google Scholar]
- 42.O'Sullivan D, van der Windt GJ, Huang SC, Curtis JD, Chang CH, Buck MD, Qiu J, Smith AM, Lam WY, DiPlato LM, et al.. Memory CD8(+) T cells use cell-intrinsic lipolysis to support the metabolic programming necessary for development. Immunity 2014; 41:75-88; PMID:25001241; https://doi.org/ 10.1016/j.immuni.2014.06.005 [DOI] [PMC free article] [PubMed] [Google Scholar]
- 43.Varga T, Czimmerer Z, Nagy L. PPARs are a unique set of fatty acid regulated transcription factors controlling both lipid metabolism and inflammation. Biochim Biophys Acta 2011; 1812:1007-22; PMID:21382489; https://doi.org/ 10.1016/j.bbadis.2011.02.014 [DOI] [PMC free article] [PubMed] [Google Scholar]
- 44.Chawla A. Control of macrophage activation and function by PPARs. Circ Res 2010; 106:1559-69; PMID:20508200; https://doi.org/ 10.1161/CIRCRESAHA.110.216523 [DOI] [PMC free article] [PubMed] [Google Scholar]
- 45.Gabrilovich DI, Ostrand-Rosenberg S, Bronte V. Coordinated regulation of myeloid cells by tumours. Nat Rev Immunol 2012; 12:253-68; PMID:22437938; https://doi.org/ 10.1038/nri3175 [DOI] [PMC free article] [PubMed] [Google Scholar]
- 46.Gabrilovich DI, Nagaraj S. Myeloid-derived suppressor cells as regulators of the immune system. Nat Rev Immunol 2009; 9:162-74; PMID:19197294; https://doi.org/ 10.1038/nri2506 [DOI] [PMC free article] [PubMed] [Google Scholar]
- 47.Gupta R, Emens LA. GM-CSF-secreting vaccines for solid tumors: Moving forward. Discov Med 2010; 10:52-60; PMID:20670599 [PMC free article] [PubMed] [Google Scholar]
- 48.Bayne LJ, Beatty GL, Jhala N, Clark CE, Rhim AD, Stanger BZ, Vonderheide RH. Tumor-derived granulocyte-macrophage colony-stimulating factor regulates myeloid inflammation and T cell immunity in pancreatic cancer. Cancer Cell 2012; 21:822-35; PMID:22698406; https://doi.org/ 10.1016/j.ccr.2012.04.025 [DOI] [PMC free article] [PubMed] [Google Scholar]
- 49.Bronte V, Chappell DB, Apolloni E, Cabrelle A, Wang M, Hwu P, Restifo NP. Unopposed production of granulocyte-macrophage colony-stimulating factor by tumors inhibits CD8+ T cell responses by dysregulating antigen-presenting cell maturation. J Immunol 1999; 162:5728-37; PMID:10229805 [PMC free article] [PubMed] [Google Scholar]
- 50.Morales JK, Kmieciak M, Knutson KL, Bear HD, Manjili MH. GM-CSF is one of the main breast tumor-derived soluble factors involved in the differentiation of CD11b-Gr1- bone marrow progenitor cells into myeloid-derived suppressor cells. Breast Cancer Res Treat 2010; 123:39-49; PMID:19898981; https://doi.org/ 10.1007/s10549-009-0622-8 [DOI] [PMC free article] [PubMed] [Google Scholar]
- 51.Cheng P, Corzo CA, Luetteke N, Yu B, Nagaraj S, Bui MM, Ortiz M, Nacken W, Sorg C, Vogl T, et al.. Inhibition of dendritic cell differentiation and accumulation of myeloid-derived suppressor cells in cancer is regulated by S100A9 protein. J Exp Med 2008; 205:2235-49; PMID:18809714; https://doi.org/ 10.1084/jem.20080132 [DOI] [PMC free article] [PubMed] [Google Scholar]
- 52.Thorn M, Guha P, Cunetta M, Espat NJ, Miller G, Junghans RP, Katz SC. Tumor-associated GM-CSF overexpression induces immunoinhibitory molecules via STAT3 in myeloid-suppressor cells infiltrating liver metastases. Cancer Gene Ther 2016; 23:188-98; PMID:27199222; https://doi.org/ 10.1038/cgt.2016.19 [DOI] [PubMed] [Google Scholar]
- 53.Waight JD, Netherby C, Hensen ML, Miller A, Hu Q, Liu S, Bogner PN, Farren MR, Lee KP, Liu K, et al.. Myeloid-derived suppressor cell development is regulated by a STAT/IRF-8 axis. J Clin Invest 2013; 123:4464-78; PMID:24091328; https://doi.org/ 10.1172/JCI68189 [DOI] [PMC free article] [PubMed] [Google Scholar]
- 54.Rodriguez PC, Ernstoff MS, Hernandez C, Atkins M, Zabaleta J, Sierra R, Ochoa AC. Arginase I-producing myeloid-derived suppressor cells in renal cell carcinoma are a subpopulation of activated granulocytes. Cancer Res 2009; 69:1553-60; PMID:19201693; https://doi.org/ 10.1158/0008-5472.CAN-08-1921 [DOI] [PMC free article] [PubMed] [Google Scholar]
- 55.Thevenot PT, Sierra RA, Raber PL, Al-Khami AA, Trillo-Tinoco J, Zarreii P, Ochoa AC, Cui Y, Del Valle L, Rodriguez PC. The stress-response sensor chop regulates the function and accumulation of myeloid-derived suppressor cells in tumors. Immunity 2014; 41:389-401; PMID:25238096; https://doi.org/ 10.1016/j.immuni.2014.08.015 [DOI] [PMC free article] [PubMed] [Google Scholar]
- 56.Maddipati KR, Zhou SL. Stability and analysis of eicosanoids and docosanoids in tissue culture media. Prostaglandins Other Lipid Mediat 2011; 94:59-72; PMID:21236355; https://doi.org/ 10.1016/j.prostaglandins.2011.01.003 [DOI] [PubMed] [Google Scholar]
- 57.Maddipati KR, Romero R, Chaiworapongsa T, Zhou SL, Xu Z, Tarca AL, Kusanovic JP, Munoz H, Honn KV. Eicosanomic profiling reveals dominance of the epoxygenase pathway in human amniotic fluid at term in spontaneous labor. FASEB J 2014; 28:4835-46; PMID:25059230; https://doi.org/ 10.1096/fj.14-254383 [DOI] [PMC free article] [PubMed] [Google Scholar]
Associated Data
This section collects any data citations, data availability statements, or supplementary materials included in this article.