
Figure 4.
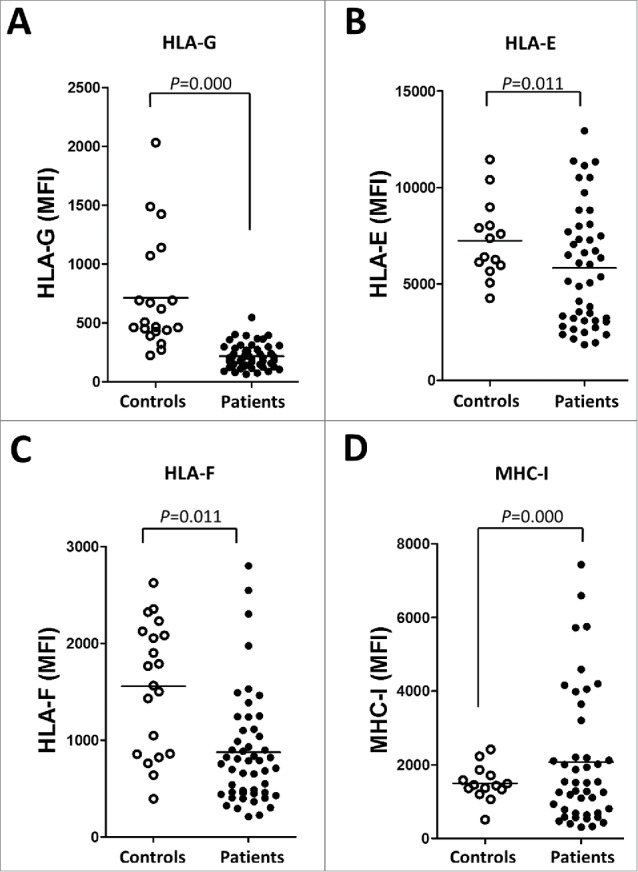
The expression of ILT2 ligands is dysregulated in leukemic cells from CLL patients. The figure shows the comparison of the MFI of HLA-G (A), HLA-E (B), HLA-F (C) and MHC class I (MHC-I) (D) expression between B cells from patients and controls analyzed by flow cytometry.