Abstract
Background and Objective:
Amarogentin has been reported to have a preventive effect on liver cancer via inducing cancer cell apoptosis. We attempted to elucidate the roles of p53-associated apoptosis pathways in the chemopreventive mechanism of amarogentin. The findings of this study will facilitate the development of a novel supplementary strategy for the treatment of liver cancer.
Materials and Methods:
The purity of amarogentin was assessed by high-performance liquid chromatography. The inhibitory ratios of the liver cell lines were determined using a Cell Counting Kit-8 following treatment with a gradient concentration of amarogentin. Cell apoptosis was detected by flow cytometry using annexin V-fluorescein isothiocyanate/propidium iodide kits. The gene and protein expression of p53-associated molecules, such as Akt, human telomerase reverse transcriptase, RelA, and p38, was detected by real-time quantitative polymerase chain reaction, Western blotting, and immunohistochemical staining in liver cancer cells and mouse tumor tissues after treatment with amarogentin.
Results:
The inhibitory effect of amarogentin on cell proliferation was more obvious in liver cancer cells, and amarogentin was more likely to induce the apoptosis of liver cancer cells than that of normal liver cells. The gene and protein expression levels of Akt, RelA, and human telomerase reverse transcriptase were markedly higher in the control group than in the preventive group and treatment groups. Only the expression of human telomerase reverse transcriptase was downregulated, accompanied by the upregulation of p53.
Conclusion:
The results of our study suggest that amarogentin promotes apoptosis of liver cancer cells by the upregulation of p53 and downregulation of human telomerase reverse transcriptase and prevents the malignant transformation of these cells.
Keywords: amarogentin, hepatocellular carcinoma, p53, human telomerase reverse transcriptase
Introduction
Hepatocellular carcinoma (HCC) is one of the most common and highly malignant digestive system cancers.1 Although treatment by liver resection and transplantation has partly increased the survival rate of HCC, necessary long-term adjuvant chemotherapy limits the success of HCC treatment in most patients because of low tolerance to the various side effects.2,3 Thus, Chinese traditional herbal medicines, which have been used for a long time to treat malignant diseases, may be more beneficial for the treatment of HCC. Swertia davidi Franch belongs to the genus Swertia (Gentianaceae), and its active ingredients are used for the treatment of conditions such as viral hepatitis and jaundice.4,5 Amarogentin, one of the most effective compounds extracted from Swertia davidi Franch, was first reported to have an anticarcinogenic effect on cutaneous carcinoma via the induction of apoptosis in cancer cells.6,7 Other excellent studies have revealed that amarogentin prevents liver carcinogenesis by inducing the apoptosis of cancer cells and regulating the renewal of liver cancer stem cells.8,9 However, the pathways in the mitochondria and endoplasmic reticulum that play crucial roles in inducing the apoptosis of amarogentin-treated liver cancer cells are poorly understood.
The mitochondrial apoptotic, endoplasmic reticulum apoptotic, and death receptor signaling pathways participate in cell apoptosis.10–12 p53, a tumor suppressor protein, is a crucial transcription factor involved in the induction of cell apoptosis.13 Cancer cells are under the control of active p53, which increases DNA repair to senescence and induces apoptosis.13 However, p53 is also regulated by other important intracellular signaling molecules, such as protein kinase B (PKB or Akt) RelA, human telomerase reverse transcriptase (hTERT), and p38, which function in response to various chemotherapeutic agents and stress.14 Thus, a better understanding of the chemopreventive mechanism of amarogentin may be achieved by investigating the p53-associated apoptosis pathways.
In our study, we evaluated the anticarcinogenic efficacy of purified amarogentin by examining its effects on the apoptosis of liver cell lines. In addition, the effects of amarogentin on p53-associated apoptosis proteins in liver cancer cells and on subcutaneous tumors in model mice were also investigated. The results of our study have revealed that liver cancer cells are indeed inhibited by amarogentin, which affects the activities of p53-associated apoptosis pathways.
Materials and Methods
Extraction and Purification of Amarogentin
Amarogentin was extracted from Swertia davidi Franch, which was authenticated by the Chongqing Three Gorges Institute of Chinese Material Medical according to the Chinese Pharmacopoeia (2010). The isolation methods used were based on Medda’s report with slight modifications.8 Briefly, coarse powder of Swertia davidi Franch (30.0 g) was dissolved in 60% ethyl alcohol (240.0 g) and washed 3 times for 30 minutes each in a numerical control ultrasonic cleaner (KQ-250DA; Kunshan Ultrasonic Instruments Co, Ltd, China). After each wash, the solution was filtered, and the residue was dissolved in 8 volumes of 60% ethyl alcohol. Amarogentin was successively extracted from the total collected filtrate with petroleum ether, ethyl acetate, and butyl alcohol. Following extraction with butyl alcohol, the solution was dried with a rotary evaporator (SY2000; Shanghai Yarong Biochemistry Instrument Factory, China). The purification of amarogentin was completed by PUSH Bio-Technology Co, Ltd (Chengdu, China), and its purity was evaluated by high-performance liquid chromatography (HPLC, LC210A; Shimadzu, Japan) in comparison with HPLC-grade amarogentin (A9543; AppliChem, Germany). The amarogentin power was dissolved in PEG400 (39719; Sigma, the USA)/phosphate-buffered saline (PBS; 40/60).
Cell Culture
LO2, HepG2, and SMMC-7721 cell lines were obtained from Chongqing Key Laboratory of Hepatobiliary Surgery. The LO2 line is a normal liver cell line regularly used for the simulation of the features of normal liver cells in vitro. In contrast, the HepG2 and SMMC-7721 cell lines are human liver cancer cell lines used to study apoptosis and the oncogenic factors for HCC in vitro. Cells were cultured in DMEM high-sugar medium (SH30243.01B; Hycloen, the USA), containing 10% fetal bovine serum (FBS, SV30087.01; Hyclone, the USA) and were cultivated in a 37°C incubator at a 5% CO2 and a suitable humidity level.
Proliferation Assay
Each 5 × 10³ aliquot of LO2, HepG-2, and SMMC-7721 cells that had been previously cultured for 12 hours was separately treated with a gradient concentration of amarogentin (5, 25, 50, 75, 100, and 125 µg/mL/d). The inhibition ratios of the cell lines were determined using a Cell Counting Kit-8 (CCK8; C0038; Dojindo, Japan) following treatment for 24, 48, and 72 hours, according to the manufacturer’s instructions. Briefly, a CCK8 solution (10 µL) and medium (90 µL) were added to each well of a 96-well plate, which was then incubated for 2 hours at 37°C in the dark before detection of an enzymatic analysis microplate reader (ELx800; BioTek Instruments, the USA) at 450 nm. The experiments were repeated 6 times to achieve biological significance.
Cell Apoptosis Experiments
The LO2, HepG2, and SMMC-7721 cell lines were separately treated with amarogentin for 24, 48, and 72 hours. The liver cells were then resuspended and washed with PBS twice before being assayed with a cell apoptosis detection kit (KGA-107; Keygene, China). Specifically, 106 cells were incubated with 500 µL of binding buffer. Then, 5 µL of an annexin V–fluorescein isothiocyanate solution and 5 µL of a propidium iodide solution were added, followed by incubation for 5 minutes in the dark at room temperature. Finally, the cells were analyzed by flow cytometry.
Cell Migration Experiments
Each 105 aliquot of HepG2 and SMMC-7721 cells was plated in 6 well plates and cultured for 12 hours before treatment with amarogentin for 72 hours. Next, 5 straight lines were scratched into each culture plate, and suspended cells were discarded. The cancer cell cultures continued to be maintained in DMEM medium with 2% FBS for 48 hours. Cancer cell migration was observed by optical microscopy every 24 hours. The relative distance of cancer cell migration was normalized against the control group after observation at 12, 24, and 48 hours.
Cell Invasion Experiments
Each 105 aliquot of HepG2 and SMMC-7721 cells was transferred to the upper compartment of a Matrigel-coated chambers (356237; BD, the USA), containing FBS-free DMEM following treatment with amarogentin for 24, 48, and 72 hours. The lower chamber contained medium with 20% FBS. Cells that remained in the upper compartment were removed after incubation for 24 hours. Cells that migrated to the lower chamber were fixed with 4% paraformaldehyde and then stained with hematoxylin. The number of fixed cells was averaged from 5 fields. The experiments were repeated 3 times to achieve biological significance.
Experimental Animals
Male athymic BALB/c nu/nu mice (5-week-old, 15-20 g, specific pathogen free) were obtained from the Animal Centre of Chongqing Three Gorges Medical College. All protocols involving mice were approved by the ethics committee of Chongqing Three Gorges Medical College, and all animals were properly handled according to the National Institutes of Health Guidelines.
Treatment of the Tumor Models
The toxicity of amarogentin has been previously evaluated in a hamster model using a much higher dose than that used in this study.15 Additionally, a dose of 0.2 µg/g has been reported to elicit a good response in HCC mice.8,9 Thus, a 0.2 µg/g/d dose was selected for the animal experiments. A 5 × 10⁶ (0.2 mL) aliquot of HepG2 cells was injected subcutaneously into the left flank of each mouse. Next, the injected mice were randomly divided into the following groups, with each group containing 10 mice: the control group (C), in which the mice received no treatment; the preventive group (P), in which the mice were treated orally with amarogentin (0.2 µg/g/d) as soon as they received the injection; and the treatment group (T), in which the mice were orally administered amarogentin (0.2 µg/g/d) after the formation of subcutaneously transplanted tumors (2 weeks) of 0.5 to 0.8 cm in size. All of the experimental mice were killed at the 30th day after the T group mice received the oral treatment, and the tumors were removed for analyses by quantitative real-time polymerase chain reaction (qRT-PCR), Western blotting (WB), and immunohistochemical (IHC) staining. In addition, the liver, renal, cardiac muscle and pulmonary tissues were collected for histological examinations to determine the toxicity of amarogentin in vivo.
Quantitative Polymerase Chain Reaction Analysis
Total RNA was extracted from HepG2 and SMMC-7721 cells (106) that has been previously treated with amarogentin as well as tumor tissues, using ultrapure RNA kits (CW0597; Cwbiotech, China). The following primers were used for qRT-PCR analysis: p53 forward primer 5′-TCAACAAGATGTTTTGCCAACTG-3′, and reverse primer 5′-ATGTGCTGTGACTGCTTGTAGATG-3′; hTERT forward primer 5’-AAGGTGAAGGGGCAGGACGGC-3′, and reverse primer 5′-GAGTGGATTCGCGGGCACAGA-3′; p38 forward primer 5’-GCGCTACACCAACCTCTCGT-3′, and reverse primer 5′-CACGGTGCAGAACGTTAGCTG-3′; RelA forward primer 5′-CTGCCGGGATGGCTTCTAT-3′, and reverse primer 5′-CCGCTTCTTCACACACTGGAT-3′; Akt forward primer 5′-CTTTCCAGACCCACGACC-3′, and reverse primer 5′-CTCCGAGTGCAGGTAGTCC-3′; glyceraldehyde-3-phosphate dehydrogenase forward primer 5′-TGCACCACCAACTGCTTAGC-3′, and reverse primer 5′-GGCATGGACTGTGGTCATGAG-3′. The total RNA samples were reverse transcribed into cDNA using a Primescript RT Reagent Kit with gDNA Eraser (RR047A; Takara Biotechnology, Japan), strictly according to the manufacturer’s protocol. Specifically, 1 µg of each total RNA sample was mixed with 5× gDNA Eraser Buffer (2 µL), gDNA Eraser (1 µL), and RNase-free water at a final reaction volume of 10 µL and incubated at 42°C for 2 minutes. Next, the resulting product (10 µL) was mixed with Primescript RT Enzyme Mix I (1 µL), RT Primer Mix (1 µL), 5× Primescript Buffer (4 µL), and RNase-free water (4 µL) and incubated at 37°C for 15 minutes, followed by incubation at 85°C for 5 seconds and storage at 4°C. Polymerase chain reaction was conducted using an SYBR Premix Ex Taq II Kit (RR820A; Takara Biotechnology) as follows. First, 25 µL of the total reaction system was added to 2× SYBR Premix Ex Taq II (12.5 µL), 10 µmol/L forward primer (1 µL), 10 µmol/L reverse primer (1 µL), cDNA (2 µL), and RNase-free water (8.5 µL), and then the mixture was denatured at 95°C for 30 seconds. Next, the mixture was subjected to 40 cycles of amplification at 95°C for 5 seconds and annealing at 60°C for 60 seconds. The relative expression levels of the target genes were determined using the 2(−ΔΔCt) method after normalizing against the GADPH gene.
Western Blotting Analysis
Total protein was extracted from HepG2 and SMMC-7721 cells (106) that has been previously treated with amarogentin as well as tumor tissues, using RIPA buffer (AR0105; Boster, China) containing phenylmethanesulfonyl fluoride (100 mmol/L) and sodium fluoride (100 mmol/L). The protein concentrations were determined using a BCA protein quantitative kit (AR0146; Boster, China). Protein samples of the same volume and quality were electrophoresed in 10% sodium dodecyl sulfate-polyacrylamide gels and transblotted onto polyvinylidene fluoride membranes at 4°C overnight. Then, the membranes were blocked with 5% bovine serum albumin (BSA) for 1 hour and subsequently incubated with specific primary antibodies (1:1000; anti-p38 [#8690; CST, the USA], anti-Akt [#4685; CST, the USA], anti-RelA [#8242; CST, the USA], anti-p53 [#2527; CST, the USA], anti-hTERT [sc-7215; Santa Cruz Biotechnology, the USA], and anti-β-actin (BM0005; Boster, China]) at 37°C for 2 hours, followed by exposure to a horseradish peroxidase–conjugated anti-IgG secondary antibodies (1:5000) at 37°C for 2 hours. Finally, the membranes, which had been previously reacted with an enhanced chemiluminescence buffer (KGP1122; KEYGEN, China), were visualized using a Chemico-EQ system (Bio-Rad, the USA). The gray values of the target protein bands were calculated using Image Lab software. The relative expression levels of the target proteins were normalized against that of β-actin protein.
Immunohistochemical Analysis
Tumor tissues were fixed using 40 g/L paraformaldehyde at 37°C for 30 minutes before being embedded in paraffin. The paraffin samples were cut into 3- to 5-mm sections, followed by dewaxing and hydration. After denaturation of endogenous peroxidase using 30 mL/L hydrogen peroxide, the sections were blocked in 5% BSA at 37°C for 2 hours. Then, the sections were incubated with specific primary antibodies (1:400; anti-p38, anti-Akt, anti-RelA, anti-p53, and anti-hTERT) at 4°C overnight. Next, they were exposed to a horseradish peroxidase-labeled secondary antibody, followed by incubation with 5-bromo-4-chloro-3-indolyl phosphate and nitroblue tetrazolium at a 1:1 ratio (AR1023; Boster, China) at 37°C for 20 minutes at dark place.
Statistical Analysis
All data were expressed as the mean (standard deviation) (x ± s) and were analyzed using SPSS18.0 software (Chicago, Illinois). The cell proliferation data were analyzed by unitary linear recursive analysis. Comparisons of multiple groups were performed by a single factor analysis of variance, and pairs of independent samples were analyzed using Student t test. Differences were considered significant at a P value of less than .05.
Results
Amarogentin Purity
The proportion of amarogentin in the extract prepared from Swertia davidi Franch was 18.40% ± 0.92%. The HPLC analysis revealed that the purity of amarogentin after industrialized purification was over 99.3%. The results of HPLC analysis are presented in Figure 1. The method used for amarogentin extraction in our study yielded a low level of impurities and efficient and stable repeatability.
Figure 1.
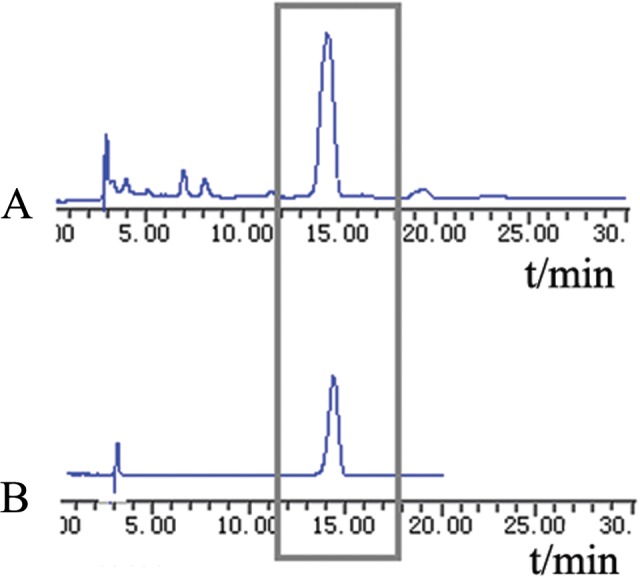
The purity of amarogentin was detected by high-performance liquid chromatography (HPLC). The peak of amarogentin emerged at 13 to 15 minutes. A, The proportion of amarogentin in an extraction prepared from Swertia davidi Franch, as determined by HPLC. B, The purity of amarogentin after purification, as determined by HPLC.
Effects of Amarogentin on Liver Cell Proliferation
The survival rates of the LO2, HepG2, and SMMC-7721 cell lines were dependent on the concentration and treatment time of amarogentin. Additionally, the survival rate showed a strongly linear relationship with the treatment concentration at each time point (Figure 2, Table 1). The half-maximal inhibitory concentration (IC50) values of amarogentin for the LO2 cells at 24, 48, and 72 hours were 173.93, 141, and 115.5 µg/mL, respectively; those for the HepG2 cells were 132.90, 110.30, and 78.61 µg/mL, respectively; and those for the SMMC-7721 cells were 181.15, 123.78, and 86.67 µg/mL, respectively. The inhibitory effects of amarogentin were more obvious in cancer cells than in normal liver cells. To kill a large amount of cancer cells with minimal damage to normal liver cells, we chose 90 µg/mL/d amarogentin for 72 hours as the optimal cancer cell treatment condition in the subsequent experiments considering the lethal effect of amarogentin on LO2 cells.
Figure 2.
Effects of amarogentin on liver cell proliferation. The inhibitory effect of amarogentin was more obvious in cancer cells than in normal cells. A, The linear relationships of the LO2 cell concentration with the survival rate at 24, 48, and 72 hours were y24h = 0.987 − 0.0028x (95% confidence interval [CI]: 0.969-1.006), y48h = 0.923 − 0.003x (95% CI: 0.903-0.943), and y72h = 0.916 − 0.0036x (95% CI: 0.871-0.962). The half-maximal inhibitory concentration (IC50) values of amarogentin for the LO2 cells at 24, 48, and 72 hours were 173.93, 141, and 115.5 µg/mL, respectively. B, The linear relationships of the HepG2 cell concentration with the survival rate at 24, 48, and 72 hours were y24h = 0.912 − 0.0031x (95% CI: 0.894-0.931), y48h = 0.864 − 0.0033x (95% CI: 0.836-0.893), and y72h = 0.783 − 0.0036x (95% CI: 0.739-0.827). The IC50 values for the HepG2 cells at 24, 48, and 72 hours were 132.90, 110.30, and 78.61 µg/mL, respectively. C, The linear relationships of the SMMC-7721 cell concentration with the survival rate at 24, 48, and 72 hours were y24h = 0.971 − 0.0026x (95% CI: 0.946-0.995), y48h = 0.958 − 0.0037x (95% CI: 0.934-0.982), and y72h = 0.883 − 0.0039x (95% CI: 0.780-0.896). The IC50 values for the SMMC-7721 cells at 24, 48, and 72 hours were 181.15, 123.78, and 86.67 µg/mL, respectively.
Table 1.
Effects of Amarogentin on Liver Cell Proliferation.a
| The Effect of Amarogentin on Cell Proliferation | |||||||||
|---|---|---|---|---|---|---|---|---|---|
| Concentration, µg/mL | LO2 | HepG2 | SMMC-7721 | ||||||
| 24 Hours | 48 Hours | 72 Hours | 24 Hours | 48 Hours | 72 Hours | 24 Hours | 48 Hours | 72 Hours | |
| 5 | 97.63% ± 1.20% | 93.80% ± 0.58% | 91.38% ± 0.60% | 90.58% ± 0.37% | 88.75% ± 0.58% | 83.35% ± 1.07% | 93.28% ± 2.24% | 91.50% ± 1.16% | 89.42% ± 0.12% |
| 25 | 90.68% ± 0.72% | 82.91% ± 0.62% | 75.30% ± 2.02% | 85.33% ± 0.32% | 76.91% ± 1.80% | 65.86% ± 4.97% | 91.33% ± 2.22% | 86.98% ± 0.83% | 73.83% ± 0.32% |
| 50 | 83.67% ± 0.40% | 75.89% ± 0.86% | 81.71% ± 1.42% | 74.01% ± 1.30% | 66.55% ± 0.30% | 56.30% ± 1.18% | 85.72% ± 0.43% | 79.47% ± 1.13% | 57.97% ± 2.89% |
| 75 | 81.21% ± 0.67% | 67.57% ± 0.57% | 65.31% ± 0.99% | 65.71% ± 0.57% | 59.58% ± 2.34% | 47.75% ± 2.11% | 80.61% ± 1.42% | 69.98% ± 4.37% | 47.49% ± 0.69% |
| 100 | 71.85% ± 1.65% | 61.58% ± 1.67% | 53.24% ± 1.04% | 60.40% ± 0.97% | 54.58% ± 2.06% | 42.95% ± 0.68% | 71.06% ± 3.08% | 56.23% ± 0.28% | 43.90% ± 1.16% |
| 125 | 62.48% ± 1.45% | 56.26% ± 0.95% | 46.93% ± 0.98% | 55.09% ± 1.66% | 47.34% ± 2.57% | 37.25% ± 0.70% | 63.19% ± 2.38% | 48.44% ± 1.00% | 43.07% ± 0.80% |
| r 2 | .972 | .973 | .902 | .976 | .925 | .909 | .943 | .973 | .868 |
| F value | 582.265 | 610.862 | 158.258 | 685.776 | 340.961 | 170.297 | 282.418 | 616.981 | 112.918 |
| P value | .000 | .000 | .000 | .000 | .000 | .000 | .000 | .000 | .000 |
| a | −0.0028 | −0.003 | −0.0036 | −0.0031 | −0.0033 | −0.0036 | −0.0026 | −0.0037 | −0.0039 |
| b | 0.987 | 0.923 | 0.916 | 0.912 | 0.864 | 0.783 | 0.971 | 0.958 | 0.838 |
| 95% CI | 0.969-1.006 | 0.903-0.943 | 0.871-0.962 | 0.894-0.931 | 0.836-0.893 | 0.739-0.827 | 0.946-0.995 | 0.934-0.982 | 0.780-0.896 |
Abbreviations: CI, confidence interval; IC50, half-maximal inhibitory concentration.
aThe inhibitory effect of amarogentin was more obvious in cancer cells. The IC50 values of amarogentin for the LO2 cells at 24, 48, and 72 hours were 173.93, 141, and 115.5 µg/mL, respectively; those for the HepG2 cells at 24, 48, and 72 hours were 132.90, 110.30, and 78.61 µg/mL, respectively; and those for the SMMC-7721 cells at 24, 48, and 72 hours were 181.15, 123.78, and 86.67 µg/mL, respectively.
Effects of Amarogentin on Liver Cell Apoptosis
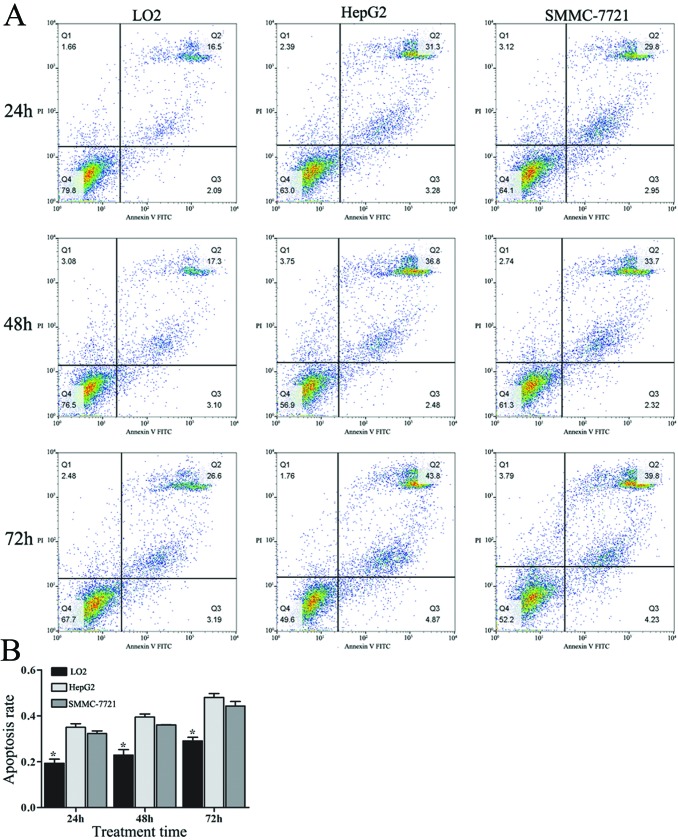
The apoptosis rates of all of the cell lines increased with increasing treatment time. The apoptosis rates of LO2 cells treated with 90 µg/mL/d amarogentin for 24, 48, and 72 hours were much lower than those of HepG2 and SMMC-7721 cells subjected to the same treatment (Figure 3, Table 2). Additionally, nearly 45% of the cancer cells underwent apoptosis after 72 hours of treatment. Thus, we concluded that amarogentin was likely more effective at “killing” cancer cells than normal liver cells.
Figure 3.
Effects of amarogentin on liver cell apoptosis. Amarogentin was likely more effective at “killing” cancer cells than normal liver cells. A, The liver cell apoptosis rates were detected by flow cytometry. B, The apoptosis rates for the LO2 cells at 24, 48, and 72 hours were 19.32% ± 1.76%, 22.89% ± 2.37%, and 29.10% ± 1.54%, respectively; those for the HepG2 cells at 24, 48, and 72 hours were 35.00% ± 1.56%, 39.43% ± 1.35%, and 48.00% ± 1.73%, respectively; those for the SMMC-7721 cells at 24, 48, and 72 hours were 32.25% ± 1.17%, 36.01% ± 0.17%, and 44.21% ± 2.00%, respectively. *The apoptosis rate for LO2 cells at 24, 48, and 72 hours were significantly lower than those for the HepG2 and SMMC-7721 cells (P < .05).
Table 2.
Effects of Amarogentin on Liver Cell Apoptosis.a
| The Apoptosis Rate of Cell Lines | |||
|---|---|---|---|
| 24 Hours | 48 Hours | 72 Hours | |
| LO2 | 19.32% ± 1.76%b | 22.89% ± 2.37%b | 29.10% ± 1.54%b |
| HepG2 | 35.00% ± 1.56% | 39.43% ± 1.35% | 48.00% ± 1.73% |
| SMMC-7721 | 32.25% ± 1.17% | 36.01% ± 0.17% | 44.21% ± 2.00% |
| F value | 91.73 | 92.12 | 95.91 |
| P value | .000 | .000 | .000 |
aAmarogentin was likely more effective at “killing” cancer cells than normal liver cells.
bP < .05, LO2 versus HepG2 and LO2 versus SMMC-7721.
Effects of Amarogentin on Liver Cancer Cell Migration and Invasion
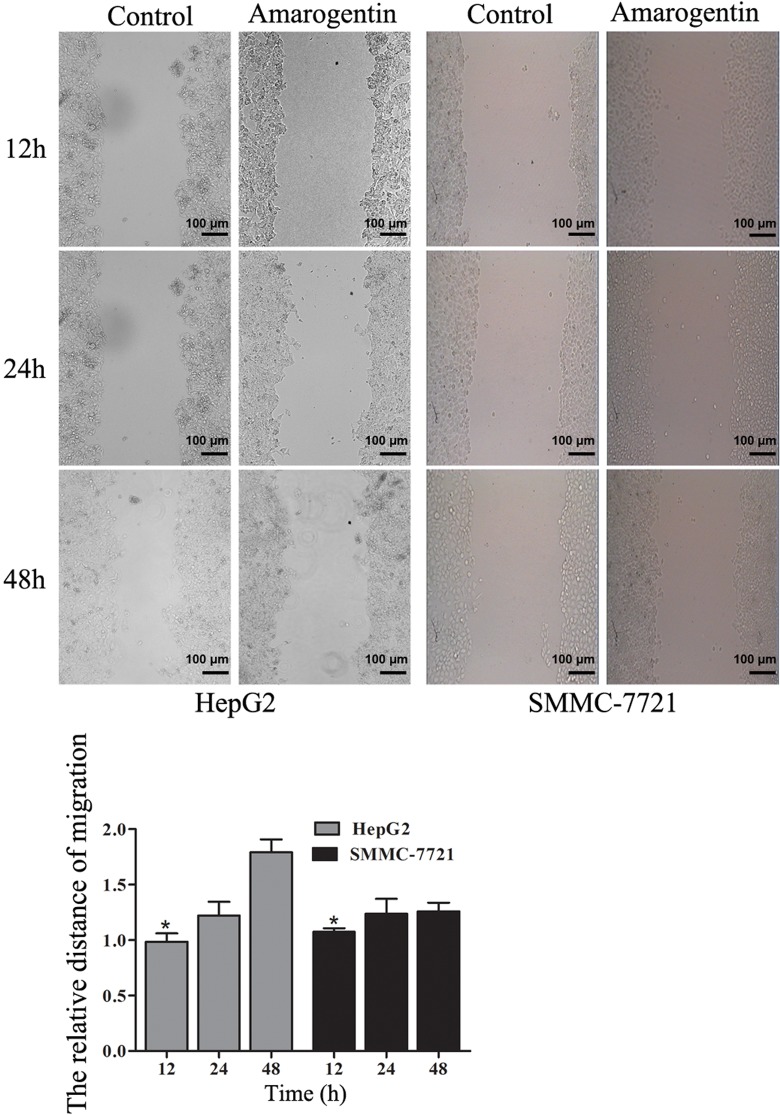
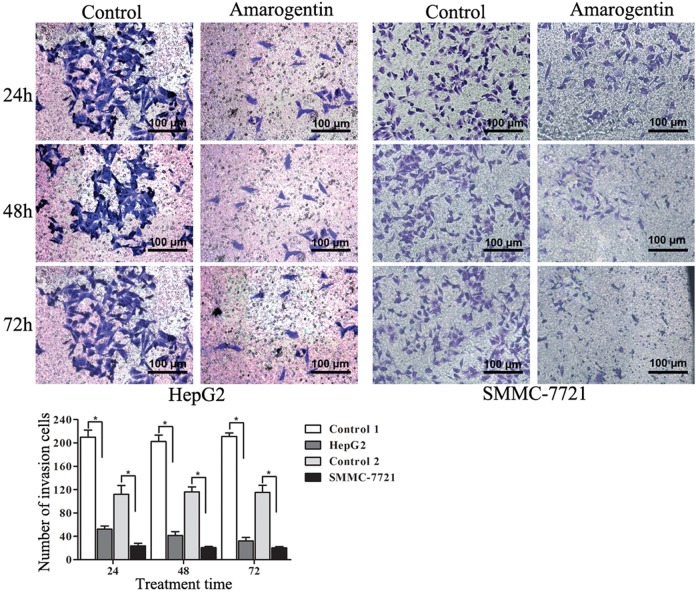
The migration of liver cancer cells was significantly inhibited by amarogentin. More interestingly, with longer amarogentin treatment, more obvious effects of migration on HepG2 were observed (Figure 4). The invasive capacities of both cell lines were dramatically inhibited by amarogentin. Additionally, the inhibitory effect was stronger with increasing treatment time (Figure 5). Thus, amarogentin was able to inhibit the malignant transformation of liver cancer cells.
Figure 4.
Effects of amarogentin on liver cancer cell migration. A, Liver cancer cell migration following treatment with amarogentin compared with that of control cells. B, The migrated distances of the treatment group were significantly shorter than those of the control groups. *P < .05 (magnification 10 × 10).
Figure 5.
Effects of amarogentin on liver cancer cell invasion. A, The invasion of liver cancer cells following treatment with amarogentin compared with that of control cells. B, The numbers of invading cells in the treatment group were significantly less than those of in the control group. *P < .05. (Magnification 10 × 20).
Effects of Amarogentin on p53-Associated Apoptosis Signaling Pathways in Liver Cancer Cells
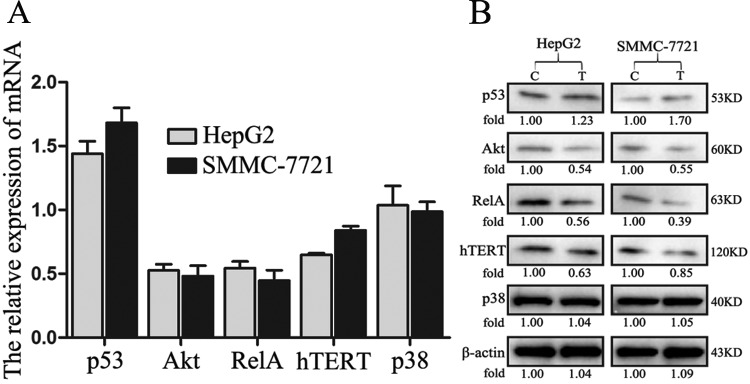
The p53 messenger RNA and protein levels were significantly increased in HepG2 cells after treatment with amarogentin. Akt plays a crucial role in tumor apoptosis signaling pathways. At both the gene and protein levels, Akt expression was downregulated after treatment with amarogentin, and this treatment had a similar effect on the Nuclear transcription factor kappa b (NF-κb) pathway. More interestingly, the gene and protein expression of hTERT, which is an important apoptosis molecule, was also obviously suppressed by amarogentin. However, the mitogen-activated protein kinase pathway showed no relationship with the anticancer effect of amarogentin. Similar results were observed in SMMC-7721 cells (Figure 6). According to the aforementioned results, we assert that the apoptotic effect of amarogentin is closely related to p53-associated apoptosis signaling pathways in vitro.
Figure 6.
Effects of amarogentin on p53-associated apoptosis signaling pathways in liver cancer cells. A, The p53 messenger RNA (mRNA) levels were significantly increased following treatment with amarogentin in both the HepG2 and SMMC-7721 cell lines, whereas Akt, RelA, and hTERT expression was significantly inhibited by amarogentin treatment in both of these cell lines (P < .05). However, the p38 levels were not influenced by amarogentin treatment in either the HepG2 or SMMC-7721 cells (P > .05). B, The Akt, RelA, and hTERT mRNA and protein levels showed similar changes; however, trend was not observed for p38 expression. C indicates control group; T, treatment group.
Effects of Amarogentin on p53-Associated Apoptosis Signaling Pathways in Mouse Models
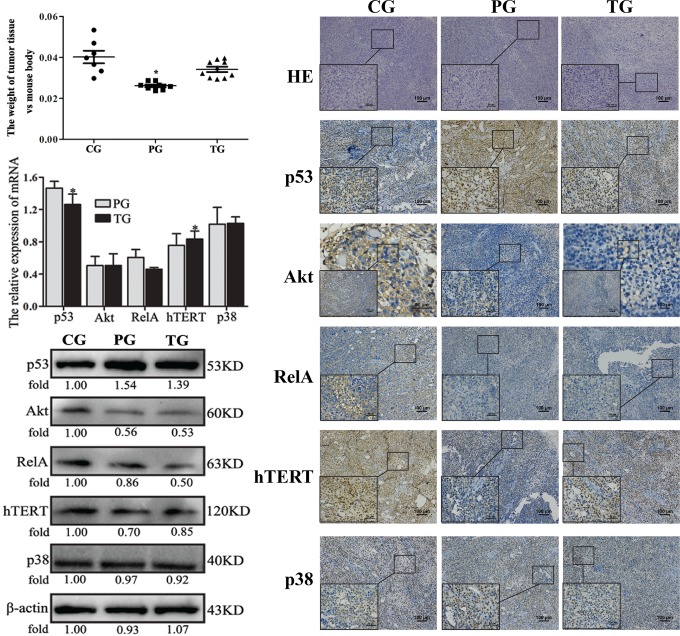
Most of the mouse tumor models used in this study were successfully created in 2 weeks. The numbers of failures in the control, preventive, and treatment groups were 1, 2, and 0, respectively. In the control group, 2 mice died during the experimental time. At the end of 30 days, there were 7, 8, and 10 mice remained in the control, preventive, and treatment groups, respectively. The tumor weights of the control group were significantly larger than those of the preventive group, but they were only slightly larger than those of the treatment group (Figure 7a).
Figure 7.
Effects of amarogentin on p53-associated apoptosis signaling pathways in mouse models. A, The tumor weights of the preventive group were significantly lower than those of the control group but were only slightly lower than those of the treatment group. *P < .05, PG versus CG and PG versus TG. B, The p53 messenger RNA (mRNA) levels were significantly increased in both the preventive and treatment groups, whereas the Akt, RelA, and hTERT expression levels were significantly decreased in both the preventive and treatment groups (P < .05). However, the p38 levels were not influenced by amarogentin treatment in either the preventive or the treatment groups (P > .05). Additionally, only the hTERT expression was downregulated in accordance with the upregulation of p53. *, P < 0.05, PG versus TG. C, The p53, Akt, RelA, and hTERT protein levels changed in accordance with the changes in their mRNA levels, the same trend was not observed for p38 expression. Only hTERT expression was downregulated in accordance with the upregulation of p53. D, The results of hematoxylin-eosin (HE) staining (10×10 and 10×40) and immunohistochemistry (IHC) staining (10×10 and 10×40) were in agreement with the changes in mRNA and protein expression. Only the expression of human telomerase reverse transcriptase (hTERT) was downregulated in accordance with the upregulation of p53. CG indicates control group; PG, preventive group; TG, treatment group.
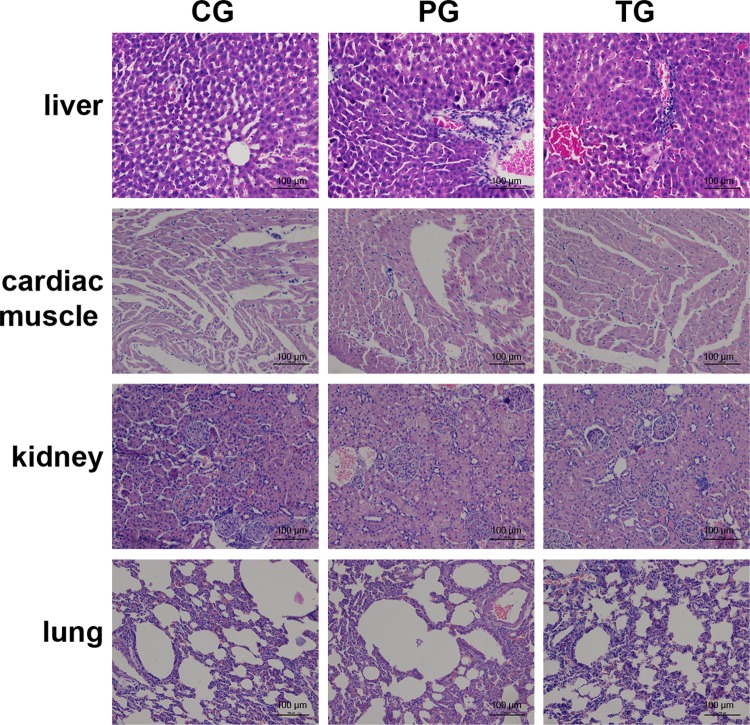
The IHC analysis revealed that p53 protein expression in the tumor tissues was the highest in the preventive group, followed by the treatment and the control groups. Similar p53 expression levels were detected by WB and qRT-PCR analyses. The gene and protein Akt, RelA, and hTERT expression levels in the control group, as determined by IHC, WB, and qRT-PCR, were markedly higher than those in the preventive and treatment groups. The expression of p38 did not differ among the groups with the use of the 3 different analyses. More interestingly, only the expression of hTERT was downregulated, accompanied by the upregulation of p53. Thus, the expression of hTERT in the preventive group was the lowest among all of the groups, followed by the treatment and control groups. Taken together, these results showed that the therapeutic effects of amarogentin were closely related to p53-associated apoptosis in the mouse models. Moreover, the chemopreventive effects of amarogentin relied heavily on the p53-hTERT pathway (Figure 7). Additionally, histological examination of the tissue revealed that amarogentin had no adverse effects on the mice in the preventive and treatment groups compared with those in the control group (Figure 8).
Figure 8.
Histological examination of amarogentin-treated mice. No observed adverse effects of amarogentin were observed in the mice in the preventive or treatment groups compared with those in the control group. A, Liver tissue. B, Cardiac muscle tissue. C, Renal tissue. D, Pulmonary tissue. CG indicates control group; PG, preventive group; TG, treatment group (magnification 10 × 20).
Discussion
In our study, the anticarcinogenic molecular mechanism of amarogentin was assessed in both liver cancer cells and model nude mice with subcutaneously implanted tumors. First, it was evident that the inhibitory effect of amarogentin on cell proliferation was more obvious in liver cancer cells and that amarogentin was more likely to induce the apoptosis of liver cancer cells than that of normal liver cells. Second, migration and invasion of liver cancer cells were significantly inhibited by amarogentin. More importantly, the chemopreventive effects of amarogentin were demonstrated to involve the p53-hTERT pathway, which induced the apoptosis of liver cancer cells.
Apoptosis is a major conserved process for cell removal.16 Most anticancer drugs affect cancer cells by inducing cell apoptosis networks in malignant cells.17 Anticarcinogenic effects of amarogentin, which is extracted from a medicinal plant belonging to the genus Swertia (Gentianaceae), have been reported by Saha and colleagues.6,7 They have asserted that amarogentin inhibits malignant proliferation by downregulating the expression of Cox-II and by triggering apoptosis by activation of caspase-3 in a mouse skin carcinogenesis model. A similar report has demonstrated that amarogentin induces apoptosis of liver cancer cells by upregulating the Bcl2-associated X protein (Bax)/B-cell lymphoma-2 (Bcl2) (Bax/Bcl2) ratio and triggering caspase-3 and poly adenosine diphosphate ribose polymerase cleavage in a mouse liver carcinogenesis model.8 However, this report emphasized the preventive effects of amarogentin, although its therapeutic effects are much less important during carcinogenesis. Another report has recently indicated that amarogentin decreases the number of CD44-positive liver cancer stem cells, inhibits the expression of β-catenin, and secreted frizzled-related proteins 1/2, which are the key regulatory molecules in the Wnt pathway, decreases the expression of glioma-associated oncogene homolog 1, sonic hedgehog ligand and smoothened, and upregulates the expression of Protein patched homolog 1 (PTCH1), which are major regulatory molecules involved in the hedgehog pathway that downregulate the expression of epidermal growth factor receptor both in vivo and in vitro.9 These researchers have suggested that the anticarcinogenic effects of amarogentin mainly depend on regulation of the self-renewal pathway of liver cancer cells. In our study, we have demonstrated that amarogentin is not only more effective at “killing” liver cancer cells than normal liver cells but that it also inhibits the malignant transformation of liver cancer cells in vitro. Additionally, the activity of a key molecule involved in apoptosis-promoting signaling pathways, p53, is significantly enhanced. The activities of other molecules involved in apoptosis-suppressing signaling pathways, including Akt, RelA, and hTERT, are strongly inhibited. Notably, Pal and colleagues have reported that p53 has less obvious preventative effects against liver carcinogenesis than the Bax-Bcl2 signaling pathway.9 However, our results indicate that the p53-hTERT pathway is involved in the primary mechanism by which amarogentin suppresses proliferation and induces apoptosis in liver cancer.
Mice with defective or inactive p53 are more likely to have rapidly developing tumors.18,19 Thus, p53 protects against tumor development via the Akt, NF-κb, and hTERT pathways.20–22 In addition, a few studies have reported that p38 is regulated by p53 to induce cancer cell apoptosis,23,24 and our results have shown that the expression of p38 is not affected by amarogentin in liver cancer cells. In our study, amarogentin also suppressed the expression of Akt, NF-κb, and hTERT. More interestingly, only the expression of hTERT was downregulated, accompanied by the upregulation of p53, in the mouse models. Thus, we have shown that the p53-hTERT pathway is the primary effective route by which amarogentin suppresses the proliferation and induces the apoptosis of liver cancer cells. The hTERT expression has been previously reported to be increased in liver cancer cells compared with normal liver cells.25 Suppression of hTERT is an effective way to promote apoptosis of cancer cells. Thus, amarogentin is more likely to induce the apoptosis of liver cancer cells than that of normal liver cells.
Accumulating evidence has shown that the activity of telomerase is strongly correlated with the aggressiveness and metastatic potentials of various tumors.26–28 The regulation of telomerase activity by hTERT results in inhibition of cancer cells apoptosis. Thus, hTERT is one of the most important targeted molecules of p53. Overexpression of hTERT blocks the activation of p53, and activated p53 inhibits the expression of hTERT; however, activated p53 does not directly regulate hTERT because of the lack of a binding site for p53 in the promoter of the hTERT gene.25,29,30 Several studies have confirmed that c-Myc and/or Sp-1, which are direct downstream targets of hTERT, are required for the activation of hTERT promoter.31–33 Regrettably, our study did not examine additional p53-targeted molecules that may play very significant roles in the anticarcinogenic mechanism of amarogentin liver cancer.
In conclusion, our results suggest that amarogentin promotes the apoptosis of liver cancer cells by upregulation of p53 and downregulation of hTERT as well as by prevention of the malignant transformation of liver cancer cells. However, more research is needed on the directly targeted molecules of amarogentin that may trigger the p53-hTERT pathway, resulting in anticarcinogenic effects on liver cancer cells.
Abbreviations
- BSA
bovine serum albumin
- CCK8
Cell Counting Kit-8
- FBS
fetal bovine serum
- HCC
hepatocellular carcinoma
- HPLC
high-performance liquid chromatography
- hTERT
human telomerase reverse transcriptase
- IC50
half-maximal inhibitory concentration
- IHC
immunohistochemical
- PBS
phosphate-buffered saline
- qRT-PCR
quantitative real-time polymerase chain reaction
- WB
Western blotting.
Footnotes
Declaration of Conflicting Interests: The author(s) declared no potential conflicts of interest with respect to the research, authorship, and/or publication of this article.
Funding: The author(s) disclosed receipt of the following financial support for the research, authorship, and/or publication of this article: This study was supported by the Natural Science Foundation of Chongqing Municipality (No. cstc2012jjA10125).
References
- 1. Torre LA, Bray F, Siegel RL, Ferlay J, Lortet-Tieulent J, Jemal A. Global cancer statistics, 2012. CA Cancer J Clin. 2015;65(2):87–108. doi:10.3322/caac.21262. [DOI] [PubMed] [Google Scholar]
- 2. Morise Z, Kawabe N, Tomishige H, et al. Recent advances in liver resection for hepatocellular carcinoma. Front Surg. 2014;1:21 doi:10.3389/fsurg.2014.00021. [DOI] [PMC free article] [PubMed] [Google Scholar]
- 3. Meacham CE, Morrison SJ. Tumour heterogeneity and cancer cell plasticity. Nature. 2013;501(7467):328–337. doi:10.1038/nature12624. [DOI] [PMC free article] [PubMed] [Google Scholar]
- 4. Tan GS, Xu KP, Li FS, et al. Daviditin B from Swertia davidi Franch. Yao Xue Xue Bao. 2003;38(12):931–933. [PubMed] [Google Scholar]
- 5. Zeng GY, Tan GS, Xu KP, et al. Water-soluble chemical constituents of Swertia davidi Franch. Yao Xue Xue Bao. 2004;39(5):351–353. [PubMed] [Google Scholar]
- 6. Saha P, Mandal S, Das A, Das PC, Das S. Evaluation of the anticarcinogenic activity of Swertia chirata Buch.Ham, an Indian medicinal plant, on DMBA-induced mouse skin carcinogenesis model. Phytother Res. 2004;18(5):373–378. doi:10.1002/ptr.1436. [DOI] [PubMed] [Google Scholar]
- 7. Saha P, Mandal S, Das A, Das S. Amarogentin can reduce hyperproliferation by downregulation of Cox-II and upregulation of apoptosis in mouse skin carcinogenesis model. Cancer Lett. 2006;244(2):252–259. doi:10.1016/j.canlet.2005.12.036. [DOI] [PubMed] [Google Scholar]
- 8. Pal D, Sur S, Mandal S, et al. Prevention of liver carcinogenesis by amarogentin through modulation of G1/S cell cycle check point and induction of apoptosis. Carcinogenesis. 2012;33(12):2424–2431. doi:10.1093/carcin/bgs276. [DOI] [PubMed] [Google Scholar]
- 9. Sur S, Pal D, Banerjee K, et al. Amarogentin regulates self renewal pathways to restrict liver carcinogenesis in experimental mouse model. Mol Carcinog. 2016;55(7):1138–1149. doi:10.1002/mc.22356. [DOI] [PubMed] [Google Scholar]
- 10. Mohammad RM, Muqbil I, Lowe L, et al. Broad targeting of resistance to apoptosis in cancer. Semin Cancer Biol. 2015;35 suppl:S78–S103. doi:10.1016/j.semcancer.2015.03.001. [DOI] [PMC free article] [PubMed] [Google Scholar]
- 11. Lopez J, Tait SW. Mitochondrial apoptosis: killing cancer using the enemy within. Br J Cancer. 2015;112(6):957–962. doi:10.1038/bjc.2015.85. [DOI] [PMC free article] [PubMed] [Google Scholar]
- 12. Fulda S. Targeting extrinsic apoptosis in cancer: challenges and opportunities. Semin Cell Dev Biol. 2015;39:20–25. doi:10.1016/j.semcdb.2015.01.006.25617598 [Google Scholar]
- 13. Zuckerman V, Wolyniec K, Sionov RV, Haupt S, Haupt Y. Tumour suppression by p53: the importance of apoptosis and cellular senescence. J Pathol. 2009;219(1):3–15. doi:10.1002/path.2584. [DOI] [PubMed] [Google Scholar]
- 14. Amaral JD, Castro RE, Steer CJ, Rodrigues CM. P53 and the regulation of hepatocyte apoptosis: implications for disease pathogenesis. Trends Mol Med. 2009;15(11):531–541. doi:10.1016/j.molmed.2009.09.005. [DOI] [PubMed] [Google Scholar]
- 15. Medda S, Mukhopadhyay S, Basu MK. Evaluation of the in-vivo activity and toxicity of amarogentin, an antileishmanial agent, in both liposomal and niosomal forms. J Antimicrob Chemother. 1999;44(6):791–794. [DOI] [PubMed] [Google Scholar]
- 16. Ren SX, Cheng AS, To KF, et al. Host immune defense peptide LL-37 activates caspase-independent apoptosis and suppresses colon cancer. Cancer Res. 2012;72(24):6512–6523. doi:10.1158/0008-5472.CAN-12-2359. [DOI] [PMC free article] [PubMed] [Google Scholar]
- 17. Vijayarathna S, Jothy SL, Chen Y, Kanwar JR, Sasidharan S. Anti-cancer natural products inducing cross-talk between apoptosis and autophagy mutual proteins to regulate cancer cell death: design of future green anticancer therapies. Asian Pac J Cancer Prev. 2015;16(14):6175–6176. [DOI] [PubMed] [Google Scholar]
- 18. Donehower LA, Harvey M, Slagle BL, et al. Mice deficient for p53 are developmentally normal but susceptible to spontaneous tumours. Nature. 1992;356(6366):215–221. doi:10.1038/356215a0. [DOI] [PubMed] [Google Scholar]
- 19. Attardi LD, Jacks T. The role of p53 in tumour suppression: lessons from mouse models. Cell Mol Life Sci. 1999;55(1):48–63. [DOI] [PMC free article] [PubMed] [Google Scholar]
- 20. Tsai JP, Lee CH, Ying TH, et al. Licochalcone A induces autophagy through PI3K/Akt/mTOR inactivation and autophagy suppression enhances Licochalcone A-induced apoptosis of human cervical cancer cells. Oncotarget. 2015;6(30):28851–2866. [DOI] [PMC free article] [PubMed] [Google Scholar]
- 21. Yang L, Zhou Y, Li Y, et al. Mutations of p53 and KRAS activate NF-κB to promote chemoresistance and tumorigenesis via dysregulation of cell cycle and suppression of apoptosis in lung cancer cells. Cancer Lett. 2015;357(2):520–526. doi:10.1016/j.canlet.2014.12.003. [DOI] [PubMed] [Google Scholar]
- 22. Terashima T, Mizukoshi E, Arai K, et al. P53, hTERT, WT-1, and VEGFR2 are the most suitable targets for cancer vaccine therapy in HLA-A24 positive pancreatic adenocarcinoma. Cancer Immunol Immunother. 2014;63(5):479–489. doi:10.1007/s00262-014-1529-8. [DOI] [PMC free article] [PubMed] [Google Scholar]
- 23. Cerezo-Guisado MI, Zur R, Lorenzo MJ, et al. Implication of Akt, ERK1/2 and alternative p38MAPK signalling pathways in human colon cancer cell apoptosis induced by green tea EGCG. Food Chem Toxicol. 2015;84:125–132. doi:10.1016/j.fct.2015.08.017. [DOI] [PubMed] [Google Scholar]
- 24. Coskun D, Obakan P, Arisan ED, Coker-Gurkan A, Palavan-Unsal N. Epibrassinolide alters PI3K/MAPK signaling axis via activating Foxo3a-induced mitochondria-mediated apoptosis in colon cancer cells. Exp Cell Res. 2015;338(1):10–21. doi:10.1016/j.yexcr.2015.08.015. [DOI] [PubMed] [Google Scholar]
- 25. Daniel M, Peek GW, Tollefsbol TO. Regulation of the human catalytic subunit of telomerase (hTERT). Gene. 2012;498(2):135–146. doi:10.1016/j.gene.2012.01.095. [DOI] [PMC free article] [PubMed] [Google Scholar]
- 26. Albanell J, Lonardo F, Rusch V, et al. High telomerase activity in primary lung cancers: association with increased cell proliferation rates and advanced pathologic stage. J Natl Cancer Inst. 1997;89(21):1609–1615. [DOI] [PubMed] [Google Scholar]
- 27. Mocellin S, Pooley KA, Nitti D. Telomerase and the search for the end of cancer. Trends Mol Med. 2013;19(2):125–133. doi:10.1016/j.molmed.2012.11.006. [DOI] [PubMed] [Google Scholar]
- 28. Uen YH, Lin SR, Wu DC, et al. Prognostic significance of multiple molecular markers for patients with stage II colorectal cancer undergoing curative resection. Ann Surg. 2007;246(6):1040–1046. doi:10.1097/SLA.0b013e318142d918. [DOI] [PubMed] [Google Scholar]
- 29. Rahman R, Latonen L, Wiman KG. HTERT antagonizes p53-induced apoptosis independently of telomerase activity. Oncogene. 2005;24(8):1320–1327. doi:10.1038/sj.onc.1208232. [DOI] [PubMed] [Google Scholar]
- 30. Ruden M, Puri N. Novel anticancer therapeutics targeting telomerase. Cancer Treat Rev. 2013;39(5):444–456. doi:10.1016/j.ctrv.2012.06.007. [DOI] [PubMed] [Google Scholar]
- 31. Islam MA, Thomas SD, Murty VV, Sedoris KJ, Miller DM. C-Myc quadruplex-forming sequence Pu-27 induces extensive damage in both telomeric and nontelomeric regions of DNA. J Biol Chem. 2014;289(12):8521–8531. doi:10.1074/jbc.M113.505073. [DOI] [PMC free article] [PubMed] [Google Scholar]
- 32. Zhang D, Sun X, Liu J, et al. Homocysteine accelerates senescence of endothelial cells via DNA hypomethylation of human telomerase reverse transcriptase. Arterioscler Thromb Vasc Biol. 2015;35(1):71–78. doi:10.1161/ATVBAHA.114.303899. [DOI] [PubMed] [Google Scholar]
- 33. Yao Y, Bellon M, Shelton SN, Nicot C. Tumor suppressors p53, p63TAα, p63TAy, p73α, and p73β use distinct pathways to repress telomerase expression. J Biol Chem. 2012;287(24):20737–20747. doi:10.1074/jbc.M111.319236. [DOI] [PMC free article] [PubMed] [Google Scholar]


