

Abstract
Purpose
Myokines have been shown to affect muscle physiology and exert systemic effects. We endeavored to investigate a panel of myokine mRNA expression after a single exercise bout (studies 1 and 2) to measure myokine mRNA in primary human myotubes in an in vitro exercise model (study 2).
Methods
Vastus lateralis muscle biopsies were obtained from 20 healthy males (age, 24.0 ± 4.5 yr; BMI, 23.6 ± 1.8 kgIm−2) before and after a single exercise bout (650 kcal at 50% V̇O2max). Primary myotubes from active and sedentary male donors were treated with a pharmacological cocktail (palmitate, forskolin, and ionomycin (PFI)) to mimic exercise-stimulated contractions in vitro.
Results
Interleukin 6 and 8 (IL-6 and IL-8), leukocyte-inducing factor, and connective tissue growth factor (CTGF) mRNA levels increased approximately 10-fold after a single exercise bout (all P < 0.001), whereas myostatin levels decreased (P < 0.05). Key correlations between myokine expression and parameters of muscle and whole-body physiology were found: myostatin versus skeletal muscle citrate synthase activity (r= −0.69, P < 0.001), V̇O2max (r= −0.64, P= 0.002) and the percentage of Type I fibers (r= −0.55, P= 0.01); IL-6 versus the RER (r= 0.45, P=0.04), homeostatic model assessment of insulin resistance (r= 0.44, P= 0.05), and serum lactate (r= 0.50, P= 0.02). Myokine expressions in myotubes from sedentary donors for CTGF and myostatin decreased, whereas IL-6 and IL-8 increased after PFI treatment. In myotubes from active donors, myokine expression increased for IL-6, CTGF, and myostatin but decreased for IL-8 after PFI treatment.
Conclusion
These data offer insight into the differences in regulation of myokine expression and their possible physiologic relationships.
Keywords: MYOSTATIN, CYTOKINE, INTERLEUKIN, MYOBLAST, ENDURANCE
Skeletal muscle is now recognized as an endocrine organ with proteins that are both expressed by and secreted from skeletal muscle called myokines. Studies using computational analysis have identified hundreds of potentially secreted proteins from human skeletal muscle (5,11) and in myotubes (17). It has been suggested that the contractile activity of muscle affects its secretory function linking physical activity to myokine secretory response. However, much of the physiologic function and how these myokines are secreted from the contractile activity of skeletal muscle remain unknown.
The majority of studies have focused on select myokines, and few studies have examined associations between myokine gene expression and anthropometric, metabolic, or skeletal muscle functional parameters. Myostatin, a member of the transforming growth factor β superfamily, was the first myokine discovered (30) and found to inhibit muscle growth (37, 38). Interleukin 6 (IL-6), a cytokine with known proinflammatory functions (8), is secreted after muscle contraction from skeletal muscle (40). Extensively reviewed by Pedersen and Febbraio (31), muscle IL-6 has been speculated to contribute to the antiinflammatory effects of exercise, regulate glycogen content in skeletal muscle, and contribute to insulin sensitivity through AMP kinase activation. IL-15 and leukocyte-inducing factor (LIF) have been speculated to regulate muscle cell growth and satellite cell proliferation (7,18), with IL-15 playing a potential role in adipose tissue lipolysis (33). IL-8 and connective tissue growth factor (CTGF) have been hypothesized to regulate angiogenesis within the skeletal muscle (3,6,16,22). These aforementioned myokines have not been examined together in one study, and few studies have examined associations between myokine gene expressions and anthropometric, metabolic, or skeletal muscle functional parameters. In this study, we examined myokine gene expressions (myostatin, IL-6, IL-15, LIF, and CTGF) in human skeletal muscle before and after a single bout of exercise. Additionally, we performed in vitro experiments using primary skeletal muscle cultures taken from healthy, lean, and sedentary as well as physically active male volunteers. Myokine expressions were measured before and after treatment with an exercise pharmacological cocktail (palmitate, forskolin, and ionomycin (PFI)) known to stimulate contraction of myotubes (36).
METHODS
Study 1: endurance exercise bout in human participants
Twenty healthy, normoglycemic sedentary male participants (16 Caucasians, 3 African Americans, and 1 nonspecified race), who were not engaged in sports at a competitive level, were recruited to participate in this trial. The institutional review board of Pennington Biomedical Research Center approved all aspects of this study in accordance to the Declaration of Helsinki, and all participants provided written informed consent. Detailed aspects of this exercise trial have been reported (14). Participant characteristics are provided in Table 1. Body composition was assessed by dual x-ray absorptiometry (QDR 4500A; Hologic, Waltham, MA), and V̇O2max was measured on a stationary bicycle ergometer (Lode Excalibur, Groningen, the Netherlands) using an incremental workload protocol with simultaneous gas exchange measurements using a metabolic cart (TrueOne 2400; ParvoMedics, Sandy, UT).
TABLE 1.
Anthropometric and serum characteristics of male participants in endurance exercise study.
| Mean ± SD | |
|---|---|
| Age (yr) | 24.0 ± 4.5 |
| Weight (kg) | 76.7 ± 6.5 |
| Height (cm) | 180.3 T 5.4 |
| BMI (kg·m−2) | 23.6 ± 1.8 |
| Percent body fat | 16.6 ± 3.2 |
| Fat mass (kg) | 12.8 ± 3.1 |
| Fat free mass (kg) | 63.9 ± 4.7 |
| V̇O2max (mL·min−1·kg−1 FFM) | 47.2 ± 5.7 |
| Fasting glucose (mg·dL−1) | 88.0 ± 4.6 |
| Fasting insulin (mU·dL−1) | 3.6 ± 1.6 |
| HOMA-IR | 0.78 ± 0.37 |
| Fasting lactate (mmol·L−1) | 1.01 ± 0.31 |
| Percentage of Type I fibers | 35.9 ± 11.7 |
| Percentage of Type II fibers | 64.2 ± 11.7 |
V̇O2max and dual x-ray absorptiometry measurements were assessed at a period of no greater than 2 d before the exercise intervention to prevent any confounding acute effects of exercise on baseline measurements. The night before the exercise bout, participants were admitted to the institutional in-patient unit. After an overnight fast, resting metabolic rate was measured using a DeltaTrac metabolic cart, and a percutaneous skeletal muscle biopsy of the vastus lateralis muscle was performed. Gas exchange while exercising was assessed from expired air collected by a mouthpiece using the same TrueOne 2400 ParvoMedics metabolic cart. Total energy expenditure and substrate oxidation were calculated as previously described (13). Participants then exercised on a stationary bike at 50% of their V̇O2max until they had expended 650 kcal. Indirect calorimetry measures were performed after the estimated 8%, 20%, 40%, 60%, and 80% and right before exercise completion to gauge when 650 kcal of energy had been expended. Blood was drawn at regular intervals coupled to indirect calorimetry measures before and after the exercise bout with serum glucose, insulin, and lactate by an enzymatic assay on a Beckman Coulter DXC 600 (Beckman Coulter, Brea, CA). All blood parameters were measured in a certified clinical chemistry laboratory, and the manufacturer’s protocols were followed for all the serum measurements (Table 2). Immediately after the exercise bout, a second percutaneous skeletal muscle biopsy was obtained proximal to the first biopsy.
TABLE 2.
Clinical and skeletal muscle parameters before and after the endurance exercise bout.
| Baseline (Mean ± SD) | Postexercise (Mean ± SD) | P | |
|---|---|---|---|
| RER | 0.95 ± 0.04 | 0.89 ± 0.03 | < 0.001 |
| Palmitate oxidation, ex vivo (nmol·h−1·mg−1 protein) | 615.9 ± 375.9 | 887.3 ± 404.3 | 0.01 |
| Pyruvate oxidation, ex vivo (nmol·h−1·mg−1 protein) | 1153.0 ± 767.8 | 1840.0 ± 990.0 | 0.02 |
| IMCL content (AU) | 27.7 ± 27.5 | 21.3 ± 19.4 | 0.21 |
| Glycogen content (AU) | 8.40 ± 0.79 | 7.32 ± 0.68 | 0.001 |
| Serum lactate (mmol·L−1) | 1.01 ± 0.31 | 2.61 ± 0.79 | <0.001 |
Skeletal muscle biopsy procedure
After local anesthesia with 2% lidocaine/0.5% bupivacaine (1/1 ratio), vastus lateralis samples were collected using the Bergstrom technique with suction. Two separate incisions were made to collect tissues at baseline and postexercise. The second biopsy was obtained immediately after the completion of exercise (<3 min). Muscle samples were visually assessed and cleaned of intramuscular adipose tissue. Muscle biopsies were snap frozen in liquid nitrogen for subsequent mRNA and protein analyses, or blotted dry and then mounted in a mixture of optimal cutting temperature compound (Thermo Scientific, Waltham, MA) and tragacanth powder (Acros, Geel, Belgium) for immunohistochemical measures of glycogen, intramyocellular lipid (IMCL), and fiber typing. Another sample was collected for measurements of ex vivo palmitate oxidation.
Immunohistochemical measures
Measures of fiber typing and IMCL were performed as previously described using immunofluorescence techniques (14). Images were taken using a multiphoton confocal microscope (Leica TCS SP5 AOBS; Leica Microsystems, Wetzlar, Germany) and Type I fibers were counted. IMCL was determined using the Sigma Scan Pro 5 software (SPSS, Chicago, IL) by delineating BODIPY staining within the myofibers. Glycogen content was measured using periodic acid–Schiff staining and analyzed using the Sigma Scan Pro 5 software (2). For all histology measures, three cross-sectional slices were obtained within the tissue. Not less than 50 fibers were assessed from each cross-sectional slice for IMCL content, fiber type, and glycogen.
Ex vivo palmitate oxidation and pyruvate oxidation measures in skeletal muscle
A palmitate oxidation assay was performed as previously described (14). Data were adjusted to total protein content obtained from muscle homogenate as determined through the bicinchoninic acid assay (Pierce BCA, Thermo Scientific).
Maximal citrate synthase activity in skeletal muscle
About 80 mg of skeletal muscle was diluted 20-fold in the extraction buffer (0.1 M KH2PO4/Na2PHO4 and 2 mM EDTA (pH 7.2)) and then homogenized (Glas Col, Terre Haute, IN). Activity was measured at 37°C in a 0.1M Tris–HCl (pH 8.3) assay buffer containing 0.12 mM 5,59-dithio-bis-2-nitrobenzoic acid and 0.6 mM oxaloacetate. After an initial 2-min absorbance reading at 412 nm, the reaction was initiated by adding 3 mM acetyl-CoA, and the change in absorbance was measured every 10 s for 7 min. Values were adjusted for total protein.
Study 2: establishment of primary human skeletal muscle cultures
Primary muscle cultures were established from muscle biopsies obtained from the vastus lateralis in five lean, healthy, and sedentary Caucasian male donors (age, 23.0 ± 1.9 yr; BMI, 24.2 ± 0.6 kg·m−2; and percent fat, 8.4% ± 6.4%) from the EAT trial (Clinicaltrials.gov number: NCT01672632) (20) and four active donors (age, 23.0 ± 1.0 yr; BMI, 25.1 ± 2.5 kg·m−2; percent fat, 13.2 ± 2.0; and V̇O2max, 50.1 ± 3.7 mL·min−1·kg−1 fat-free mass (FFM)) from the ACTIV trial (Clinicaltrials.gov number: NCT00401791) (1). Establishment of the human primary muscle culture was performed as previously described (12).
In vitro PFI treatment in primary human myotubes
Myotubes were treated with 30 μM palmitate, 4 μM forskolin, and 0.5 μM ionomycin (PFI)—all purchased from Sigma (St. Louis, MO). We previously showed that PFI treatment in myotubes increased palmitate oxidation, increased mitochondrial oxidative phosphorylation complex expression, and improved insulin-stimulated glucose uptake (36). Briefly, myotubes were maintained in differentiation media for 4 d and then treated with PFI for three additional days (1 h·d−1). Differentiation media were similarly changed each day, without PFI, for control cells. Total protein and mRNA were collected immediately before PFI (0 min) and at 15 min, 30 min, 1 h, 8 h, and 24 h after PFI treatment. Total mRNA was collected using QIAzol (Qiagen, Germantown, MD).
Gene expression measures in skeletal muscle tissue and primary human myotubes
The total mRNA from both in vivo and in vitro experiments was extracted using the miRNEasy Mini Kit (Qiagen); cDNA was made using the High Capacity cDNA Kit (Applied Biosystems, Foster City, CA). Detection of gene expression was performed using TaqMan Gene Expression Assays-on-Demand (Applied Biosystems). The list of assay catalogue numbers are as follows: RPLPO (Hs99999902_m1), IL-6 ( Hs00985639_m1), IL-8 (Hs00174103), IL-15 (Hs01003716_m1), Myostatin (Hs00976237_m1), CTGF (Hs01026927_m1), and LIF (Hs01055668_m1). Real-time PCR was carried out using the 7900HT Fast Real-Time PCR System (Applied Biosystems), and expression levels were determined against a standard curve. Skeletal muscle and myotube gene expression were adjusted to the expression of RPLPO.
Statistical analysis
Data were analyzed using the PRISM GraphPad Software, version 6.0 (GraphPad Software, La Jolla, CA). Data were checked for normality using the Shapiro–Wilk normality test. Normally distributed data were analyzed using paired t-tests, whereas not normally distributed data were analyzed using the Wilcoxon signed-rank paired test. A two-way ANOVA with Tukey post hoc test was used to test for differences in myokine expression in myotubes from lean and sedentary donors versus athlete donors. Correlational analyses were performed using Pearson’s correlations. A P value ≤0.05 was considered statistically significant.
RESULTS
Changes in myokine expression after a single exercise bout
Myostatin gene expression decreased on average 20% after exercise (P < 0.05, Fig. 1A). IL-6, IL-8, LIF, and CTGF gene expressions all increased robustly after exercise (all markers, P < 0.001, Fig. 1B–E). There were no significant changes in IL-15 (Fig. 1F).
FIGURE 1.
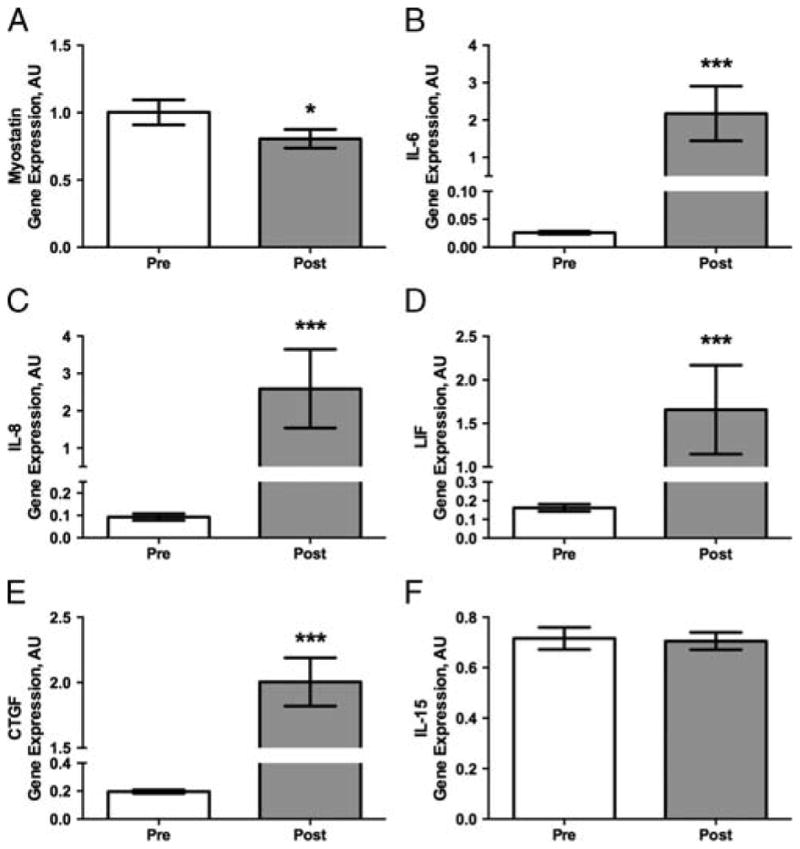
Myokine gene expression in the vastus lateralis before and after the endurance exercise bout. A, Myostatin gene expression decreased on average 20% with endurance exercise. B, IL-6 increased eightfold with endurance exercise. C, IL-8 increased 25-fold with endurance exercise. D, LIF mRNA increased approximately 8.5-fold from preexercise levels. E, CTGF increased 10-fold over preexercise expression levels. F, IL-15 did not significantly change with a single endurance exercise bout. Data represent mean ± SEM. *P < 0.05 and ***P < 0.001.
Correlations between myokine expression and metabolic parameters
Next, we examined correlations between myokine expression and factors related to whole body and skeletal muscle metabolism, physical fitness, and body composition at baseline and after exercise. At baseline, myostatin gene expression was inversely related to citrate synthase activity in the vastus lateralis (r = −0.69, P< 0.001) and V̇O2max (r = −0.64, P = 0.002, Table 3). Additionally, myostatin was positively related to the percent of Type II, fast-twitch fibers and negatively associated to the percentage of Type I, slow-twitch fibers in vastus lateralis (r = 0.55 and r = −0.55, respectively, both P = 0.01, Table 3). Baseline IL-6 expression was positively related to the markers of glucose metabolism including the homeostatic model assessment of insulin resistance (HOMA-IR), homeostatic measure of insulin resistance (r = 0.44, P = 0.05), baseline RER (r = 0.45, P = 0.04), serum lactate levels (r = 0.50, P = 0.02, Table 3), and change in IL-6 inversely associated with the change in glycogen content with exercise (r = −0.57, P = 0.01, Table 3).
TABLE 3.
Correlational matrix between myokine mRNA expression and metabolic/ anthropometric characteristics.
| Pearson r | P | ||||
|---|---|---|---|---|---|
| Myostatin | BL | Citrate synthase activity (nmol·min−1·mg−1 protein) | BL | −0.69 | <0.001 |
| BL | V̇O2max (mL·min−1·kg−1 FFM) | BL | −0.64 | 0.002 | |
| BL | % Type I fibers | BL | −0.55 | 0.01 | |
| BL | % Type II fibers | BL | 0.55 | 0.01 | |
| IL-6 | BL | HOMA-IR | BL | 0.44 | 0.05 |
| BL | RER | BL | 0.45 | 0.04 | |
| BL | Serum lactate (mmol·L−1) | BL | 0.50 | 0.02 | |
| Δ | Glycogen content (AU) | Δ | −0.57 | 0.01 | |
| IL-15 | BL | Fat mass (kg) | BL | 0.43 | 0.05 |
| BL | V̇O2max (mL·min−1·kg−1 FFM) | BL | −0.47 | 0.03 | |
| Δ | Total IMCL (AU) | Δ | −0.61 | 0.007 | |
| CTGF | BL | Serum glucose (mg·dL−1) | BL | 0.52 | 0.02 |
| BL | Pyruvate oxidation, ex vivo (nmol·h−1·mg−1 protein) | Δ | −0.65 | 0.005 | |
| Δ | Percent fat | BL | 0.64 | 0.003 |
Data are represented as either the baseline (BL) mRNA expression or the change (Δ) in mRNA expression in participants who participated in the single endurance exercise bout. These data are correlated with either the baseline (BL) or the change (Δ) in the measure of metabolic/anthropometric characteristics of these participants.
IL-15 mRNA expression at rest was inversely associated with V̇O2max (r = −0.47, P = 0.03) as well as positively associated with fat mass (r = 0.43, P = 0.05), and the change in IL-15 expression with exercise was inversely associated with the change in total IMCL in the vastus lateralis (r = −0.61, P = 0.007, Table 3). CTGF was associated with markers of glucose metabolism with resting levels being associated with serum glucose (r = 0.52, P = 0.02) and with changes in ex vivo pyruvate oxidation measured in the vastus lateralis (r = −0.65, P = 0.005, Table 3). The change in CTGF with exercise was positively associated with percent body fat (r = 0.64, P = 0.003, Table 3).
Primary myotube expression of myokines from athlete and sedentary donor with PFI stimulation
Given that IL-6, IL-8, and CTGF mRNA levels increased and myostatin decreased after a single bout of exercise, we next examined whether contraction in primary skeletal muscle myotubes from active and sedentary lean donors would stimulate similar adaptations in these myokines. Both resting and contraction-stimulated (PFI-treated) mRNA myokine expressions were examined over 24 h after PFI treatment. We found significant time, group, and interaction effects in IL-6, IL-8, CTGF, and myostatin mRNA levels (all P < 0.001, Fig. 2). Compared with unstimulated controls, IL-6, IL-8, and CTGF all increased with PFI stimulation and returned to almost basal expression levels 24 h after PFI treatment. However, myostatin levels significantly rose with PFI in myotubes from active donors and were significantly above myostatin expression in sedentary donors (Fig. 2B). This higher gene expression of myostatin in myotubes from active donors was maintained even 24 h after PFI treatment, whereas PFI treatment seemed to suppress its expression in myotubes from sedentary donors.
FIGURE 2.

Myokine gene expression in human primary myotubes from active and sedentary donors. Myotubes were treated with the pharmacologic cocktail of 30 KM palmitate, 4 KM forskolin, and 0.5 KM ionomycin (PFI) for 1 h a day for 3 d to stimulate muscle contractions. mRNA was collected across a time course after the last day of PFI treatment. A, IL-6 increased significantly in both active and sedentary donors up until 1 h after PFI treatment, with the active donors increasing above basal condition at the 8-h time point and returning to control conditions by the 24-h time point. B, Myostatin gene expression increased significantly in the active donors with PFI treatment and was maintained up to 24 h post-PFI treatment, whereas sedentary donor myotubes decreased myostatin gene expression immediately after and 30 min after PFI treatment, and again 24 h post-PFI treatment. C, Sedentary myotubes increased expression of IL-8 immediately after and 1 h after PFI treatment. Athletes decreased IL-8 expression significantly at 1 and 24 h post-PFI treatment. D, CTGF expression was significantly elevated in active donors immediately after and 15 min after PFI treatment, whereas sedentary myotubes had a decrease in expression from control levels 8 and 24 h after PFI treatment. Data represent mean T SEM of experiments performed in triplicate.
DISCUSSION
Skeletal muscle secreted myokines, whose functional role still remains elusive, provide evidence that skeletal muscle operates as an endocrine organ. Here, we examined the gene expression of seven known myokines in 20 healthy lean males before and after an endurance exercise bout, and identified associations between myokine expression and factors related to whole body physical fitness, skeletal muscle metabolism, and glucose homeostasis. Furthermore, we examined the gene expression of four of those myokines in an in vitro pharmacologic exercise model of contraction induced in primary human myotubes taken from healthy, lean, and sedentary males as well as active males. Similar to previous studies (28,40), our study found 10-fold increases in IL-6 and a significant decrease in myostatin expression. Additionally, IL-8, CTGF, and LIF expressions increased substantially after exercise. Furthermore, we found significant associations between myokine mRNA levels and factors of whole body metabolism and skeletal muscle metabolism, such as RER, V̇O2max, HOMA-IR, substrate oxidation, and citrate synthase activity. Together, these data provide insight into the clinical and anthropometric characteristics related to myokine expression as well as alterations in expression based on the exercise stimulus and physical fitness.
Of the two most extensively studied myokines, IL-6 and myostatin expressions have been shown to respond with exercise (reviewed by Pedersen and Febbraio [31,32]). We found a significant decrease in myostatin and a marked increase in IL-6 expression. The novelty of our study is that we report IL-6 and myostatin expression in human primary myotubes cultured from both physically active and lean sedentary donors. Our data show fundamental differences in post-PFI exercise mimetic cocktail treatment in myotubes from different types of donors, particularly with regard to myostatin. IL-6 gene expression seems to follow a similar pattern in both sedentary and active donors with increasing expression with PFI, peaking between 15 and 30 min after PFI, and subsiding to basal expression levels 1 to 24 h after PFI treatment. However, myostatin gene expression is differentially regulated with PFI treatment, with lean sedentary myotubes having decreasing expression as would be hypothesized, but myotubes from active individuals having markedly increased expression of myostatin that is maintained 24 h post-PFI treatment.
This unexpected finding in myotubes from active donors provides speculative insight into the function of myostatin. Myostatin is involved in regulating the inhibition of skeletal muscle growth (38). Patients with type 2 diabetes (39) and elderly individuals with muscle wasting (41) possess elevated levels of myostatin. However, physical activity can reduce expression of myostatin allowing for muscle growth and bulk (27,28). One potential mechanism that has been proposed is that myostatin operates by inhibiting the differentiation and fusion of skeletal muscle satellite cell progenitors for the formation of new myofibers rather than acting directly on mature, preexisting muscle fibers themselves (15,23,29). It may be that endurance-trained individuals might release excess myostatin to maintain a substantial pool of already matured “trained” muscle fibers and perhaps to maintain relative fiber type composition in a mixed muscle such as the vastus lateralis. In fact, we found an association between higher myostatin levels, a lower percentage of Type I fibers and a higher percentage of Type II fibers in our clinical study (Table 3). Furthermore, on the whole body level, we see an inverse relationship between baseline myostatin gene expression and V̇O2max (Table 3). Of fundamental interest is how basal myostatin gene expression is inversely associated with citrate synthase activity, which serves as a surrogate marker for mitochondrial content. Because Type I, slow-twitch fibers have higher levels of mitochondria and are associated with higher V̇O2max, myostatin could have an effect in determining fiber type composition. Further investigations in the effects of myostatin on fiber type composition are required.
IL-6 is secreted in large amounts from muscle as a fuel sensor of skeletal muscle glycogen content and glucose oxidation (21) and secreted as an endocrine factor from the muscle as glycogen is depleted to enhance gluconeogenesis and lipolysis in the liver and adipose tissue, respectively (reviewed by Pedersen and Febbraio, ref. 31). In fact, IL-6 levels were blunted in participants who underwent endurance exercise with glucose supplementation during exercise (4). Our data seem to partly support the association between IL-6 function and glucose utilization. IL-6 is positively associated with resting RER and with serum lactate levels, suggesting that higher levels of IL-6 are associated with higher levels of carbohydrate oxidation. Likewise, the change in IL-6 with exercise is inversely associated with the change in glycogen in the muscle, implying that IL-6 expression is increased as glycogen levels fall with exercise. Seemingly contrary, but connected with this concept that IL-6 is a fuel sensor (glucose utilization and glucose need) in skeletal muscle, is how IL-6 expression is positively associated with HOMA-IR, a measure of insulin resistance (Table 3). It has also been postulated that IL-6 is involved in the regulation of AMP kinase (10), a fuel-sensitive kinase that is partly responsible for exercise-induced, insulin-independent glucose uptake into skeletal muscle (19,34). Because the proinflammatory functions of IL-6 have been shown to blunt insulin sensitivity (9,35), the myokine function of IL-6 might be to inhibit systemic insulin uptake of glucose from other tissues in favor of exercise-induced, insulin-independent uptake of glucose into the skeletal muscle where it would be most needed during endurance exercise. Additional experiments would be needed to test these hypotheses.
We found increased CTGF with exercise in muscle tissue (Fig. 1E) and after in vitro exercise mimetic stimulation in myotubes with the PFI cocktail (Fig. 2D). Since CTGF is involved in recruiting and differentiating fibroblasts (24) and angiogenesis (6,16), higher levels of CTGF might be involved in the production of fibroblast proliferation to buffer muscle interstitial fluid from higher serum glucose levels and angiogenesis with exercise.
Although we observed large increases in IL-8 and LIF expression (Fig. 1C and D) with exercise and differential IL-8 expression patterns post-PFI treatment in myotubes from sedentary and active donors (Fig. 2C), we did not find any correlations or significant associations of LIF or IL-8 expression with any clinical or molecular parameters. LIF has been shown to contribute to myoblast proliferation and myotube differentiation (7). Studies into the myokine functions of IL-8 have suggested that it might be involved in angiogenesis (3,22). However, due in part to limited biopsy materials, further examination of these effects fell outside of the scope of our investigation. Further studies would be needed to understand the role IL-8 and LIF might play in response to exercise-mediated expression.
One of the major limitations of our study is that our observations are based solely on the mRNA expression of myokines rather than on the serum content of secreted myokines. Malm et al. (26) reported that multiple biopsies could result in increased inflammatory serum markers as well as increased IL-6 protein content detected by immunohistochemistry. However, Lundby et al. (25) showed that alterations of mRNA expression in skeletal muscle are not altered by the effect of multiple biopsies. We opted therefore to base our analysis on mRNA levels from skeletal muscle issue so that we could address whether alterations to myokine mRNA expression were the results of the exercise bout and not due to potential effects of the biopsy procedure. Furthermore, by utilizing mRNA expression from the muscle tissue, we can rule out the possibility that the inflammatory markers are coming from some other distant source—a possibility that we could not rule out if we observe serum concentrations of the myokines.
In conclusion, we investigated the gene expression changes in 20 healthy lean males in response to an acute exercise bout and discovered large increases in IL-6, IL-8, LIF, and CTGF gene expressions with a decrease in myostatin gene expression. Additionally, we found some associations between myokine expression with certain markers of physical fitness, lipid and glycogen muscle metabolism, mitochondrial function, and body composition. We also examined the expression of myokines in myotubes from active and sedentary donors both basally and after pharmacologically induced myotube contraction using the PFI treatment representing an in vitro exercise mimetic. We found differential expression of myokines from active and sedentary myotubes, particularly with myostatin expression. These data offer insights into the potential functions of exercise-induced myokine expression.
Acknowledgments
The authors would like to thank Shantele Thomas, Jamie LaGrange, and Mindy Gaubert for their technical assistance with molecular assays, and the authors wish to thank Richard Carmouche and Susan Newman of the Genomics Core Facility of Pennington Biomedical Research Center. Finally, the authors wish to thank all the research volunteers for their participation in this study.
This investigation was supported in part by a young investigator award from The Obesity Society (J. E. G.), the EAT Study (R01-DK060412, E. R.), the ACTIV Study (R01AG030226-01A2, S. R. S.), the Nutrition Obesity Research Center (P30 DK072476, E. R.), and unrestricted research grants from Novartis, Novartis Clinical Innovation Fund and Takeda Pharmaceuticals North America (S. R. S.). R. C. N. and the Genomics Core Facility are supported in part by COBRE (P20-GM103528-07). C. S. T. is supported by a National Health and Medical Research Centre Early Career Fellowship from Australia (#1037275).
Footnotes
The authors have nothing to disclose. The results of the present study do not constitute endorsement by the American College of Sports Medicine.
References
- 1.Bajpeyi S, Pasarica M, Moro C, et al. Skeletal muscle mitochondrial capacity and insulin resistance in type 2 diabetes. J Clin Endocrinol Metab. 2011;96(4):1160–8. doi: 10.1210/jc.2010-1621. [DOI] [PMC free article] [PubMed] [Google Scholar]
- 2.Bajpeyi S, Tanner CJ, Slentz CA, et al. Effect of exercise intensity and volume on persistence of insulin sensitivity during training cessation. J Appl Physiol (1985) 2009;106(4):1079–85. doi: 10.1152/japplphysiol.91262.2008. [DOI] [PMC free article] [PubMed] [Google Scholar]
- 3.Bek EL, McMillen MA, Scott P, Angus LD, Shaftan GW. The effect of diabetes on endothelin, interleukin-8 and vascular endothelial growth factor-mediated angiogenesis in rats. Clin Sci (Lond) 2002;103(48 Suppl):424S–9. doi: 10.1042/CS103S424S. [DOI] [PubMed] [Google Scholar]
- 4.Bishop NC, Gleeson M, Nicholas CW, Ali A. Influence of carbohydrate supplementation on plasma cytokine and neutrophil degranulation responses to high intensity intermittent exercise. Int J Sport Nutr Exerc Metab. 2002;12(2):145–56. doi: 10.1123/ijsnem.12.2.145. [DOI] [PubMed] [Google Scholar]
- 5.Bortoluzzi S, Scannapieco P, Cestaro A, Danieli GA, Schiaffino S. Computational reconstruction of the human skeletal muscle secretome. Proteins. 2006;62(3):776–92. doi: 10.1002/prot.20803. [DOI] [PubMed] [Google Scholar]
- 6.Brigstock DR. Regulation of angiogenesis and endothelial cell function by connective tissue growth factor (CTGF) and cysteine-rich 61 (CYR61) Angiogenesis. 2002;5(3):153–65. doi: 10.1023/a:1023823803510. [DOI] [PubMed] [Google Scholar]
- 7.Broholm C, Laye MJ, Brandt C, et al. LIF is a contraction-induced myokine stimulating human myocyte proliferation. J Appl Physiol (1985) 2011;111(1):251–9. doi: 10.1152/japplphysiol.01399.2010. [DOI] [PubMed] [Google Scholar]
- 8.Bruunsgaard H, Galbo H, Halkjaer-Kristensen J, Johansen TL, MacLean DA, Pedersen BK. Exercise-induced increase in serum interleukin-6 in humans is related to muscle damage. J Physiol. 1997;499(Pt 3):833–41. doi: 10.1113/jphysiol.1997.sp021972. [DOI] [PMC free article] [PubMed] [Google Scholar]
- 9.Carey AL, Lamont B, Andrikopoulos S, Koukoulas I, Proietto J, Febbraio MA. Interleukin-6 gene expression is increased in insulin-resistant rat skeletal muscle following insulin stimulation. Biochem Biophys Res Commun. 2003;302(4):837–40. doi: 10.1016/s0006-291x(03)00267-5. [DOI] [PubMed] [Google Scholar]
- 10.Carey AL, Steinberg GR, Macaulay SL, et al. Interleukin-6 increases insulin-stimulated glucose disposal in humans and glucose uptake and fatty acid oxidation in vitro via AMP-activated protein kinase. Diabetes. 2006;55(10):2688–97. doi: 10.2337/db05-1404. [DOI] [PubMed] [Google Scholar]
- 11.Catoire M, Mensink M, Kalkhoven E, Schrauwen P, Kersten S. Identification of human exercise-induced myokines using secretome analysis. Physiol Genomics. 2014;46(7):256–67. doi: 10.1152/physiolgenomics.00174.2013. [DOI] [PubMed] [Google Scholar]
- 12.Covington JD, Galgani JE, Moro C, et al. Skeletal muscle perilipin 3 and coatomer proteins are increased following exercise and are associated with fat oxidation. PLoS One. 2014;9(3):e91675. doi: 10.1371/journal.pone.0091675. [DOI] [PMC free article] [PubMed] [Google Scholar]
- 13.Frayn KN. Calculation of substrate oxidation rates in vivo from gaseous exchange. J Appl Physiol Respir Environ Exerc Physiol. 1983;55(2):628–34. doi: 10.1152/jappl.1983.55.2.628. [DOI] [PubMed] [Google Scholar]
- 14.Galgani JE, Johannsen NM, Bajpeyi S, et al. Role of skeletal muscle mitochondrial density on exercise-stimulated lipid oxidation. Obesity (Silver Spring) 2012;20(7):1387–93. doi: 10.1038/oby.2011.166. [DOI] [PMC free article] [PubMed] [Google Scholar]
- 15.Gao F, Kishida T, Ejima A, Gojo S, Mazda O. Myostatin acts as an autocrine/paracrine negative regulator in myoblast differentiation from human induced pluripotent stem cells. Biochem Biophys Res Commun. 2013;431(2):309–14. doi: 10.1016/j.bbrc.2012.12.105. [DOI] [PubMed] [Google Scholar]
- 16.Hall-Glenn F, De Young RA, Huang BL, et al. CCN2/connective tissue growth factor is essential for pericyte adhesion and endothelial basement membrane formation during angiogenesis. PLoS One. 2012;7(2):e30562. doi: 10.1371/journal.pone.0030562. [DOI] [PMC free article] [PubMed] [Google Scholar]
- 17.Hartwig S, Raschke S, Knebel B, et al. Secretome profiling of primary human skeletal muscle cells. Biochim Biophys Acta. 2014;1844(5):1011–7. doi: 10.1016/j.bbapap.2013.08.004. [DOI] [PubMed] [Google Scholar]
- 18.Haugen F, Norheim F, Lian H, et al. IL-7 is expressed and secreted by human skeletal muscle cells. Am J Physiol Cell Physiol. 2010;298(4):C807–16. doi: 10.1152/ajpcell.00094.2009. [DOI] [PubMed] [Google Scholar]
- 19.Hayashi T, Hirshman MF, Kurth EJ, Winder WW, Goodyear LJ. Evidence for 5′ AMP-activated protein kinase mediation of the effect of muscle contraction on glucose transport. Diabetes. 1998;47(8):1369–73. doi: 10.2337/diab.47.8.1369. [DOI] [PubMed] [Google Scholar]
- 20.Johannsen DL, Tchoukalova Y, Tam CS, et al. Effect of 8 weeks of overfeeding on ectopic fat deposition and insulin sensitivity: testing the “adipose tissue expandability” hypothesis. Diabetes Care. 2014;37(10):2789–97. doi: 10.2337/dc14-0761. [DOI] [PMC free article] [PubMed] [Google Scholar]
- 21.Keller C, Steensberg A, Pilegaard H, et al. Transcriptional activation of the IL-6 gene in human contracting skeletal muscle: influence of muscle glycogen content. FASEB J. 2001;15(14):2748–50. doi: 10.1096/fj.01-0507fje. [DOI] [PubMed] [Google Scholar]
- 22.Koch AE, Polverini PJ, Kunkel SL, et al. Interleukin-8 as a macrophage-derived mediator of angiogenesis. Science. 1992;258(5089):1798–801. doi: 10.1126/science.1281554. [DOI] [PubMed] [Google Scholar]
- 23.Langley B, Thomas M, Bishop A, Sharma M, Gilmour S, Kambadur R. Myostatin inhibits myoblast differentiation by down-regulating MyoD expression. J Biol Chem. 2002;277(51):49831–40. doi: 10.1074/jbc.M204291200. [DOI] [PubMed] [Google Scholar]
- 24.Lee CH, Shah B, Moioli EK, Mao JJ. CTGF directs fibroblast differentiation from human mesenchymal stem/stromal cells and defines connective tissue healing in a rodent injury model. J Clin Invest. 2010;120(9):3340–9. doi: 10.1172/JCI43230. [DOI] [PMC free article] [PubMed] [Google Scholar]
- 25.Lundby C, Nordsborg N, Kusuhara K, Kristensen KM, Neufer PD, Pilegaard H. Gene expression in human skeletal muscle: alternative normalization method and effect of repeated biopsies. Eur J Appl Physiol. 2005;95(4):351–60. doi: 10.1007/s00421-005-0022-7. [DOI] [PubMed] [Google Scholar]
- 26.Malm C, Nyberg P, Engstrom M, et al. Immunological changes in human skeletal muscle and blood after eccentric exercise and multiple biopsies. J Physiol. 2000;529(Pt 1):243–62. doi: 10.1111/j.1469-7793.2000.00243.x. [DOI] [PMC free article] [PubMed] [Google Scholar]
- 27.Mathers JL, Farnfield MM, Garnham AP, Caldow MK, Cameron-Smith D, Peake JM. Early inflammatory and myogenic responses to resistance exercise in the elderly. Muscle Nerve. 2012;46(3):407–12. doi: 10.1002/mus.23317. [DOI] [PubMed] [Google Scholar]
- 28.Matsakas A, Friedel A, Hertrampf T, Diel P. Short-term endurance training results in a muscle-specific decrease of myostatin mRNA content in the rat. Acta Physiol Scand. 2005;183(3):299–307. doi: 10.1111/j.1365-201X.2005.01406.x. [DOI] [PubMed] [Google Scholar]
- 29.McFarlane C, Hui GZ, Amanda WZ, et al. Human myostatin negatively regulates human myoblast growth and differentiation. Am J Physiol Cell Physiol. 2011;301(1):C195–203. doi: 10.1152/ajpcell.00012.2011. [DOI] [PMC free article] [PubMed] [Google Scholar]
- 30.McPherron AC, Lawler AM, Lee SJ. Regulation of skeletal muscle mass in mice by a new TGF-beta superfamily member. Nature. 1997;387(6628):83–90. doi: 10.1038/387083a0. [DOI] [PubMed] [Google Scholar]
- 31.Pedersen BK, Febbraio MA. Muscle as an endocrine organ: focus on muscle-derived interleukin-6. Physiol Rev. 2008;88(4):1379–406. doi: 10.1152/physrev.90100.2007. [DOI] [PubMed] [Google Scholar]
- 32.Pedersen BK, Febbraio MA. Muscles, exercise and obesity: skeletal muscle as a secretory organ. Nat Rev Endocrinol. 2012;8(8):457–65. doi: 10.1038/nrendo.2012.49. [DOI] [PubMed] [Google Scholar]
- 33.Quinn LS, Anderson BG, Strait-Bodey L, Stroud AM, Argilés JM. Oversecretion of interleukin-15 from skeletal muscle reduces adiposity. Am J Physiol Endocrinol Metab. 2009;296(1):E191–202. doi: 10.1152/ajpendo.90506.2008. [DOI] [PMC free article] [PubMed] [Google Scholar]
- 34.Sakoda H, Ogihara T, Anai M, et al. Activation of AMPK is essential for AICAR-induced glucose uptake by skeletal muscle but not adipocytes. Am J Physiol Endocrinol Metab. 2002;282(6):E1239–44. doi: 10.1152/ajpendo.00455.2001. [DOI] [PubMed] [Google Scholar]
- 35.Senn JJ, Klover PJ, Nowak IA, Mooney RA. Interleukin-6 induces cellular insulin resistance in hepatocytes. Diabetes. 2002;51(12):3391–9. doi: 10.2337/diabetes.51.12.3391. [DOI] [PubMed] [Google Scholar]
- 36.Sparks LM, Moro C, Ukropcova B, et al. Remodeling lipid metabolism and improving insulin responsiveness in human primary myotubes. PLoS One. 2011;6(7):e21068. doi: 10.1371/journal.pone.0021068. [DOI] [PMC free article] [PubMed] [Google Scholar]
- 37.Taylor WE, Bhasin S, Artaza J, et al. Myostatin inhibits cell proliferation and protein synthesis in C2C12 muscle cells. Am J Physiol Endocrinol Metab. 2001;280(2):E221–8. doi: 10.1152/ajpendo.2001.280.2.E221. [DOI] [PubMed] [Google Scholar]
- 38.Thomas M, Langley B, Berry C, et al. Myostatin, a negative regulator of muscle growth, functions by inhibiting myoblast proliferation. J Biol Chem. 2000;275(51):40235–43. doi: 10.1074/jbc.M004356200. [DOI] [PubMed] [Google Scholar]
- 39.Wang F, Liao Y, Li X, Ren C, Cheng C, Ren Y. Increased circulating myostatin in patients with type 2 diabetes mellitus. J Huazhong Univ Sci Technolog Med Sci. 2012;32(4):534–9. doi: 10.1007/s11596-012-0092-9. [DOI] [PubMed] [Google Scholar]
- 40.Willoughby DS, McFarlin B, Bois C. Interleukin-6 expression after repeated bouts of eccentric exercise. Int J Sports Med. 2003;24(1):15–21. doi: 10.1055/s-2003-37197. [DOI] [PubMed] [Google Scholar]
- 41.Yarasheski KE, Bhasin S, Sinha-Hikim I, Pak-Loduca J, Gonzalez-Cadavid NF. Serum myostatin-immunoreactive protein is increased in 60–92 year old women and men with muscle wasting. J Nutr Health Aging. 2002;6(5):343–8. [PubMed] [Google Scholar]