Abstract
Microbial dose response modelling is vital to a well-characterized microbial risk estimate. Dose response modelling is an inherently multidisciplinary field, which collates knowledge and data from disparate scientific fields. This multidisciplinary nature presents a key challenge to the expansion of microbial dose response modelling into new groups of researchers and modelers. This research employs a dose response optimization R code used in 18 peer-reviewed research studies to develop a multi-functional dose response software. The underlying R code performs an optimization of the two primary dose response models using the MLE method and outputs statistical analyses of the fits and bootstrapped uncertainty information for the models. VizDR (Visual Dose Response) was developed to provide microbial dose response modelling capabilities to a larger audience. VizDR is programmed in JavaScript with underlying Python scripts for intercommunication with Rserve. VizDR allows for dose response model visualization and optimization of a user's own experimental data.
Keywords: QMRA, Microbial dose response, Optimization, Software, Wiki
1. Introduction
Quantitative Microbial Risk Assessment (QMRA) modelling is a well-established tool for water quality and food safety (WHO, 2004; Haas et al., 2014; WHO, 2014). Stressors such as global climate change, global population growth, water stress and food scarcity have increased QMRA's importance for mitigating risks from emerging or reemerging pathogens (Hunter et al., 2011; Schijven et al., 2011). Given the need for credible QMRAs across multiple domains, it is the vision of the authors to make QMRA modelling freely accessible to all interested parties. The inspiration for this software came at the inception of the quantitative microbial risk assessment interdisciplinary instructional institute (QMRA-III). QMRA-III are NIH funded short courses for quantitative and non-quantitative scientists interested in QMRA, a field mostly dominated by physical scientists and engineers.
Dose response modelling is a vital step in the QMRA framework. Without a dose response model, a complete QMRA model is exceptionally difficult to develop if not impossible. Dose response modelling can be considered a niche research field, requiring a solid understanding of microbiology, pathology, mathematics and statistics. The microbiology skills are to understand the protocols used in development and delivery of the inoculum, thus assessing the applicability of the data to dose response modelling. Pathogenesis knowledge is used to determine the relevance and limitations of chosen exposure routes (e.g. intracranial versus inhalation) and the limitations of mechanistic assumptions within the model. Advanced mathematics knowledge is needed to understand how to develop approaches to optimize a model and subsequently write the requisite code to perform such algorithms. Cognizance of statistics allows for the inference of a good fit to candidate data, and to determine the confidence associated with applying the model across multiple hosts, pathogen strains, pathogen isolates and exposure routes.
Due especially to its regulatory and public health implications (US EPA, 2000; Petterson et al., 2006a,b), it is vital to make QMRA modelling more accessible to a broader set of expertise. A means of greater accessibility is through instructional programs such as QMRA-III (https://goo.gl/0zYgb5). Other such institutes include: Infrastructure for Health and Ecosystem Risk Assessment (IHERA), Joint Institute for Food Safety and Applied Nutrition (JIFSAN; http://jifsan.umd.edu) and formerly offered under the Center for Advancing Microbial Risk Assessment (CAMRA; www.camra.msu.edu). Unfortunately, these programs are limited by funding availability, the number of participants able to take these courses at any given time, and the amount of time required to instruct QMRA's underlying sciences. This instructional time constraint is no different for the QMRA courses offered in a select few universities. Software such as VizDR (Visual Dose Response) is a first step in allowing for a more effective use of instructional time regarding the specific steps in the QMRA framework, in this case the dose response step. VizDR and similar software will also alleviate the practitioner from developing or running complicated code routines for dose response modelling.
Currently there are a limited number of QMRA software applications that are scenario specific. This is unsurprising due to the scenario driven nature of QMRA (Haas et al., 2014), but, this limits their use outside of the given scenario of development. What can be seen in the following examples of QMRA software is the lack of software for microbial dose response model visualization and optimization. In all of these software packages the dose response model(s) is/are fixed, based on the pathogen(s) chosen or sole pathogen(s) available in the modelling software. Therefore, these packages disallow the user to: choose a dose response model or learn more about dose response modelling in general. Additionally, they do not provide the capacity for the user to develop their own optimized dose response model.
1.1. QMRA software for water
QMRASpot is a QMRA software developed by Kiwa Watercycle Research (KWR). QMRASpot specifically models drinking water systems for the Dutch government (Schijven et al., 2011). This is vital for the Netherlands due to their system not maintaining a chlorine residual (Smeets et al., 2009; Smeets, 2011). Water treatment and distribution system characteristics can be adapted to the user's treatment and distribution system. However, the overall exposure pathway and dose response models are imbedded, unchangeable and cannot be independently visualized in QMRASpot.
1.2. QMRA software for food
The FDA-iRISK is an integrative comparative risk assessment system primarily for food-borne hazards (Chen et al., 2013). iRISK is now expansive over a set of models and scenarios that can be incorporated into a risk model. iRISK limits the users’ interactions with the dose response model, simply displaying the dose response model name (i.e. exponential or beta Poisson, etc.) and their functional forms. iRISK regularly updates the dose response model using expert elicitation from dose response experts. However, the capability to choose, optimize or visualize the dose response models is not available in iRISK.
MicroHibro (http://www.microhibro.com/) is an on-line tool for microbial risk assessment in vegetables and meat products. The tool can be used to carry out a probabilistic exposure assessment based on predictive models of growth, inactivation and cross-contamination (Péerez Rodríguez, 2011). The WHO Food and Agriculture Organization of the United Nations (http://www.fstools.org/) provide QMRA tools for Cronobacter spp. in infant formula and for Campylobacter and Salmonella spp. in chicken meat. Since the tool is limited to these two pathogens there is no choice or interaction with the dose response models.
The Interactive online Catalogue on Risk assessment (ICRA; http://icra.foodrisk.org/) is a catalogue of existing microbial risk assessments. ICRA serves as a resource for risk modelers to use in the development of their own models. ICRA allows users to compare and contrast models for the same pathogen and/or commodity. ICRA is the closest of these four examples of being able to compare and learn more about the dose response models, being a catalogue of risk models. However, we again see an inability to directly visualize current dose response models and no ability for the users to optimize dose response models to their own data.
1.3. Chemical and radiological dose response software
The need for dose-response modelling software was first recognized for chemical risk assessment. Several tools exist, but they do not incorporate the models recommended for use in microbial risk assessment. The U.S. Environmental Protection Agency (EPA) benchmark dose software (BMDS; https://goo.gl/jxSq1d) is used to fit mathematical models to dose response data using established empirical relationships for chemical hazards. Collaborative Drug Discovery (CDD; https://www.collaborativedrug.com) is a proprietary cloud-based tool for high-throughput screening of drugs that fit select dose response models for chemical compounds (Hohman et al., 2009). There is open source software for chemical dose response modelling too. UNISTAT 6.5 (https://www.unistat.com) Statistics Software (London, England, UK) can fit the logit, probit and gompit models. DRC is an R (R Core Team., 2014) dose response modelling package for three and four parameter, sigmodal models including the log-logistic and Weibull (Knezevic et al., 2007).
These tools and packages demonstrate two things: (1) the need for software support for microbial dose response modelling; and (2) the breadth of the various dose response models that are standardized and unique to different domains of study. While software exists for QMRA, they are focused on providing researchers, risk assessors, regulators and decision makers with the capabilities of using a QMRA model already developed. As the dose response model is vital to a QMRA (Weir and Haas, 2011; Haas et al., 2014), the absence of the ability to optimize a dose response model from raw data without consulting with a dose response modelling expert is a limiting step in the QMRA framework. VizDR is a dose response modelling and visualization software intended to end this limitation in QMRA and can be found at the QMRAWiki (https://goo.gl/al7OAB).
2. Methods and materials
2.1. Mechanistic microbial dose response models
A model is only as relevant as its underlying assumptions and methods of derivation. In the case of microbial dose response modelling it is important to derive a model from mechanistic roots. Theoretically any function that is bounded on (0,1) for the dependent variable range and has support to infinity for the independent variable can be considered a candidate model. In the case of QMRA there is a need for biological plausibility for the dose response models (Haas, 1983; Haas et al., 2014). Additionally it is often recommended to use biologically plausible dose response models for QMRA by government and nongovernmental organizations (US EPA, 2014; WHO., 2016b). Mechanistic dose response models describing a generalization of the underlying pathogenesis mechanisms provide this biological plausibility. To accomplish this in a generalizable manner Haas et al. (2014) outlines the derivation of the mechanistic models but the underlying principles are: a bolus exposed dose with Poisson variability about the mean (d), from which there is a binomial likelihood of k pathogens that survive to initiate an infection. The mechanistic microbial dose response models are the exponential (Equation (1), parameter r) and beta Poisson (Equation (2), parameters α and N50). In Equation (1) r is an estimate of the probability of one organism surviving post-exposure to develop an infection in the host. Equation (2) is an approximation of the exact form of the beta Poisson model, the development of which is outlined in Haas et al. (2014). Use of the approximated form of the beta Poisson model is predicated on α ≪ N50 and N50 ≥ 1 (Weir, 2016). This approximated form retains the linearity at low doses, a vital characteristic of microbial dose response models (Haas et al., 2014;Weir, 2016). In Equation (2) N50 refers to an estimate of the median infectious dose with units of counts (i.e. CFU, PFU, cells, etc.) and α is a unitless model parameter.
| (1) |
| (2) |
While there are empirical model options that can theoretically be used for dose response modelling, these are generally not as widely used in QMRA (Petterson et al., 2006a,b; WHO., 2016a; Haas et al., 2014). Therefore, VizDR was developed to visualize and optimize the mechanistic biologically plausible dose response models.
2.2. VizDR underlying R code and its functionality
VizDR uses an underlying R code has been used to develop optimized dose response parameters in 18 peer reviewed dose response modelling publications (Bartrand et al., 2008; Tamrakar and Haas, 2008a, 2008b, 2011; Huang and Haas, 2009; Huang et al., 2009; Jones et al., 2009; Weir, 2009; Weir and Haas, 2009; Watanabe et al., 2010; Huang and Haas, 2011; Teske et al., 2011; Weir and Haas, 2011; Watanabe et al., 2012; Watanabe et al., 2014; Coulliette et al., 2013; Teske et al., 2014; Breuninger and Weir, 2015). The parameters being optimized in dose response modelling code develop specific dose response models to those data used in the parameter optimization. This R code continues to be used for microbial dose response modelling in papers currently under review and revision.
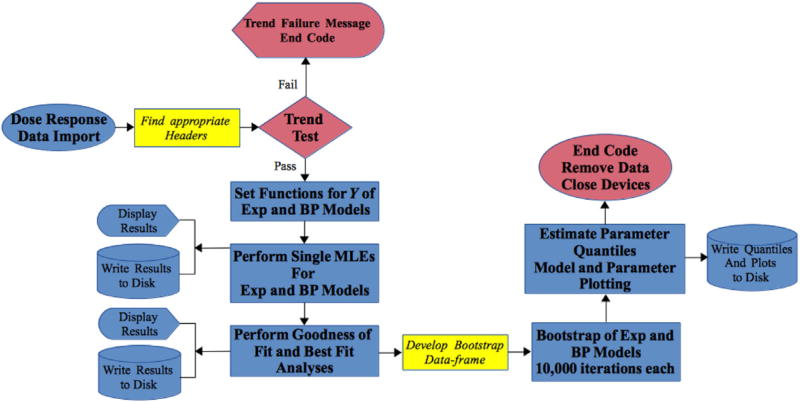
The underlying R code that is the computational core of VizDR is a streamlined dose response optimization and modelling code. The algorithm used by the R code can be seen in Fig. 1. The R code performs a maximum likelihood estimation (MLE) on the negative 2 log-likelihood of the dose response models, herein referred to as the deviance (Y; Equation (3)). The Y statistic is a function of: predicted probability of response (πi, from the model), observed probability of response ( , from the data), number of positive responses (pi) and number of hosts in each dose group (ni). By optimizing for Y the test statistic for goodness of fit and best fitting model analyses is minimized, thereby, allowing for rapid inferences from the optimization. As can be seen in Fig. 1 the bootstrap method is used to assess the uncertainty in the parameter estimates after the inferences are made.
| (3) |
Fig. 1.
Algorithm of underlying dose response optimization R code. Exp refers to the exponential dose response model and BP refers to the beta Poisson dose response model and trend test referes to the Cochran-Armitage trend test. The colours in the figure outline the following: red for paths to purposely end computations and exit code execution, yellow for data import and blue for code functions. (For interpretation of the references to colour in this figure legend, the reader is referred to the web version of this article.)
Following the algorithm in Fig. 1, once the data are imported the code is instructed to identify English language strings that have dose, positive and negative in separate columns in the header. An example of dose response data can be seen in Table 1, which is a set of pooled non-human data published under one dose response model (Haas et al., 2014). Table 1 shows infection data for three strains of pathogenic Escherichia coli (E. coli): Enteropathogenic (June et al., 1953), Enteroinvasive (Graham et al., 1983) and Enterotoxigenic (DuPont et al., 1971)
Table 1.
Example of dose response data using oral exposure data for pathogenic E. coli.
| Dose (d)a | Positive response (pi)b | Negative response | Total (ni) |
|---|---|---|---|
| 10,000 | 0 | 5 | 5 |
| 10,000 | 0 | 5 | 5 |
| 1,000,000 | 0 | 5 | 5 |
| 1,000,000 | 1 | 8 | 9 |
| 100,000,000 | 1 | 4 | 5 |
| 100,000,000 | 5 | 3 | 8 |
| 100,000,000 | 3 | 2 | 5 |
| 100,000,000 | 2 | 3 | 5 |
| 143,000,000 | 6 | 2 | 8 |
| 270,000,000 | 9 | 7 | 16 |
| 1,730,000,000 | 5 | 2 | 7 |
| 5,330,000,000 | 6 | 2 | 8 |
| 10,000,000,000 | 4 | 1 | 5 |
| 10,000,000,000 | 3 | 2 | 5 |
| 16,000,000,000 | 7 | 1 | 8 |
Example data for exposure to Escherichia coli.
CFU.
Host infection.
The Cochran-Armitage trend test (Equation (4)) is used to determine the significance of a trend between the dose (di, independent variable), n adjusted doses (d̅), ni, pi and the summed observed probability of response (p̅ dependent variable). The summations are carried out from 1 to j doses in the experiment (Haas et al., 2014).
| (4) |
To pass the trend test, Zca must be greater than 95th confidence interval of the normal distribution (1.644). This is an important quality assurance check to ensure that a trend between the dose and observed probability of response exists before attempting dose response model optimization. After assessing the statistical significance of the trend, the MLE results are used to establish baseline goodness of fit and best fitting analyses results. The MLE method is a consistent estimator allowing it to converge to an optimal solution even for small sample sizes (Rizzo, 2008; Weir, 2016). Since dose response data are most typically small datasets the MLE is ideal for dose response model optimization.
After Y is minimized and optimal parameters for the respective models are determined, two fundamental inferences are made. These inferences are made from an adaptation of the likelihood ratio test. Therefore, there is the potential especially for larger number of doses that despite a good fit in actuality, the test may fail. The likelihood of having such a large number of doses in microbial dose response modelling however is very low. The goodness of fit is inferred by comparing the minimized Y to the chi-squared (χ2) distribution's critical value. This critical value is selected at a chosen confidence interval (CI; 0.05) and N-m degrees of freedom where: N is the number doses and m is the number of parameters for the respective model (e.g. 1 for exponential). Next the best fitting model is assessed, where this inference is made by first calculating the difference in minimized Y (Δ; Equation (5)), where Ye and YBP are the Ys for the exponential and beta Poisson models respectively. Δ is then compared to the χ2 critical value at one degree of freedom.
| (5) |
After these inferences are assessed they are printed to the screen and saved as comma separated values (.CSV) files. The bootstrap is invoked after these analyses, holding iterations at 10,000 for both the exponential and beta Poisson models. Just as in the standard MLEs performed earlier the bootstrapped MLEs use the Broyden-Fletcher-Goldfarb-Shanno (BFGS) algorithm for optimization. The BFGS does not require smooth optimizations, and since it estimates the Hessian matrix from gradient evaluations rather than direct derivation (quasi-Newtonian), it is much faster. During a bootstrap iteration the dose response data are randomly sampled with replacement from the positive responses. These new computational data are then used to optimize the dose response models. After all iterations for both models are complete, the resulting computational data: Y, optimized parameter(s) and ID50 – infectious dose for 50% of the population (outputted only for the exponential model) – are saved to. CSV files on local storage.
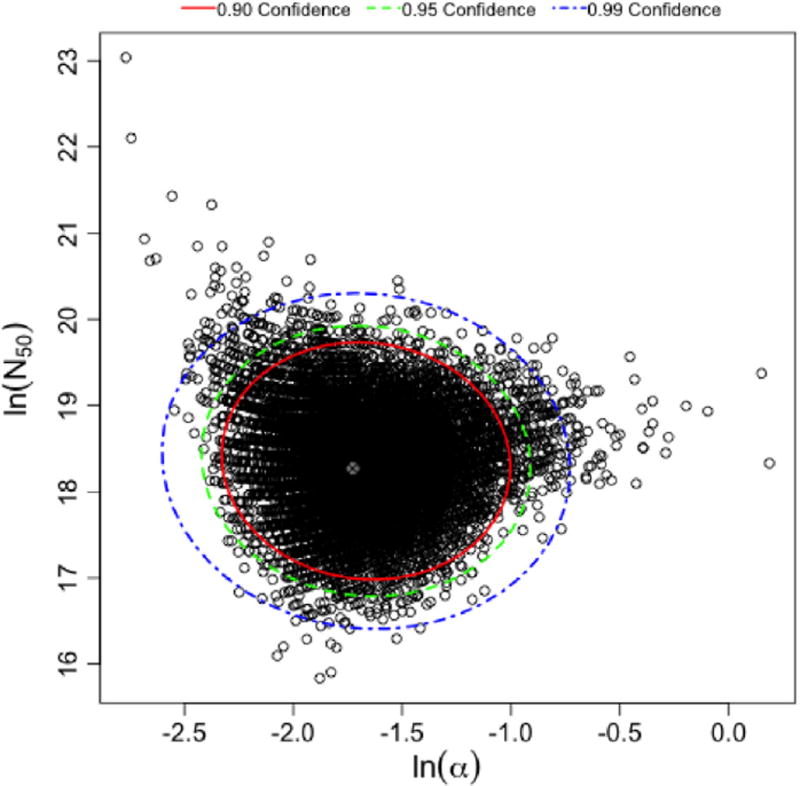
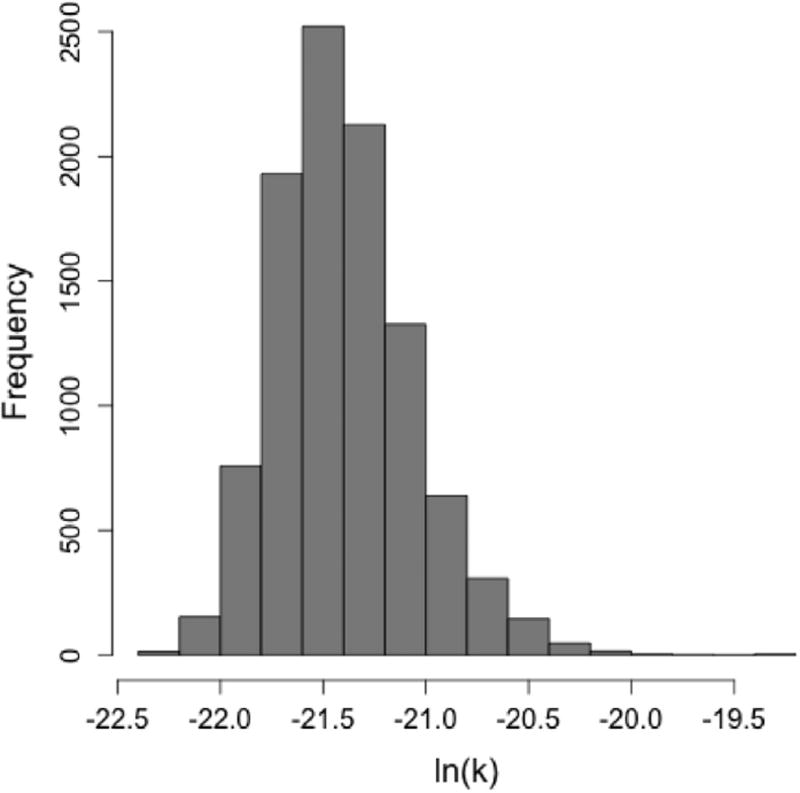
There has been debate regarding the use of non-bootstrapped optimized parameters within a QMRA model. Therefore, in line with robust statistics an estimate the median parameter value(s) from the bootstrap are calculated. Since the α and N50 parameters have a functional relationship they are more akin to multivariate data, thus requiring the depth median. Also α and N50, percentiles are not a simple calculation and may be erroneous. Therefore, the best approach is to visualize their uncertainty via a plot. The r parameter does not have this complication therefore percentiles can be estimated for it, but a histogram is also generated to visualize parameter uncertainty.
2.3. Functioning of VizDR
Within VizDR the user can select their pathogen of interest if an optimized dose response model already exists. The menu is linked directly with the QMRAWiki (qmrawiki.canr.msu.edu). The QMRAWiki is a semantic wiki, which ensures that updates to tables on the QMRAWiki automatically update applications using the data in them. This results in VizDR always having the most up-to-date information on recommended dose response models to use for the selected pathogen. Therefore, VizDR streamlines the process of finding the dose response parameter value(s) from the QMRAWiki. All pertinent information is displayed from the associated dose response experiments including: pathogen strain, host species, exposure route, number of doses and dose units, median infectious dose, response type and reference for the data. This information is displayed along with a plot to visualize the dose response relationship. Where the application is most useful for future research and QMRA modelling is in the option for users to fit the dose response models to their own data. This option allows the user to access the R code directly thus using the same rigor that as has been used in eighteen peer-reviewed publications.
One of the current model fitting limitations is the ability to use the platform's local and storage media. If VizDR was to be downloaded and used on a smartphone, there may not be sufficient memory (virtual or physical) to operate all the bootstrap iterations and save the computational data. Therefore, the current version of VizDR is hosted on a server. No access is requested or made to the users' device or memory, therefore the outputs that would typically be saved in a working directory are instead displayed to the user. The user is instead given the option of developing a PDF of the outputs to save on their device.
Once the R code has run, the results are sent back to the client application in JavaScript Object Notation (JSON) format. On the client side the inferences for the goodness of fit and best fitting model analyses are displayed to the user. Also on the client-side, d3, a popular, open-source JavaScript data-visualization library, is used to plot: the data, optimized models and confidence intervals for the models. The uncertainty plot of ln(α) and ln (N50) parameters from the bootstrapped beta Poisson model, and a histogram of the ln(r) parameter from the bootstrapped exponential model are generated.
3. Results
3.1. R code outputs and inferences to be made
For this example use of the R code, the dose response data for pathogenic E. coli from Table 1 is used. The MLE minimizes Y and in doing so determines optimal values for r for the exponential α and N50 for the beta Poisson. Example results can be seen in Tables 2 and 3, where the goodness of fit and better fitting analyses are respectively displayed. These outputs display the better fitting model and demonstrate the metrics used to come to this conclusion. Table 4 shows the optimal parameters determined using MLE optimization (not bootstrapped).
Table 2.
Example of goodness of fit analysis and resulting inference.
| Model | Y | χ2CI, N-m Critical * | χ2CI, N-m p-value * | Conclusion |
|---|---|---|---|---|
| Exponential | 119.49 | 23.68 | 0 | Exponential model does not show a good fit to the data |
| Beta poisson | 6.56 | 22.36 | 0.92 | Beta poisson shows a good fit to the data |
Ho: The model is a good fit to the data – if not using p-value: Y < χ2CI, N-m critical value to fail to reject.
Table 3.
Example of better fitting model analysis and resulting inference.
| Model | Y | Δ | χ2CI, 1 Critical * | χ2CI, 1 p-value * | Conclusion |
|---|---|---|---|---|---|
| Exponential | 119.49 | 112.94 | 3.84 | 0 | Beta poisson is the best fitting model |
| Beta poisson | 6.56 |
Ho: The simplest model is the best fitting model – if not using p-value: Δ < χ2CI, N-m critical value to fail to reject.
Table 4.
Resulting dose response parameters from the non-bootstrapped MLE.
| Model | Y | Parameter value |
|---|---|---|
| Exponential | 119.49 | r = 4.84 (10−10) |
| Beta poisson | 6.56 | α = 0.178 N50 = 8.60 (10+7) |
Figs. 2 and 3 are the uncertainty plots for the exponential and beta Poisson models respectively. A histogram is used for the r parameter to demonstrate its central tendency and skewness. A scatter plot with confidence ellipses is used for the α and N50 confidence intervals. These outputs as well as a table with percentiles (for the exponential model only) present QMRA modelers with the optimal parameter(s) and range(s) to use.
Fig. 2.
Uncertainty plot for α and N50 parameter estimates from the bootstrap ellipses are confidence ellipses for the corresponding confidence levels. Plot shows a tight grouping of estimates from the 10,000 iterations, from this plot percentiles can be directly inferred.
Fig. 3.
Histogram of r parameter from the bootstrap estimates, showing a strong grouping of the parameter estimates for all 10,000 iterations.
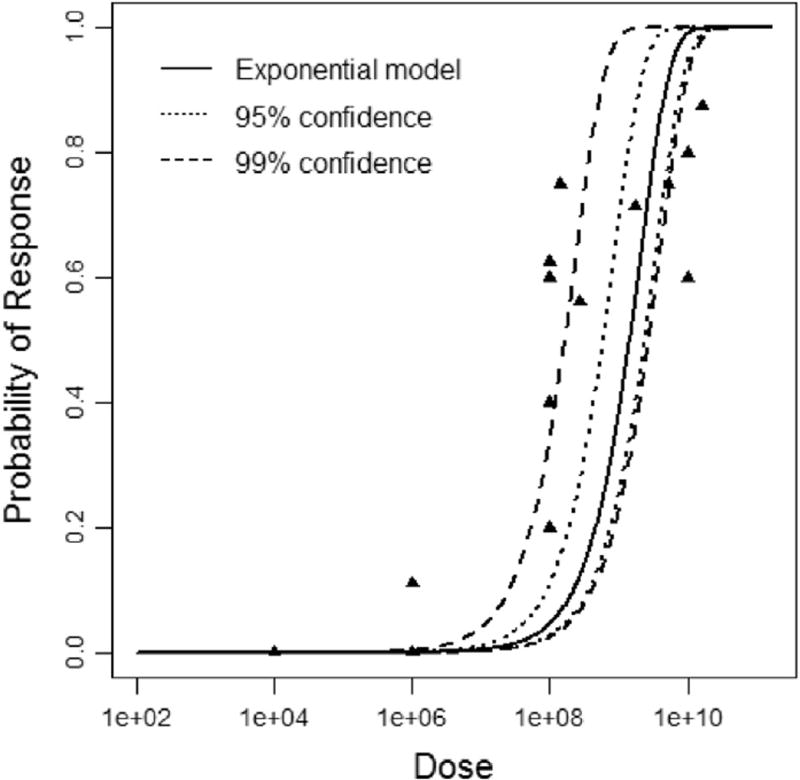
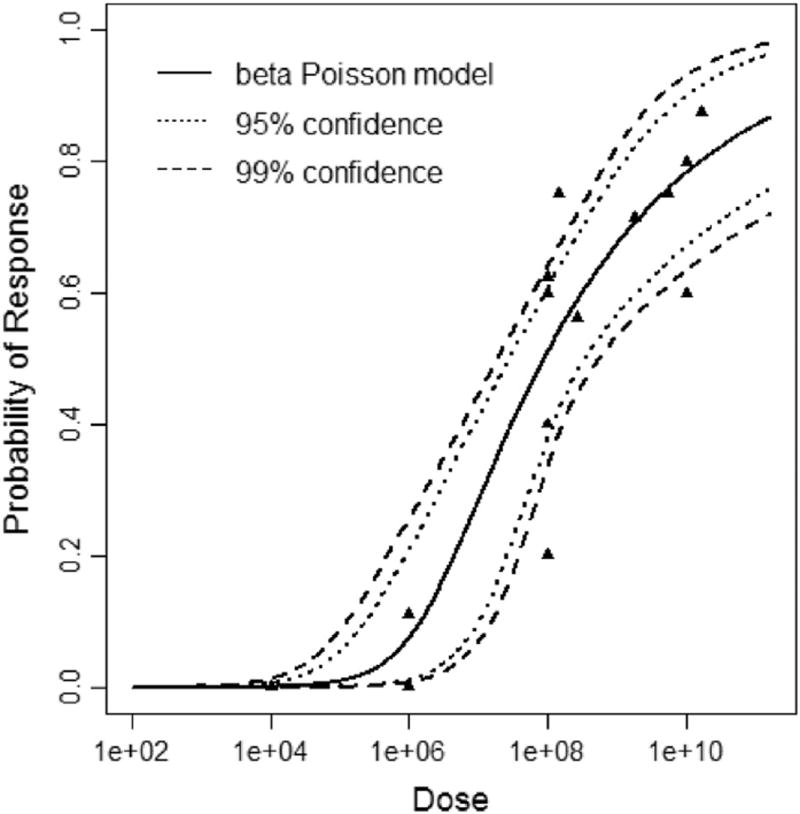
The last outputs from the R code are the dose response plots. These are scatter plots of the dose and observed probability of response on a log-log scale. The optimal set of parameters from the non-bootstrapped MLEs are used to draw the model line (solid line), which is then bounded by the upper and lower 95th and 99th confidence intervals from the sets of parameter(s) from the bootstrap (Figs. 4 and 5). While it looks as though the models are smoothed for the plot, this is not the case, as this would risk residual effects, such as erring into the negative x-axis region. The data are split into 700 divisions to plot smooth lines for the model and confidence intervals. This was done to achieve smooth lines without requiring smoothing functions such as a C or S spline.
Fig. 4.
Exponential dose response model curve showing the optimal solution (solid line) and upper and lower 95th and 99th percentiles of the model in the dotted lines.
Fig. 5.
beta Poisson dose response model curve showing the optimal solution (solid line) and upper and lower 95th and 99th percentiles of the model in the dotted lines.
3.2. Example use of VizDR
3.2.1. Use of VizDR for visualization and quick reference to dose response models in the wiki
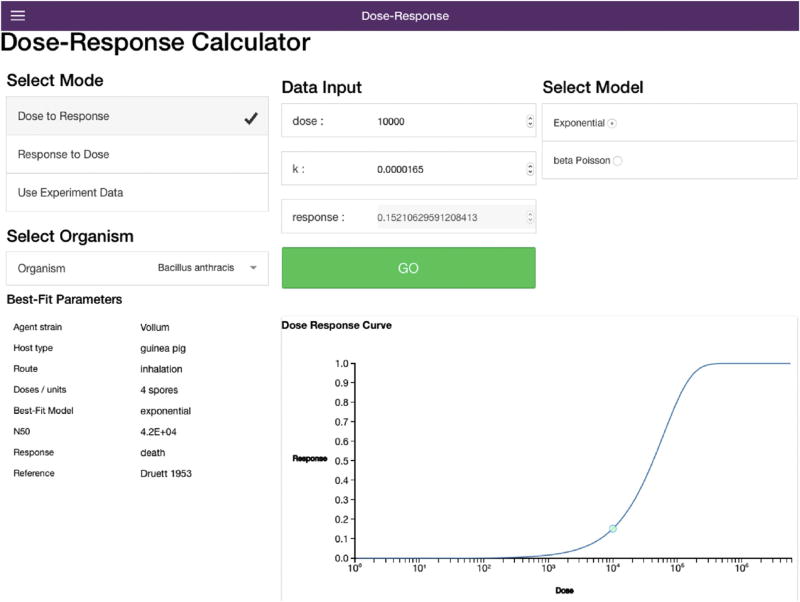
The users can interact with the current library of optimized dose response models using VizDR in two ways. The user will choose the mode as Dose to Response or Response to Dose, which operates only the visualization portion of VizDR. The user will then select a pathogen from the drop down list (Fig. 6), in this case a known Bacillus anthracis dose response model. The user can then visualize the information regarding this optimized dose response model such as: pathogen strain, host animal, exposure route, dose units, the best fitting model, associated median infectious dose, response monitored for in the experiments and reference for the original data. Once the user enters a dose estimate (top center column of Fig. 6) the resulting risk of response is visualized at the bottom of the screen. The dose can be estimated from a known response percentage if the mode is changed to Response to Dose.
Fig. 6.
Dose to response and response to dose modes, both of these act as the dose response model visualization portion of VizDR. As can be seen an easy look up of the best fitting dose response model for B. anthracis is being visualized for 10,000 spores.
3.2.2. Use of VizDR for optimization and bootstrapping using experimental data
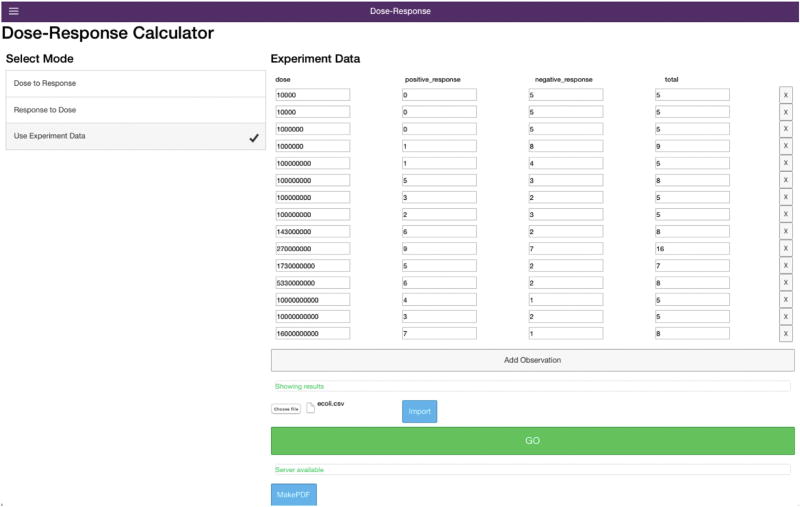
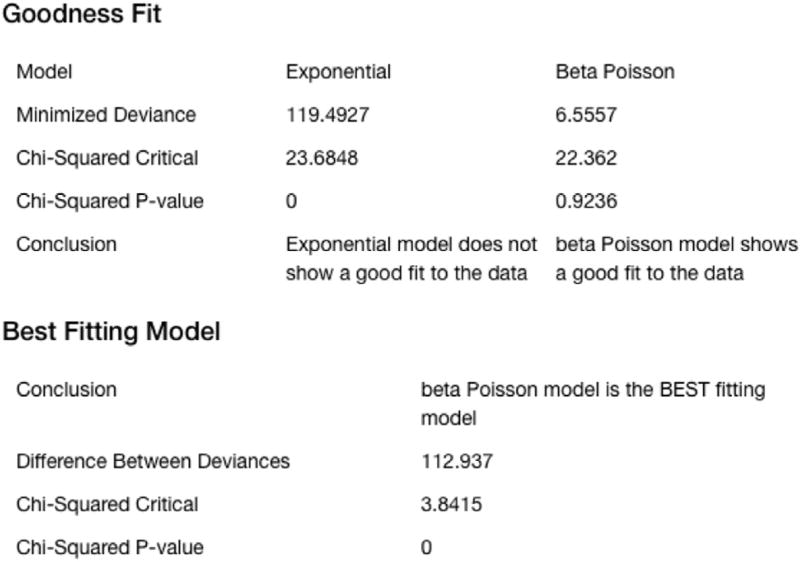
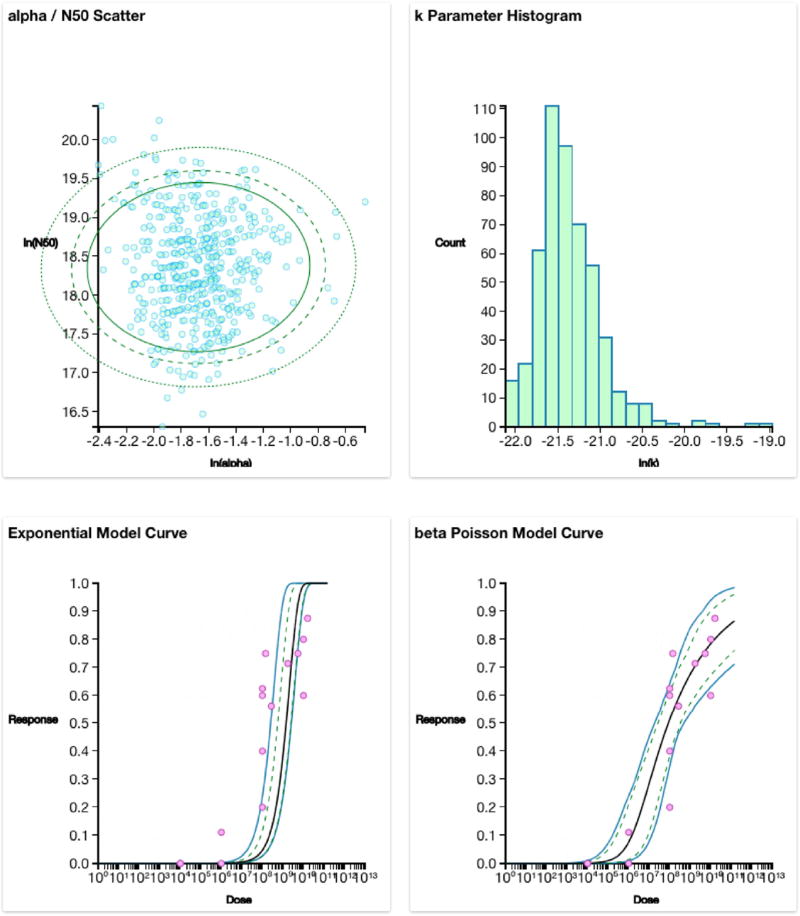
As with the R code example a pooled dataset for multiple strains of pathogenic E. coli (Table 1) is used. Selecting the mode as Use Experimental Data shows a data import screen, where the user can either upload a. CSV file of their data or enter it manually (Fig. 7). Once the data are uploaded clicking GO will use the underlying R script to optimize and bootstrap the dose response models. Once all 5000 bootstrap iterations have completed then the outputs are displayed below the loading screen. Scrolling down the user will see: the MLE outputs with parameter estimates and the goodness of fit and best fitting model analyses results (Fig. 8). Scrolling down further the user will see the plots generated from the R script (Fig. 9). The top two plots of Fig. 9 show the parameter uncertainty plot for the beta Poisson and exponential models (from left to right), and the bottom plots show the dose response model plots with confidence intervals for the exponential and beta Poisson (from left to right).
Fig. 7.
Data upload screen for use of the user's own experimental data or data garnered from a literature review.
Fig. 8.
The first outputs demonstrate the inferences that can be made from the dose response optimization.
Fig. 9.
Bootstrap plot results, the top plots demonstrate the uncertainty of the parameters after the bootstrap is operated. The top right plot has confidence ellipses for the 90, 95 and 99th percentiles. The bottom plots are the dose response models with confidence intervals (dashed and solid blue lines for 90 and 95th percentiles respectively) around the MLE optimized model (solid black line). The differences seen between these outputs and those seen in Figs. 2 and 5 is that there are 5000 bootstrap iterations for the software and 10,000 for the R code. (For interpretation of the references to colour in this figure legend, the reader is referred to the web version of this article.)
4. Discussion
VizDR is designed to use an underlying R code that has been used in 18 peer-reviewed journal publications. One of the limitations of the app can be viewed as the set of models used. The dose response models used are the accepted biologically plausible mechanistic dose response models that have been used in regulatory and other decision analyses (Petterson et al., 2009; Messner et al., 2006; Huang et al., 2010; Weir et al., 2011).
VizDR can be used within the QMRA paradigm in two primary ways. First the dose response model that has already been optimized for a known pathogen can be looked up from the QMRA Wiki with ease. By maintaining the tool's mode at “Dose to Response” the drop-down menu can be used to find the pathogen of interest to the user. The user is then informed which: dose response model, parameter value and parameter uncertainty values to use in their QMRA. The second primary use is the optimization of the dose response models to the user's own data. This allow the user to determine a best fitting optimized dose response model based on their data or data from the open literature. This can be for data not included in the QMRA Wiki's warehouse of dose response data or their own animal model data. In both of these uses the user is aided in performing a Monte Carlo for the QMRA with ease since the uncertainty of the dose response model parameter can be included in the Monte Carlo QMRA model.
The form of the beta Poisson model used is an approximation from the exact form, which utilizes the confluent hypergeometric function. This was done for three reasons: first, this form of the beta Poisson is easier for novices and students to understand and to make inferences with since N50 is an estimate of the median infectious dose. Second, the optimization of the hypergeometric function is not sufficiently stable for an online app such as this one. Third, regulators, engineers and decision analysts – primary target users of VizDR – are likelier to be familiar with QMRA in general, therefore, this form of the beta Poisson model.
VizDR will be used and further evaluated during the QMRA-III summer institutes to determine the applicability of its use for QMRA model development by novices and students. Also all VizDR users will be encouraged to contact the editor of the QMRAWiki dose response page to upload and share new models (once peer reviewed) among those that have already been archived.
The current version of VizDR is limited to 5000 iterations due to the current server infrastructure being used. This is being rectified by moving VizDR to dedicated servers owned by Michigan State University. The improved bandwidth will allow for all 10,000 iterations for the bootstraps. This will improve the uncertainty assessment of the parameters in VizDR when compared to the R code.
5. Conclusions
The field of QMRA is growing and becoming more inclusive of other fields, a movement that is needed for its expansion, broader use and further refinement. As the use of QMRA models for policy and wider decisions beyond engineering systems increases, expansion of the field to include less quantitatively oriented scientists is needed. This can be heavily limited by the requirement for a dose response model to perform a modern QMRA and the lack of one being a quantitative gap precluding them from developing a QMRA model. To this end software has been developed to allow for easy access to a library of peer reviewed dose response models and data. This software (VizDR: Visual Dose Response) allows for easy reference and visualization of the dose response models already housed in the QMRAWiki. VizDR visualizes the best dose response model to use for a selected pathogen. VizDR also allows for the use of the same optimization code developed by dose response modelling experts and used in 18 individual dose response modelling research projects. VizDR is designed to address the dose response modelling step in the QMRA framework, thus being a first step in an adaptive QMRA software. VizDR will also allow quantitative scientists greater time to focus on the environmental exposure and risk characterization models in the QMRA.
VizDR is the beginning of a series of apps to bring QMRA and risk modelling as a freely accessible tool to multiple communities around the globe. Therefore, the app will be continually hosted on the QMRAWiki, an interactive knowledge repository and platform for collaborative QMRA development (Mitchell et al., 2014). It will be updated with new functionality as needed or requested.
Acknowledgments
The Quantitative Microbial Risk Assessment Interdisciplinary Instructional Institute and development of this software are supported by National Institute of General Medical Sciences of the National Institutes of Health (NIH) under Award Number R25GM108593 Funding for research towards the underlying R code was supported by Center for Advancing Microbial Risk Assessment (CAMRA) under STAR grant #R83236201.
Footnotes
Code availability
The R source code for dose response optimization and app pseudo code (due to its size) are available at the QMRA wiki (http://qmrawiki.canr.msu.edu/index.php/Dose_Response_Modeling_R_Code). The code as well as the description contains instructions for use. The code and software will work on Windows, Mac and Linux equally well. The user will need to have an updated version of R (https://cran.r-project.org/) and their own dose response data, the outline of which can be seen in the software as well as the code description file. The developer is Dr. Mark H. Weir who's contact information can be seen under his affiliation in the author list.
References
- Bartrand TA, Weir MH, Haas CN. Dose-response models for inhalation of Bacillus anthracis spores: interspecies comparisons. Risk Anal. 2008;28(4):1115–1124. doi: 10.1111/j.1539-6924.2008.01067.x. http://dx.doi.org/10.1111/j.1539-6924.2008.01067.x. [DOI] [PubMed] [Google Scholar]
- Breuninger KJ, Weir MH. Development of an interspecies nested dose-response model for Mycobacterium Avium subspecies paratuberculosis. Risk Anal. 2015 doi: 10.1111/risa.12380. http://onlinelibrary.wiley.com/doi/10.1111/risa.12380/full. [DOI] [PubMed]
- Chen Y, Dennis SB, Hartnett E, Paoli G, Pouillot R, Ruthman T, Wilson M. FDA-iRISK—A comparative risk assessment system for evaluating and ranking food-hazard Pairs: case studies on microbial hazards. J. Food Prot. 2013;76:376–385. doi: 10.4315/0362-028X.JFP-12-372. http://dx.doi.org/10.4315/0362-028X.JFP-12-372. [DOI] [PubMed] [Google Scholar]
- Coulliette AD, Enger KS, Weir MH, Rose Risk reduction assessment of waterborne Salmonella and Vibrio by a chlorine contact disinfectant point-of-use device. Int. J. Hyg. Environ. Health. 2013;216(3):355–361. doi: 10.1016/j.ijheh.2012.08.007. http://dx.doi.org/10.1016/j.ijheh.2012.08.007. [DOI] [PubMed] [Google Scholar]
- DuPont HL, Formal SB, Hornick RB, Snyder MJ, Libonati JP, Sheahan JP, LaBrec EH, Kalas JP. Pathogenesis of Escherichia Coli diarrhea. N. Engl. J. Med. 1971;285(1):1–9. doi: 10.1056/NEJM197107012850101. http://dx.doi.org/10.1056/NEJM197107012850101. [DOI] [PubMed] [Google Scholar]
- 6.Graham DY, Estes MK, Gentry LO. Double-blind comparison of bismuth subsalicylate and placebo in the prevention and treatment of enterotoxigenic Escherichia Coli-Induced diarrhea in volunteers. Gastroenterology. 1983;85(5):1017–1022. [PubMed] [Google Scholar]
- 7.Haas CN. Estimation of risk due to low doses of microorganisms: a comparison of alternative methodologies. Am. Jounral Epidemiol. 1983;118(4):573–582. doi: 10.1093/oxfordjournals.aje.a113662. [DOI] [PubMed] [Google Scholar]
- 8.Haas CN, Rose JB, Gerba CP. Quantitative Microbial Risk Assessment. Second. J. Wiley and Sons; 2014. [Google Scholar]
- 9.Hohman M, Gregory K, Chibale K, Smith PJ, Ekins S, Bunin B. Novel web-based tools combining chemistry informatics, biology and social networks for drug Discovery. Drug Discov. Today. 2009;14(5–6):261–270. doi: 10.1016/j.drudis.2008.11.015. http://dx.doi.org/10.1016/j.drudis.2008.11.015. [DOI] [PubMed] [Google Scholar]
- 10.Huang Y, Haas CN. Time-dose-response models for microbial RIsk assessment. Risk Anal. 2009;29(5):648–661. doi: 10.1111/j.1539-6924.2008.01195.x. [DOI] [PubMed] [Google Scholar]
- 11.Huang Y, Haas CN. Quantification of the relationship between bacterial kinetics and host response for monkeys exposed to aerosolized Francisella Tularensis. Appl. Environ. Microbiol. 2011;77(2):485–490. doi: 10.1128/AEM.01190-10. http://dx.doi.org/10.1128/AEM.01190-10. [DOI] [PMC free article] [PubMed] [Google Scholar]
- 12.Huang Y, Bartrand TA, Haas CN, Weir MH. Incorporating TIme post-inoculation into a dose-response model of Yersinia Pestis in mice. J. Appl. Microbiol. 2009;107:727–735. doi: 10.1111/j.1365-2672.2009.04248.x. [DOI] [PubMed] [Google Scholar]
- 13.Huang Y, Hong T, Bartrand TA, Gurian PL, Haas CN, Liu R, Tamrakar SB. How sensitive is Safe? Risk-Based targets for ambient monitoring of pathogens. IEEE Sensors J. 2010;10(3):668–673. http://dx.doi.org/10.1109/JSEN.2009.2038659. [Google Scholar]
- 14.Hunter PR, de Sylor MA, Risbero HL, Nichols GL, Kay D, Hartemann P. Quantitative microbial risk assessment of cryptosporidiosis and giasrdiasis from very small private water supplies. Risk Anal. 2011;31:228–236. doi: 10.1111/j.1539-6924.2010.01499.x. [DOI] [PubMed] [Google Scholar]
- 15.Jones RM, Masago Y, Bartrand TA, Haas CN, Nicas M, Rose JB. Characterizing the risk of infection from Mycobacterium Tuberculosis in commercial passenger aircraft using quantitative microbial risk assessment. Risk Anal. 2009;29(3):355–365. doi: 10.1111/j.1539-6924.2008.01161.x. http://dx.doi.org/10.1111/j.1539-6924.2008.01161.x. [DOI] [PubMed] [Google Scholar]
- 16.June RC, Ferguson WW, Worfel MT. Experiments in Feeding adult volunteers with Escherichia Coli 55, B5, a coliform organism associated with infant diarrhea. Am. J. Hyg. 1953;57(2):222–236. doi: 10.1093/oxfordjournals.aje.a119570. [DOI] [PubMed] [Google Scholar]
- 17.Knezevic SZ, Streibig JC, Ritz C. Utilizing R software package for dose-response studies: the concept and data analysis. Weed Technol. 2007;21(3):840–848. http://dx.doi.org/10.1614/WT-06-161.1. [Google Scholar]
- 18.Messner M, Shaw S, Regli S, Rotert K, Blank V, Soller J. An approach for developing a national estimate of waterborne disease due to drinking water and a national estimate model application. J. Water Health. 2006;4(S2):201–240. doi: 10.2166/wh.2006.024. [DOI] [PubMed] [Google Scholar]
- 19.Mitchell J, Weir MH, van Osch W, Rose JB. iEMSS 2014 Proceedings. San Diego, CA, USA: iEMSs; 2014. The QMRA wiki: a social media tool for interdisciplinary and interagency collaboration for quantitative microbial risk assessment. http://www.iemss.org/sites/iemss2014/papers/iemss2014_submission_249.pdf. [Google Scholar]
- 20.Pérez Rodríguez F, Campos D, Ryser ET, Buchholz AL, Posada-Izquierdo GD, Marks BP, Zurera G, Todd E. A mathematical risk model for Escherichia Coli O157:H7 cross-contamination of lettuce during processing. Food Microbiol. 2011;28(4):694–701. doi: 10.1016/j.fm.2010.06.008. http://dx.doi.org/10.1016/j.fm.2010.06.008. [DOI] [PubMed] [Google Scholar]
- 21.Petterson S, Signor R, Ashbolt NJ, Roser D. QMRA Methodology. 2006a http://www.microrisk.com/uploads/microrisk_qmra_methodology.pdf.
- 22.Petterson S, Signor R, Ashbolt NJ, Roser D. Microbial risk assessment: a scientific basis for managing drinking water safety from source to Tap. QMRA Methodology. Microrisk. 2006b http://www.microrisk.com/uploads/microrisk_qmra_methodology.pdf.
- 23.Petterson S, Dumoutier N, Loret JF, Ashbolt NJ. Quantitative bayesian predictions of source water concentration for QMRA from presence/absence data for E. Coli O157:H7. Water Sci. Technol. 2009;59(11):2245–2252. doi: 10.2166/wst.2009.264. [DOI] [PubMed] [Google Scholar]
- 24.R Core Team. R: a Language and Environment for Computing. R Foundation for Statistical Computing; Vienna, Austria: 2014. [Google Scholar]
- 25.Rizzo ML. Statistical Computing with R. Taylor and Francis; Boca Raton, FL: 2008. [Google Scholar]
- 26.Schijven JF, Teunis PFM, Rutjes SA, Bouwknegt M, Husman AMdR. QMRAspot: a tool for quantitative microbial risk assessment from surface water to potable water. Water Res. 2011;45(17):5564–5576. doi: 10.1016/j.watres.2011.08.024. [DOI] [PubMed] [Google Scholar]
- 27.Smeets PWMH. Stochastic Modelling of Drinking Water Treatment in Quantitative Microbial Risk Assessment. IWA Publishing; London, UK: 2011. [Google Scholar]
- 28.Smeets PWMH, Medema GJ, Van Dijk JC. The Dutch secret: how to provide safe drinking water without chlorine in The Netherlands. Drink. Water Eng. Sci. 2009;2(1):1–14. [Google Scholar]
- 29.Tamrakar SB, Haas CN. Dose-response model for burkholderia pseudomallei (melioidosis) J. Appl. Microbiol. 2008a;105:1361–1371. doi: 10.1111/j.1365-2672.2008.03880.x. [DOI] [PubMed] [Google Scholar]
- 30.Tamrakar SB, Haas CN. Dose-response model for lassa virus. Hum. Ecol. Risk Assess. Int. J. 2008b;14(4):742–752. http://dx.doi.org/10.1080/10807030802235151. [Google Scholar]
- 31.Tamrakar SB, Haas CN. Dose-response model of rocky mountain spotted fever (RMSF) for human. Risk Anal. 2011;31(10):1610–1621. doi: 10.1111/j.1539-6924.2011.01604.x. http://dx.doi.org/10.1111/j.1539-6924.2011.01604.x. [DOI] [PubMed] [Google Scholar]
- 32.Teske SS, Huang Y, Tamrakar SB, Bartrand TA, Weir MH, Haas CN. Animal and human dose-response models for Brucella species. Risk Anal. 2011;31(10):1576–1596. doi: 10.1111/j.1539-6924.2011.01602.x. [DOI] [PubMed] [Google Scholar]
- 33.Teske SS, Weir MH, Bartrand TA, Huang Y, Tamrakar SB, Haas CN. Dose-response models incorporating aerosol size dependency for Francisella Tularensis. Risk Anal. 2014;34(5):911–928. doi: 10.1111/risa.12160. http://dx.doi.org/10.1111/risa.12160. [DOI] [PubMed] [Google Scholar]
- 34.US EPA. National Primary Drinking Water Regulations: Long Term 2 Enhanced Surface Water Treatment Rule. Federal Register; Washington DC, USA: 2000. [PubMed] [Google Scholar]
- 35.US EPA. Microbial Risk Assessment (MRA) Tools, Methods and Approaches for Water Media. US EPA Office of Water; Washington DC: 2014. EPA-820-R-14-009. [Google Scholar]
- 36.Watanabe T, Bartrand TA, Weir MH, Omura T, Haas CN. Development of a dose-response model for SARS coronavirus. Risk Anal. 2010;30(7):1129–1138. doi: 10.1111/j.1539-6924.2010.01427.x. http://dx.doi.org/10.1111/j.1539-6924.2010.01427.x. [DOI] [PMC free article] [PubMed] [Google Scholar]
- 37.Watanabe T, Bartrand TA, Omura T, Haas CN. Dose-response assessment for influenza a virus based on data sets of infection with its live attenuated reassortants. Risk Anal. 2012;32(3):555–565. doi: 10.1111/j.1539-6924.2011.01680.x. http://dx.doi.org/10.1111/j.1539-6924.2011.01680.x. [DOI] [PubMed] [Google Scholar]
- 38.Watanabe T, Teske SS, Haas CN. Classic dose-response and time post-inoculation models for leptospira. Risk Anal. 2014;34(3):465–484. doi: 10.1111/risa.12122. http://dx.doi.org/10.1111/risa.12122. [DOI] [PubMed] [Google Scholar]
- 39.Weir MH. Development of Physiologically Based Pathogen Transport and Kinetics Model for Inhalation of Bacillus Anthracis Spores. Drexel University; Philadelphia, PA: 2009. [Google Scholar]
- 40.Weir MH. Manual of Environmental Microbiology. fourth. ASM Press; 2016. Dose-response modeling and use: challenges and uncertainties in environmental exposure. 3.5.3e1e3.5.3e17. http://www.asmscience.org/content/book/10.1128/9781555818821. [Google Scholar]
- 41.Weir MH, Haas CN. Quantification of the effects of age on the dose response of Variola major in suckling mice. Hum. Ecol. Risk Assess. Int. J. 2009;15(6):1245–1256. http://dx.doi.org/10.1080/10807030903304906. [Google Scholar]
- 42.Weir MH, Haas CN. A model for in-vivo delivered dose estimation for inhaled Bacillus anthracis spores in humans with interspecies extrapolation. Environ. Sci. Technol. 2011;45(13):5828–5833. doi: 10.1021/es200901e. http://dx.doi.org/10.1021/es200901e. [DOI] [PubMed] [Google Scholar]
- 43.Weir MH, Razzollini MTP, Rose JB, Masago Y. Water reclamation redesign for reducing cryptosporidium risks at a recreational spray park using stochastic models. Water Res. 2011;45(19):6505–6514. doi: 10.1016/j.watres.2011.09.047. [DOI] [PubMed] [Google Scholar]
- 44.WHO, FSD. Risk Assessment of Listeria Monocytogenes in Ready-to-eat Foods. 2004 ftp://ftp.fao.org/docrep/fao/010/y5394e/y5394e.pdf.
- 45.WHO. Water Safety in Distribution Systems. 2014 http://www.who.int/water_sanitation_health/publications/Water_Safety_in_Distribution_System/en/
- 46.WHO. WHO | Quantitative Microbial Risk Assessment. 2016 http://www.who.int/water_sanitation_health/publications/qmra/en/


