Abstract
Alcoholic liver disease (ALD) is one of the leading causes of chronic liver disease. Recent studies have demonstrated the roles of long noncoding RNAs (lncRNAs) in the pathogenesis of several disease processes. However, the roles of lncRNAs in patients with ALD remain unexplored. Global profiling for human lncRNAs from peripheral blood RNA was performed in a well‐characterized cohort of healthy controls (HC; n = 4), excessive drinkers (ED) without liver disease (n = 4), and those with alcoholic cirrhosis (AC) with different severities (n = 12). The expression of unique lncRNA signatures were validated in a separate cohort of HC (n = 17), ED (n = 19), AC (n = 48), and human liver tissues with ALD (n = 19). A detailed analysis of plasma lncRNAs in AC subjects with different severities compared with HC identified 244 commonly up‐regulated lncRNAs and 181 commonly down‐regulated lncRNAs. We further validated top 20 most differentially up‐ and down‐regulated lncRNAs in ED and AC compared with HC and also determined the expression of selected lncRNAs in human liver tissues with or without AC. Among those lncRNAs, AK128652 and AK054921 were two of the most abundantly expressed lncRNAs in normal human plasma and liver, and their levels were significantly elevated in AC. The prognostic significance of AK128652 and AK054921 was determined in 48 subjects with AC who were followed prospectively for 520 days. The expression of AK128652 and AK054921 was inversely associated with survival in patients with AC. Conclusion: lncRNAs AK054921 and AK128652 are potential biomarkers to predict the progression to ALD in individuals with excessive alcohol consumption and are predictors of survival in patients with AC. (Hepatology Communications 2017;1:513–523)
Abbreviations
- AC
alcoholic cirrhosis
- ALD
alcoholic liver disease
- AUROC
area under the receiver operating curve
- ED
excessive drinkers
- FC
fold change
- HC
healthy controls
- INR
international normalized ratio
- lncRNA
long noncoding RNA
- MELD
Model for End‐Stage Liver Disease
- ncRNA
noncoding RNA
- PAPLA3
patatin‐like phospholipase domain‐containing protein 3
- qPCR
quantitative polymerase chain reaction
- VAMC
Veterans Administration Medical Center
Alcoholic liver disease (ALD), a major complication of excessive alcohol use, is one of the leading causes of chronic liver disease, with substantial morbidity and mortality.1 ALD consists of a spectrum of pathological changes ranging from alcoholic steatosis to fibrosis and cirrhosis.2 Alcohol‐induced steatosis occurs in most if not all patients who consume alcohol excessively, but can be reversed with abstinence.3 However, continued drinking can lead to alcoholic cirrhosis in up to 15%‐20% of excessive drinkers in their lifetime,4 suggesting that other factors in addition to alcohol drinking per se are likely involved in the pathogenesis as well as the disease progression.
The genetic components for susceptibility to ALD have been studied, including genes involving in alcohol metabolism,5 innate immune responses,6 oxidative stress,7 and lipid homeostasis.8 A variant in the patatin‐like phospholipase domain‐containing protein 3 (PNPLA3) gene (rs738409) has been found9 and confirmed10 to be associated with increased risk of ALD. Subjects with this variant were also at high risk for progression from clinically silent to clinically apparent ALD.11 Metabolomics also discovered major metabolites altered by alcohol in mouse models.12 Despite these discoveries, a large variability remains unexplained, suggesting that other nongenetic factors might be involved.
The new landscape of human transcriptome along with the identification of noncoding RNAs (ncRNAs) has uncovered their importance in the pathophysiology of human diseases.13 Long noncoding RNAs (lncRNAs) are a subgroup of ncRNAs with approximately 200 nucleotides14 and are often expressed at lower levels when compared with protein‐coding genes.15 lncRNA H19 was found to be highly induced during liver injury and was involved in cholestatic liver fibrosis.16 Metabolic derangements in fat cell metabolism and adipogenesis, commonly seen in excessive alcohol use subjects, are also under the regulation of lncRNAs.17 The lncRNA steroid receptor RNA activator promoted hepatic steatosis by repressing adipose triglyceride lipase.18 Nonetheless, studies on the roles of lncRNAs in human ALD remain unexplored.13
In this study, we hypothesized that specific lncRNAs are critical for the progression from excessive drinkers without underlying liver disease to ALD and that their unique role underpins the clinical observation on why only a subset of excessive drinkers develop ALD. To test this hypothesis, global profiling for human lncRNAs from peripheral blood RNA was performed in a well characterized cohort of healthy controls (HC), excessive drinkers (ED) without liver diseases, and those with alcohol‐induced cirrhosis (AC). We next determined the association of the unique sets of lncRNAs that were identified from peripheral blood with those in the livers from patients with ALD. Furthermore, we determined the prognostic significance of this unique lncRNA signature on the survival outcomes in patients with alcoholic cirrhosis.
Subjects and Methods
HUMAN SUBJECT COHORT
Healthy controls (HC), excessive drinkers without underlying liver disease (ED), and those with alcoholic cirrhosis (AC) were enrolled. Healthy controls were recruited from outpatient clinic at the Roudebush Veterans Administration Medical Center (VAMC), Indianapolis, Indiana. Excessive drinkers were recruited from Fairbanks Drug and Alcohol Treatment Center (Indianapolis, IN). They were at least 21 years old without underlying medical illnesses such as chronic obstructive pulmonary disease, congestive heart failure, diabetes, cancer, or chronic renal failure. These subjects had normal results for aspartate aminotransferase, alanine aminotransferase, total bilirubin, albumin, platelet count, and international normalized ratio (INR). Subjects with a history of jaundice or signs of end‐stage liver disease (e.g., ascites, hepatic encephalopathy, or variceal bleeding), history of chronic hepatitis B or C infection, history of any systemic infection within 4 weeks before the study were excluded.
Subjects with known diagnosis of AC who attended the liver clinic at the Roudebush VAMC or at Indiana University were recruited between October 2012 and March 2015. These patients had history of alcohol consumption averaging at least 80 g per day (for men) or 50 g per day (for women) for at least 10 years.19 This criterion is based on epidemiological evidence of the relationship between alcohol consumption and cirrhosis.20 The diagnosis of cirrhosis was made using radiographic imaging compatible with cirrhosis and/or history of ascites, grade 2 or higher hepatic encephalopathy and/or the presence of esophageal varices on upper gastrointestinal endoscopy, or biopsy‐proven cirrhosis, with exclusion of hepatitis B or C, autoimmune liver disease, hemochromatosis, and Wilson disease. Patients were followed prospectively until death, liver transplantation, or study closure date of July 31, 2016. The study was approved by the Institutional Review Board at the Indiana University Purdue University Indianapolis, Fairbanks Alcohol Rehabilitation Center, and Roudebush VAMC Research and Development Program. Written informed consent was obtained from each participant.
DATA AND BIOSAMPLE COLLECTION
At enrollment, baseline demographic data, clinical characteristics, and laboratory tests were obtained. Baseline Child‐Pugh and Model for End‐Stage Liver Disease (MELD) scores were calculated for subjects with AC. Subjects were then stratified into those with compensated (Child‐Pugh class A, AC1) and those with decompensated liver diseases (Child‐Pugh class B or C and AC2 or AC3, respectively). Peripheral blood was collected from venipuncture into the PAXgene Blood RNA tube (Qiagen, catalog #762165). The blood sample was gently inverted and stored at −80oC within 2 hours of collection.
HUMAN LIVER TISSUES
The human liver specimens from normal controls (n = 24) and subjects with AC (n = 19) were obtained through the Liver Tissue Cell Distribution System (Minneapolis, MN) funded by National Institutes of Health Contract # HSN276201200017C, as described previously.15, 16, 21, 22 The study was reviewed and approved by the University of Connecticut Institutional Review Board.
GLOBAL PROFILING OF HUMAN lncRNAs
Peripheral blood RNAs were extracted using a QIAamp RNA Blood Mini Kit (Qiagen, Hilden, Germany) according to the manufacturer's guidelines. Blood RNAs from HC (n = 4), ED without liver disease (n = 4), and AC (AC1 from Child‐Pugh class A, n = 4; AC2 from Child‐Pugh class B, n = 4; and AC3 from Child‐Pugh class C, n = 4) were subjected to global transcriptomic profiling using the Arraystar human lncRNA microarray version 3.0 (Arraystar, Rockville, MD). Quantitative polymerase chain reaction (qPCR) was used to validate the expression of the top 20 peripheral blood lncRNAs in a separate cohort of 17 HC, 19 ED, and 48 AC subjects as well as in the liver tissues from controls (n = 24) and subjects with AC (n = 19).
STATISTICAL ANALYSIS
Basic descriptive statistics, including mean, standard deviations (SD), and frequencies (percentages) were used. All the experiments were performed in triplicate and repeated at least two times. The data are presented as the mean ± standard error of the mean (SEM). Statistical analysis was performed using a Student t test for unpaired data to compare the values between the two groups and one‐way analysis of variance among multiple groups. P < 0.05 was considered statistically significant.
Survival analyses were performed to determine the prognostic significance of the selected lncRNAs and the outcomes in subjects with AC (n = 48). We examined the distributions of all variables, and those with skewed distributions were logarithmically transformed. We examined the time to mortality using a survival analysis. Individuals who did not die during the study follow‐up were considered censored at the end of the observation window. Kaplan‐Meier curves were used to estimate the distributions of the survival time in different groups. Cox regression models were used to assess the effects of independent variables. Univariate analyses were first conducted to explore the association between individual predictors and the survival outcome. Log‐rank tests were used for categorical predictors and Wald tests were used for continuous predictors. All the main effects and two‐way interactions were included in the initial proportional hazard model. The final model was achieved by eliminating the variables with significance level exceeding 0.05 in a stepwise fashion. Risk scores for individual patients were calculated by using the patient characteristics and parameter estimates from final model. Harrell's C statistic/generalized receiver operating curve area was used to examine the prognostic accuracy of these markers in the predication model, in comparison with the MELD score.
We validated the proposed scoring method using a bootstrap procedure by randomly selecting 80% of subjects and repeating the model 1000 times. Finally, we used logistic regression models to predict the probability of death within 3, 6, and 12 months using the newly derived score. Areas under the receiver operating curve (AUROCs) were reported to quantify the capacities of discrimination of the new score and the MELD score. For these analyses, deaths within 3, 6, and 12 months were recorded as events. All the statistical analyses were conducted using R version 3.2.4. P < 0.05 was used as the significance level.
Results
TRANSCRIPTOMICS IDENTIFICATION OF DIFFERENTIALLY EXPRESSED PERIPHERAL BLOOD lncRNAs IN HC, ED, AND AC WITH DIFFERENT SEVERITIES
The Arraystar Human LncRNA Microarray version 3.0 was used for the global profiling of human lncRNAs (∼30,600 lncRNAs). For the exploration phase, 20 human peripheral blood RNA samples from five groups (HC, ED, AC1, AC2, AC3, n = 4/group) were analyzed. This high throughput analysis identified significantly differentially expressed lncRNAs. Importantly, unique lncRNA signature changes occurred from HC to ED (Fig. 1A). In addition, more differentially expressed lncRNAs were observed in AC3 versus HC or ED compared with AC2 or AC1 versus HC or ED (Fig. 1A). We also observed that the numbers of differentially expressed peripheral blood lncRNAs were significantly increased in AC3 versus AC1 compared with AC2 versus AC1 (Fig. 1B), suggesting that they were more pronounced once the disease severity worsened.
Figure 1.
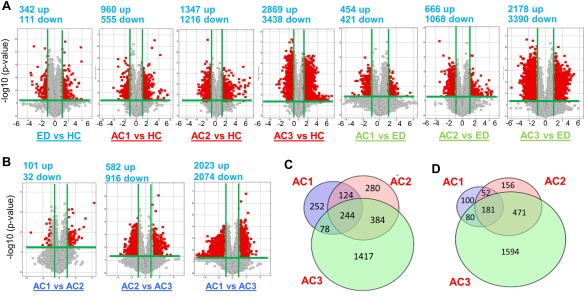
Volcano plot displaying differentially expressed plasma lncRNAs in three study cohorts of human AC. (A,B) The log2 ratio (x axis) and −log10 adjusted P values (y axis) were plotted in the form of volcano plots for excessive drinkers (ED) versus healthy controls (HC), alcoholic cirrhosis (AC) versus HC, and AC versus ED comparisons. Red color represents significantly up‐regulated (right) and down‐regulated (left) lncRNAs, respectively (FC < 2 or > 2 and adjusted P < 0.05). Gray color represents the significant with small fold change (above the green line) (FC < 1.5 or > 1.5) and the nonsignificant change (below the green line). Total RNAs from 20 human blood samples (n = 4 per group) were analyzed by Arraystar Human LncRNA Microarray version 3.0. AC1 = Child‐Pugh class A, AC2 = Child‐Pugh class B, AC3 = Child‐Pugh class C. (C,D) Venn diagrams showing total numbers and overlapping up‐regulated (C) and down‐regulated (D) lncRNAs between AC1, AC2, and AC3.
Detailed analysis of these lncRNAs in different Child‐Pugh classes compared with HC identified 244 commonly up‐regulated lncRNAs (Fig. 1C) and 181 commonly down‐regulated lncRNAs (Fig. 1D) in AC1, AC2, and AC3. In addition, the number of uniquely up‐regulated lncRNAs were increased from 252 (in AC1) to 1417 (in AC3, Fig. 1C), whereas the number of uniquely down‐regulated lncRNAs increased from 100 (in AC1) to 1594 (in AC3, Fig. 1D).
We aimed to discover specific sets of lncRNA signatures across the spectrum of the three cohorts and, more importantly, during the progression from ED to AC. The differential expression of these lncRNAs in AC patients with different severities based on Child‐Pugh classification (AC1, AC2, and AC3) was expected to be distinctive. Based on the microarray data, the 20 most differentially up‐regulated (Supporting Fig. 1) and down‐regulated (Supporting Fig. 2) lncRNAs were observed in ED, AC1, AC2, and AC3 compared with HC. The identification of these uniquely regulated lncRNAs that are distinct in AC patients may have the potential to serve as noninvasive diagnostic markers for a subset of subjects with excessive alcohol use who develop ALD or cirrhosis.
VALIDATION OF PERIPHERAL BLOOD lncRNAs EXPRESSION
Although microarray is a powerful tool allowing the examination of the expression of thousands of lncRNAs simultaneously, one technical limitation is that false microarray data can be generated from degraded mRNA. In addition, interindividual variations in gene expression must not be ignored.
To validate the expression of lncRNAs, we selected potential targets with a false discovery rate < 0.05, raw intensity higher than 500, and fold change > 2 or < 2 (FC > 2 or < 2) in each group. Using these criteria, we identified 19 lncRNAs, which are provided in Supporting Table 1. The validation was performed in a separate cohort of 17 HC, 19 ED, and 48 AC (Supporting Table 2) using qPCR. Among the 19 lncRNAs we analyzed, only a few showed expression patterns similar to the microarray data. The ED up‐regulated RP11‐178F10.2 (Fig. 2A) and AC1 up‐regulated FTX (Fig. 2B) were most highly expressed in AC2, whereas ANP32A‐IT1 showed no significance in all groups (data not shown). The AC3 up‐regulated RP11‐549B18.2 and XLOC_003832 were both highly elevated in AC2 (Fig. 2C). Among AC3 down‐regulated lncRNAs, LOC100233156 showed a constant and progressive down‐regulation from ED to AC, with the lowest expression in AC3 (Fig. 2D). In contrast, AK128652 was highly elevated in AC2, whereas AC093642.3 showed no changes in all groups (Fig. 2D). Among commonly up‐regulated lncRNAs, AC004854.4 and XLOC_010595 were induced in AC2, whereas CTC‐297N7.5 showed a tendency of induction in AC3 (Fig. 2E). It was noted that the expression pattern of the validated lncRNAs in each group differed from the microarray data. This was likely attributed to the heterogeneity of the samples used for microarray analysis (four samples per group) and those used for qPCR analysis. Nonetheless, several lncRNAs were identified to be highly elevated in AC2. The list of primers used for qPCR analysis is provided in Supporting Table 3.
Figure 2.
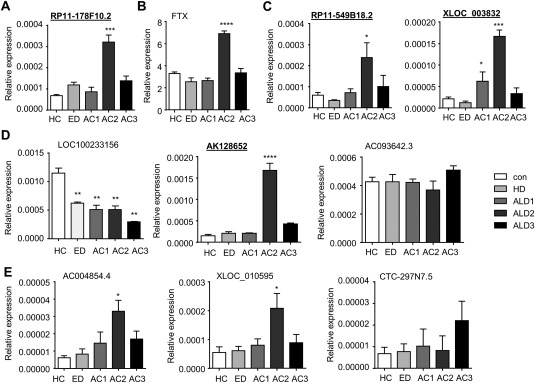
Validation of plasma lncRNA expression changes in AC patients based on false discovery rate and raw intensity gating. (A‐D) qPCR of plasma lncRNAs RP11‐178F10.2 (A); FTX (B); RP11‐549B18.2 and XLOC_003832 (C); LOC100233156, AK128652, and AC093642.3 (D); and AC004854.4, XLOC_010595, and CTC‐297N7.5 (E) from HC, ED, AC1, AC2, and AC3. Total RNAs were isolated from 10 new human plasma samples from each group. Data are expressed as the mean ± standard error of the mean (triplicate assays). *P < 0.05, **P < 0.01, ***P < 0.005, ****P < 0.001 versus HC.
To expand the validation to more lncRNAs, we selected the ones with FC > 2 or < 2 and adjusted P < .05. RP11‐605F22.2 and XLOC_010517 were both markedly down‐regulated in ED and AC (Fig. 3A). BX247990 was similarly induced in both AC1 and AC2, whereas AK054921 levels were similarly increased in AC2 and AC3 (Fig. 3B). RP11‐367J11.3, XLOC_007914, and XLOC_004372 showed a progressive induction in AC2 versus AC1 (Fig. 3C). Interestingly, AC005324.6 expression was reduced in ED and AC3 but remained unchanged in AC1 and AC2 when compared with HC (Fig. 3D).
Figure 3.
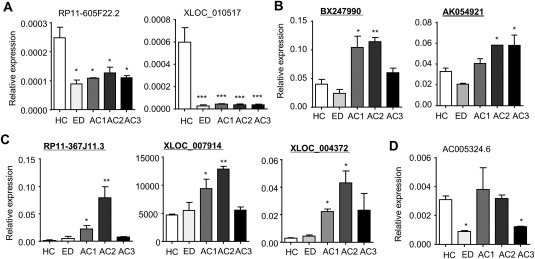
Validation of plasma lncRNAs expression changes in AC patients based on FC and P value gating. (A‐D) qPCR of plasma lncRNAs RP11‐605F22.2 and XLOC_010517 (A); BX247990 and AK054921 (B); RP11‐367J11.3, XLOC_007914, and XLOC_004372 (C); and AC005324.6 (D) from HC, ED, AC1, AC2, and AC3. Total RNAs were isolated from 10 new human plasma samples from each group. Data are expressed as the mean ± standard error of the mean (triplicate assays). *P < 0.05, **P < 0.01, ***P < 0.005 versus HC.
IDENTIFYING SIMILARLY ACTIVATED lncRNAs IN PERIPHERAL BLOOD AND LIVER
Thus far, all the lncRNAs were validated independently using individual qPCR. To have a better understanding and comparison about the relative abundance of each lncRNA, we selected nine lncRNAs (underlined in bold in Figs. 2 and 3) and examined their basal levels simultaneously in 17 HC samples. XLOC_007914 was the most highly expressed lncRNA in human peripheral blood, followed by AK128652, AK054921, and BX247990 (Fig. 4A).
Figure 4.
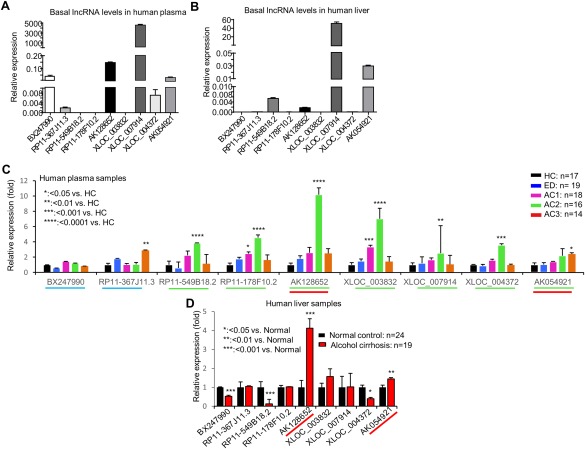
Identifying commonly elevated lncRNAs in plasma and liver of human liver diseases. (A,B) Basal expression of lncRNAs in human plasma from normal controls (n = 17) (A) and in human liver from normal controls (n = 24) (B). Data are expressed as the mean ± standard error of the mean (triplicate assays). (C) qPCR of plasma lncRNAs from HC (n = 17), ED (n = 19), AC1 (n = 18), AC2 (n = 16), and AC3 (n = 14). Data are expressed as FC with HC set as 1. *P < 0.05, **P < 0.01, ***P < 0.005, ****P < 0.001 versus HC. (D) qPCR of hepatic lncRNAs from human liver specimens for normal controls (n = 24) and individuals with AC (n = 19). Data are expressed as FC with normal controls set as 1. *P < 0.05, **P < 0.01, *** P < 0.005 versus HC. *P < 0.05, **P < 0.01, *** P < 0.005, **** P < 0.001 versus normal.
The liver is one of the major organs that is affected by alcohol‐induced tissue injury. To determine whether the differentially expressed lncRNAs from the peripheral blood also occur in the liver tissues, we examined the levels of the same sets of lncRNAs in 24 normal human liver specimens. XLOC_007914 again showed the highest expression in human livers, followed by AK054921, RP11‐178F10.2, and AK128652 (Fig. 4B). The results suggest that the identified peripheral blood lncRNAs could represent the lncRNAs that are secreted from the liver.
To further confirm the expression of those nine lncRNAs (Fig. 4A), we determined their levels in the blood samples of 19 ED and 48 AC with different severity using qPCR, and the results were presented as fold change versus HC for a better comparison. lncRNAs BX247990 and RP11‐367J11.3 (blue underline) exhibited a different expression pattern (Fig. 4C) compared with the prior analyses (Fig. 3B,C), likely reflecting individual sample variations. Seven lncRNAs (green underline) showed similar expression changes compared with previous results (Figs. 2 and 3). Among them, AK128652 displayed the highest induction in AC2, followed by XLOC_003832, RP11‐178F10.2, and RP11‐549B18.2. Unlike other lncRNAs for which levels were highly elevated in AC2 but declined in AC3, AK054921 remained at an approximately 2‐fold increase in AC3.
To establish the potential correlation with human liver diseases, we examined the expression of the nine lncRNAs in human liver specimens, including normal control (n = 24) and AC (n = 19). AK128652 exhibited the highest induction in AC (approximately 5‐fold) followed by AK054921 approximately 2‐fold) (Fig. 4D).
PROGNOSTIC SIGNIFICANCE OF lncRNAs AND SURVIVAL IN PATIENTS WITH ALCOHOLIC CIRRHOSIS
Our goal was to identify lncRNAs that were expressed at relatively high levels in human peripheral blood as well as in the liver of patients with AC. From the results shown in Fig. 4C and 4D, both AK128652 and AK054921 (red underline) met our selection criteria for further analysis. The expression of AK128652 and AK054921 levels in each sample of subjects with HC, ED, AC1, AC2, and AC3 was shown in Figure 5. As expected, the level of AK128652 was highest in the samples of AC2 patients and the levels of AK054921 showed progressive increased in the samples of AC patients with different severity (Fig. 5A).
Figure 5.
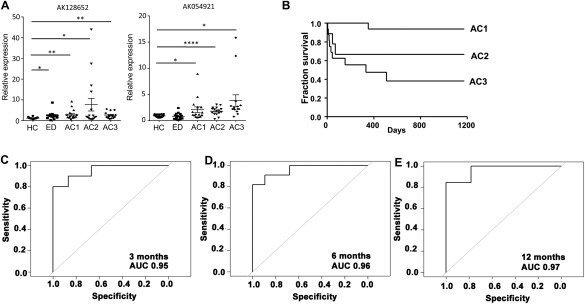
AK128652 and AK054921 expression association with patient survival. (A) qPCR of plasma lncRNAs AK128652 and AK054921 expression in new cohorts of individual samples from HC, ED, AC1, AC2, and AC3. Each dot represents an individual sample. Total RNAs were isolated from human plasma. Data are expressed as the mean ± standard error of the mean (triplicate assays) and as FC with average of HC set as 1. *P < 0.05, **P < 0.01, ***P < 0.005, ****P < 0.001 versus HC. (B) Survival curve of AC subjects with different severity. (C‐E) Harrell's C statistic in predicting survival at 3, 6, and 12 months in patients with AC using the risk score calculation including AK128652 and AK054921 expression.
We next determined the prognostic significance of these two lncRNAs in the cohort of 48 subjects with AC. During the median follow‐up of 520 days, 34% of patients died. The median survival was 3.4 years. The overall survival for subjects with different disease severity is shown in Figure 5B. The survival rates at 3 months, 6 months, and 1 year were 77%, 75%, and 69%, respectively. We found that logarithmic transformed AK054921 and AK128652, i.e., logeAK054921 and logeAK128652, were significantly associated with the survival time through interaction terms (Supporting Table 4).
Using the estimated regression coefficients in the linear predictors of the proportional hazard model, we calculated a risk score based on the variables that were in MELD, in addition to the expression levels of AK054921 and AK128652: 3.5 × logeINR +15.0 × logebilirubin −8.1 × logecreatinine +1.3 × logeAK054921 + 3.6 × logeAK128652 + 2.9 × logeXLOC_003832+2.1 × logebilirubin × logeAK054921 − 2.4 × logebilirubin × logeAK128652 −2.6 × logebilirubin × logeXLOC_003832+1.3 × logecreatinine ×logeXLOC_003832+3.3 × logecreatinine × logeAK128652 This score corresponded to the chance of survival of an individual patient given his or her values of the predictive markers. The Harrell's C statistic for this selected model was 93.6%, which was higher than that of MELD (C statistic of 82.4%).
Using a bootstrap procedure for validation, we found that that the average value of the C‐statistic of the new predictive score was 93.6% with a standard deviation of 1.9%. Using this model, we found that AUROC in predicting mortality at 3, 6, and 12 months was 95.3%, 96.1%, and 96.7%, respectively (Fig. 5C‐E). Our results indicate that both AK054921 and AK128652 not only represent the unique lncRNAs, which may play roles in the pathogenesis of ALD, but also have the prognostic significance on the survival.
Discussion
LncRNAs have been shown to regulate gene function at a transcriptional and posttranscriptional level.23 They also play a role in epigenetic regulation of the DNA.24 Over the past few years, significant advancements have been made in identifying the critical roles of lncRNAs in the disease processes.13, 14, 17, 25, 26, 27, 28 Furthermore, levels of lncRNA expression have been investigated as disease biomarkers, either for diagnostic or prognostic purposes. For instance, the levels of differentiation antagonizing nonprotein coding RNA may be useful in diagnosis of hepatocellular carcinoma.29 The lncRNA metastasis‐associated lung adenocarcinoma transcript 1 was found to be a good predictor for hepatocellular carcinoma recurrence after liver transplantation.30 lncRNA 16 (ENST00000539303) and Sox2 overlapping transcript have been associated with prognosis in patients with lung and gastric cancers, respectively.31, 32
Excessive alcohol consumption has an effect on several organ systems. In the liver, excessive alcohol use can lead to a broad spectrum of liver disorders, ranging from simple steatosis to severe forms of liver injury, including steatohepatitis, fibrosis/cirrhosis, and hepatocellular carcinoma.2 The underlying mechanisms of alcohol‐induced liver injury are complex, involving the derangement in hepatic lipid metabolism, innate immune responses, and epigenetic regulation33, 34, 35; all of these processes are also under control by lncRNAs.17, 24, 26 Interestingly, only a subset of subjects with excessive alcohol use develops ALD. Given that lncRNAs have been involved in several pathways associated with the pathogenesis of ALD, we hypothesized that excessive alcohol drinking results in the alterations of hepatic lncRNAs. These distinct lncRNAs are secreted into the circulation and can be detected in the peripheral blood upon hepatocyte injury. lncRNAs that are unique to ED or individuals with AC, or common to ED and AC but with a progressive change in expression with disease severity could be used as the biomarkers to predict disease progression and clinical outcomes. To the best of our knowledge, our study is the first to comprehensively analyze and establish lncRNA signatures in the peripheral blood to differentiate HC, ED without liver disease, and individuals with AC. The common lncRNA signatures that were identified in the peripheral blood were also confirmed in the liver tissues from subjects with AC.
Our results showed the lncRNA signature that is unique in ED versus HC but not in AC. This ED signature is likely served as a signature that differentiates ED from HC and AC and may not be involved in the progression from ED to AC. When we compared the lncRNA signatures between ED and AC groups, we found substantial numbers of lncRNAs that are common in ED and AC but absent in HC. We postulated that these lncRNA signatures are likely regulated by alcohol and may contribute to ALD progression. The schematic diagram demonstrating the overall results of our study is shown in Figure 6. Using the selection criteria as defined above and after the validation both from peripheral blood as well as liver tissues, we found that lncRNAs AK128652 and AK054921 are associated with the progression from ED to AC. Not only were the levels of expression of these 2 lncRNAs parallel with the severity of AC, they were also inversely associated with long‐term survival in these patients. It is important to note that the function of these two lncRNAs are not known; as such, further in vitro and in vivo experiments should be undertaken to explore the molecular mechanism of these two lncRNAs in the pathogenesis of ALD.
Figure 6.
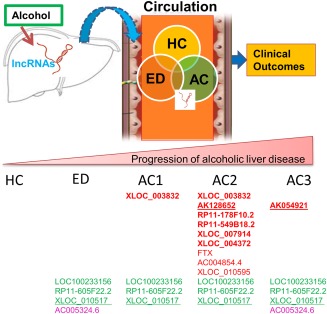
Schematic showing the major findings of the study. Specific hepatic lncRNAs are altered (up‐ or down‐regulated) by chronic alcohol consumption. They are secreted (through mechanisms as yet undefined) into the circulation. The levels of lncRNAs in blood are associated with liver disease stages, and their changes represent the liver lncRNA signatures altered by alcohol‐induced liver injury. These lncRNAs may serve as serum biomarkers and can be used to predict ALD progression. Red: up‐regulated; green: down‐regulated; red underline: associated with patient survival; green underline: most significantly down‐regulated.
In conclusion, our exploratory study demonstrated that lncRNAs AK054921 and AK128652 are potential biomarkers to predict the progression to ALD in individuals with excessive alcohol consumption and are predictors of survival with patients with AC.
Supporting information
Additional Supporting Information may be found at onlinelibrary.wiley.com/doi/10.1002/hep4.1061/suppinfo
Supporting Information Figure 1.
Supporting Information Figure 2.
Supporting Information
Potential conflict of interest: Nothing to report.
This study was supported by VA Merit Award 1I01BX002634 and National Institutes of Health (NIH) grants R21AA022482, R01DK080440, R01DK104656, R01ES025909, R21CA191507, and P30 DK34989 (to L.W.); VA Merit Award 1I01CX000361 and NIH grants U01AA021840, R01 DK107682, R01 AA025208, and US DOD W81XWH‐12‐1‐0497 (to S.L.); and NIH grant R21AA024935‐01 (to L.W. and S.L.).
Contributor Information
Suthat Liangpunsakul, Email: sliangpu@iu.edu.
Li Wang, Email: li.wang@uconn.edu.
REFERENCES
- 1. Rehm J, Samokhvalov AV, Shield KD. Global burden of alcoholic liver diseases. J Hepatol 2013;59:160‐168. [DOI] [PubMed] [Google Scholar]
- 2. Liangpunsakul S, Haber P, McCaughan GW. Alcoholic liver disease in Asia, Europe, and North America. Gastroenterology 2016;150:1786‐1797. [DOI] [PMC free article] [PubMed] [Google Scholar]
- 3. Lieber CS, Jones DP, Decarli LM. Effects of prolonged ethanol intake: production of fatty liver despite adequate diets. J Clin Invest 1965;44:1009‐1021. [DOI] [PMC free article] [PubMed] [Google Scholar]
- 4. Mills SJ, Harrison SA. Comparison of the natural history of alcoholic and nonalcoholic fatty liver disease. Curr Gastroenterol Rep 2005;7:32‐36. [DOI] [PubMed] [Google Scholar]
- 5. Li TK. Quantifying the risk for alcohol‐use and alcohol‐attributable health disorders: present findings and future research needs. J. Gastroenterol Hepatol 2008;23(Suppl 1):S2‐S8. [DOI] [PubMed] [Google Scholar]
- 6. Järveläinen HA, Orpana A, Perola M, Savolainen VT, Karhunen PJ, Lindros KO. Promoter polymorphism of the CD14 endotoxin receptor gene as a risk factor for alcoholic liver disease. Hepatology 2001;33:1148‐1153. [DOI] [PubMed] [Google Scholar]
- 7. Watanabe J, Hayashi S, Kawajiri K. Different regulation and expression of the human CYP2E1 gene due to the RsaI polymorphism in the 5′‐flanking region. J Biochem 1994;116:321‐326. [DOI] [PubMed] [Google Scholar]
- 8. Yang Z, Tsuchiya H, Zhang Y, Lee S, Liu C, Huang Y, et al. REV‐ERBα activates C/EBP homologous protein to control small heterodimer partner‐mediated oscillation of alcoholic fatty liver. Am J Pathol 2016;186:2909‐2920. [DOI] [PMC free article] [PubMed] [Google Scholar]
- 9. Romeo S, Kozlitina J, Xing C, Pertsemlidis A, Cox D, Pennacchio LA, et al. Genetic variation in PNPLA3 confers susceptibility to nonalcoholic fatty liver disease. Nat Genet 2008;40:1461‐1465. [DOI] [PMC free article] [PubMed] [Google Scholar]
- 10. Tian C, Stokowski RP, Kershenobich D, Ballinger DG, Hinds DA. Variant in PNPLA3 is associated with alcoholic liver disease. Nat Genet 2010;42:21‐23. [DOI] [PubMed] [Google Scholar]
- 11. Stickel F, Buch S, Lau K, Meyer zu Schwabedissen H, Berg T, Ridinger M, et al. Genetic variation in the PNPLA3 gene is associated with alcoholic liver injury in Caucasians. Hepatology 2011;53:86‐95. [DOI] [PubMed] [Google Scholar]
- 12. Tran M, Yang Z, Liangpunsakul S, Wang L. Metabolomics analysis revealed distinct cyclic changes of metabolites altered by chronic ethanol‐plus‐binge and Shp deficiency. Alcohol Clin Exp Res 2016;40:2548‐2556. [DOI] [PMC free article] [PubMed] [Google Scholar]
- 13. Szabo G, Bala S. MicroRNAs in liver disease. Nat Rev Gastroenterol Hepatol 2013;10:542‐552. [DOI] [PMC free article] [PubMed] [Google Scholar]
- 14. Takahashi K, Yan I, Haga H, Patel T. Long noncoding RNA in liver diseases. Hepatology 2014;60:744‐753. [DOI] [PMC free article] [PubMed] [Google Scholar]
- 15. Zhang L, Yang Z, Trottier J, Barbier O, Want L. LncRNA MEG3 induces cholestatic liver injury by interaction with PTBP1 to facilitate Shp mRNA decay. Hepatology 2017;65:604‐615. [DOI] [PMC free article] [PubMed] [Google Scholar]
- 16. Zhang Y, Liu C, Barbier O, Smalling R, Tsuchiya H, Lee S et al. Bcl2 is a critical regulator of bile acid homeostasis by dictating Shp and lncRNA H19 function. Sci Rep 2016;6:20559. [DOI] [PMC free article] [PubMed] [Google Scholar]
- 17. Chen Z. Progress and prospects of long noncoding RNAs in lipid homeostasis. Mol Metab 2016;5:164‐170. [DOI] [PMC free article] [PubMed] [Google Scholar]
- 18. Chen G, Yu D, Nian X, Liu J, Koenig RJ, Xu B, et al. LncRNA SRA promotes hepatic steatosis through repressing the expression of adipose triglyceride lipase (ATGL). Sci Rep 2016;6:35531. [DOI] [PMC free article] [PubMed] [Google Scholar]
- 19. Whitfield JB, Rahman K, Haber PS, Day CP, Masson S, Daly AK, et al. Brief report: genetics of alcoholic cirrhosis‐GenomALC multinational study. Alcohol Clin Exp Res 2015;39:836‐842. [DOI] [PMC free article] [PubMed] [Google Scholar]
- 20. Cutright P, Fernquist RM. Predictors of per capita alcohol consumption and gender‐specific liver cirrhosis mortality rates: thirteen European countries, circa 1970‐1984 and 1995‐2007. Omega (Westport) 2010;62:269‐283. [DOI] [PubMed] [Google Scholar]
- 21. Zhang Y, Xu N, Xu J, Kong B, Copple B, Guo GL, et al. E2F1 is a novel fibrogenic gene that regulates cholestatic liver fibrosis through the Egr‐1/SHP/EID1 network. Hepatology 2014;60:919‐930. [DOI] [PMC free article] [PubMed] [Google Scholar]
- 22. Smalling RL, Delker DA, Zhang Y, Nieto N, McGuiness MS, Liu S, et al. Genome‐wide transcriptome analysis identifies novel gene signatures implicated in human chronic liver disease. Am J Physiol Gastrointest Liver Physiol 2013;305:G364‐G374. [DOI] [PMC free article] [PubMed] [Google Scholar]
- 23. Vance KW, Ponting CP. Transcriptional regulatory functions of nuclear long noncoding RNAs. Trends Genet 2014;30:348‐355. [DOI] [PMC free article] [PubMed] [Google Scholar]
- 24. Cao J. The functional role of long non‐coding RNAs and epigenetics. Biol Proced Online 2014;16:11. [DOI] [PMC free article] [PubMed] [Google Scholar]
- 25. Li SY, Susztak K. The long noncoding RNA Tug1 connects metabolic changes with kidney disease in podocytes. J Clin Invest 2016;126:4072‐4075. [DOI] [PMC free article] [PubMed] [Google Scholar]
- 26. Caputa G, Schaffer JE. RNA Regulation of lipotoxicity and metabolic stress. Diabetes 2016;65:1816‐1823. [DOI] [PMC free article] [PubMed] [Google Scholar]
- 27. Reddy MA, Chen Z, Park JT, Wang M, Lanting L, Zhang Q, et al. Regulation of inflammatory phenotype in macrophages by a diabetes‐induced long noncoding RNA. Diabetes 2014;63:4249‐4261. [DOI] [PMC free article] [PubMed] [Google Scholar]
- 28. Song Y, Liu C, Liu X, Trottier J, Beaudoin M, Zhang L, et al. H19 promotes cholestatic liver fibrosis by preventing ZEB1‐mediated inhibition of EpCAM. Hepatology 2017; doi: 10.1002/hep.29209. [DOI] [PMC free article] [PubMed] [Google Scholar]
- 29. Ma X, Wang X, Yang C, Wang Z, Han B, Wu L, et al. DANCR Acts as a diagnostic biomarker and promotes tumor growth and metastasis in hepatocellular carcinoma. Anticancer Res 2016;36:6389‐6398. [DOI] [PubMed] [Google Scholar]
- 30. Lai MC, Yang Z, Zhou L, Zhu QQ, Xie HY, Zhang F, et al. Long non‐coding RNA MALAT‐1 overexpression predicts tumor recurrence of hepatocellular carcinoma after liver transplantation. Med Oncol 2012;29:1810‐1816. [DOI] [PubMed] [Google Scholar]
- 31. Zhu H, Zhang L, Yan S, Li W, Cui J, Zhu M, et al. LncRNA16 is a potential biomarker for diagnosis of early‐stage lung cancer that promotes cell proliferation by regulating the cell cycle. Oncotarget 2017;8:7867‐7877. [DOI] [PMC free article] [PubMed] [Google Scholar]
- 32. Zhang Y, Yang R, Lian J, Xu H. LncRNA Sox2ot overexpression serves as a poor prognostic biomarker in gastric cancer. Am J Transl Res 2016;8:5035‐5043. [PMC free article] [PubMed] [Google Scholar]
- 33. Gao B. Basic liver immunology. Cell Mol Immunol 2016;13:265‐266. [DOI] [PMC free article] [PubMed] [Google Scholar]
- 34. Wang M, You Q, Lor K, Chen F, Gao B, Ju C. Chronic alcohol ingestion modulates hepatic macrophage populations and functions in mice. J Leukoc Biol 2014;96:657‐665. [DOI] [PMC free article] [PubMed] [Google Scholar]
- 35. Gao B, Bataller R. Alcoholic liver disease: pathogenesis and new therapeutic targets. Gastroenterology 2011;141:1572‐1585. [DOI] [PMC free article] [PubMed] [Google Scholar]
Associated Data
This section collects any data citations, data availability statements, or supplementary materials included in this article.
Supplementary Materials
Additional Supporting Information may be found at onlinelibrary.wiley.com/doi/10.1002/hep4.1061/suppinfo
Supporting Information Figure 1.
Supporting Information Figure 2.
Supporting Information


