Abstract
kidney ischemia-reperfusion (I/R) accounts for the majority of acute kidney injury cases, whose consequences are commonly encountered after kidney transplantation. Optical coherence tomography (OCT) has been applied to image changes in kidney microanatomy and microcirculation. In this paper, we demonstrate a quantitative method for monitoring kidney status during ischemia-reperfusion process using texture properties of OCT images. This approach employs skewness to measure the distribution of en face OCT image intensities at different depths, thus allowing differentiating ischemia-reperfusion status of kidney. The skewness analysis based on quantitative intensity shows promise for monitoring kidney status during ischemia-reperfusion, and the potential for evaluating the viability of transplant kidney.
Index terms: optical coherence tomography, image analysis
1. Introduction
Optical coherence tomography (OCT) [1–2] is an established modality for non-invasive assessment of diseases. As a result, OCT image analysis is becoming increasingly important. Texture analysis has been actively investigated for tissue characterization [3–6]. The potential of texture analysis has been demonstrated in numerous biomedical applications, including OCT imaging of skin [7], bladder [8], eye [9], atherosclerotic plaque [10], esophagus [11], and breast [12]. In general, texture analysis techniques can be classified into three groups: statistical technologies [3–10], spectral technologies [11, 12], and structural technologies [13]. The choice of optimal method for texture analysis may vary depending on the specific biomedical applications.
OCT and its functional extension (Doppler OCT [14] and optical microangiography, OMAG [15]) have been used for imaging kidney microanatomy [16, 17] and microcirculation [18, 19]. OCT can resolve renal corpuscles and uriniferous tubules [16]. The morphological changes in these structures are associated with ischemia-reperfusion injury [17]. Automatic algorithm for image analysis algorithm has been developed previously for quantifying spatially-resolved tubular diameter as a potential biomarker for indicating viability of the transplant kidney [17, 20]. In these previous studies, the tubular lumens were segmented out from cross-sectional OCT images of kidney microstructure based on an empirically-determined intensity threshold [16–18]. However, as OCT intensity is attenuated with depth, segmentation of deeper tubular lumens based on one fixed threshold becomes challenging.
Previous studies have demonstrated that dramatic shrinkage of tubular lumens occurs during ischemia due to the swelling of tubular epithelial cells, and tubular lumens gradually recover after reestablishment of blood flow [17]. The overall goal of this study is to develop a simple and effective texture analysis method for OCT to monitor renal morphological changes associated with ischemia-reperfusion injury. The proposed method is based on regional histograms of intensity distribution of en face OCT images. In this study, we investigate the feasibility of using skewness [21] to measure asymmetry of the histogram distribution of en face OCT intensity. Significant differences in the size of hollow structures in the kidney (including renal tubules and glomeruli) were observed during ischemia-reperfusion process. Histogram statistical analysis is shown to be a promising method to provide a reliable indication of tubular swelling due to ischemic insults.
2. Materials and methods
All animal experiments were performed in compliance with the National Institutes of Health Guide for the Care and Use of Laboratory Animals (NIH Publication No. 80-23) and the protocol was approved by the Institutional Animal Care and Use Committee of the University of Maryland, College Park campus.
2.1 Samples
In vivo OCT imaging was performed on Munich-Wistar rats (n=3). Each rat (weighing 300–350 g) was anesthetized with isoflurane/O2 (4% induction, 1.5% during operation, O2 1L/min). The abdominal cavity was opened through a midline incision. The left kidney was exposed through laparotomy of the left flank region and the kidney was securely placed in a Lucite holder to minimize imaging artifacts due to respiratory movement [17, 18]. The animal was then placed under the OCT microscope with left kidney beneath the objective for in vivo imaging. During the experiments, we tried to make the ROI surface as flat as possible to reduce the de-focused effect. Renal ischemia was induced by applying a tension on the silk loop to occlude both renal artery and vein. After 30 minutes, the silk loop was released to allow for renal reperfusion [17]. 3D volumetric data at different time points (before clamping, 5-min after clamping, 30-min after clamping, 10-min after reperfusion, and 30-min after reperfusion) were captured.
2.2. Optical coherence tomography
A high-speed, high-resolution swept-source OCT (SS-OCT) system was used in this study. The details of the SS-OCT system have been described previously [17, 18, 22–24]. Briefly, the system utilized a swept-source laser centered at 1310 nm with 100 nm bandwidth, yielding an axial resolution of ~10 µm in tissue. A 10× objective (LSM02, Thorlabs, Inc.; effective focal length 18 mm, working distance 7.5 mm) was used in the sample arm. The output power is ~4.5 mW on the sample. The light source operated at a sweep rate of 16 kHz, allowing a series of two-dimensional cross-sectional images to be captured in real time to form a three-dimensional (3D) data set (1.2 mm [X] × 0.6 mm [Y] × 1 mm [Z]). For each animal, the OCT images were obtained from 3–5 locations of each kidney.
2.3. Skewness
Skewness is a measure of asymmetry of a histogram distribution [25], which indicates the balance between the positive and negative tails. A negative value of skewness indicates that the left tail is longer and the mass of the distribution is concentrated on the right side of the histogram. On the contrary, a positive value of skewness indicates that the right tail is longer and the mass of the distribution is concentrated on the left side of the histogram.
Histogram H of a gray image can be described as:
where N and ni are the number of pixels for the entire image size m×n and for different gray level, respectively, and L is maximum gray level (255). The skewness of the histogram is defined as [18]:
where μ and σ are mean and standard deviation of intensity of the gray image, respectively, with .
As hollow structures in the kidney (including tubular lumens and glomeruli) appear to be low gray level (low backscattering) in OCT image, they contribute to the left tail of OCT image histogram. During kidney ischemia-reperfusion, the lumens of renal tubules gradually close and then gradually open, and histograms of the images change accordingly. However, as OCT signal intensity attenuates with depth, signals from deeper parenchyma also contribute more to low gray level region of the histogram, which confounds with the contribution from tubular lumens. Thus, we analyze OCT intensity in a depth-dependent way as described below.
As kidney surface is uneven, a pre-processing algorithm was first used to identify the boundary between air and the kidney surface. This position served as the initial point (i.e., depth = 0 µm) to measure the image plane depth. At the boundary between the air and tissue, since the gray values of OCT signal at kidney surface are higher than those of background (air), the threshold value was chosen using Otsu's method [26] to determine the boundary. The flattening algorithm is then applied to all original OCT images to make the kidney surface flat.
Secondly, a region of interest (ROI) of 1.2 mm [X] × 0.6 mm [Y] × 0.7 mm [Z] was selected. This volume was big enough to include sufficient tubules for histogram statistics, as the fine tubulars are about 30–40 µm in diameter [27]. OCT pixel intensity distribution at different depth within the selected ROI was then represented as a histogram to calculate the skewness.
3. Results
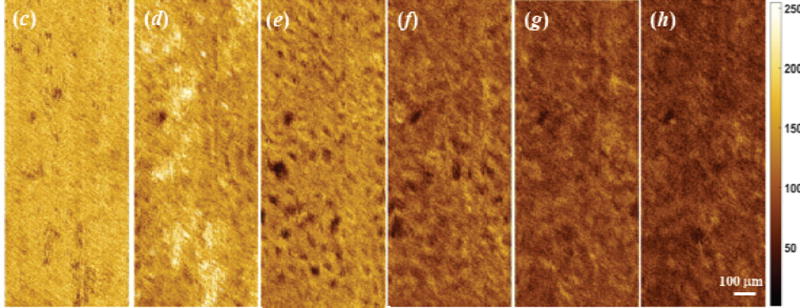
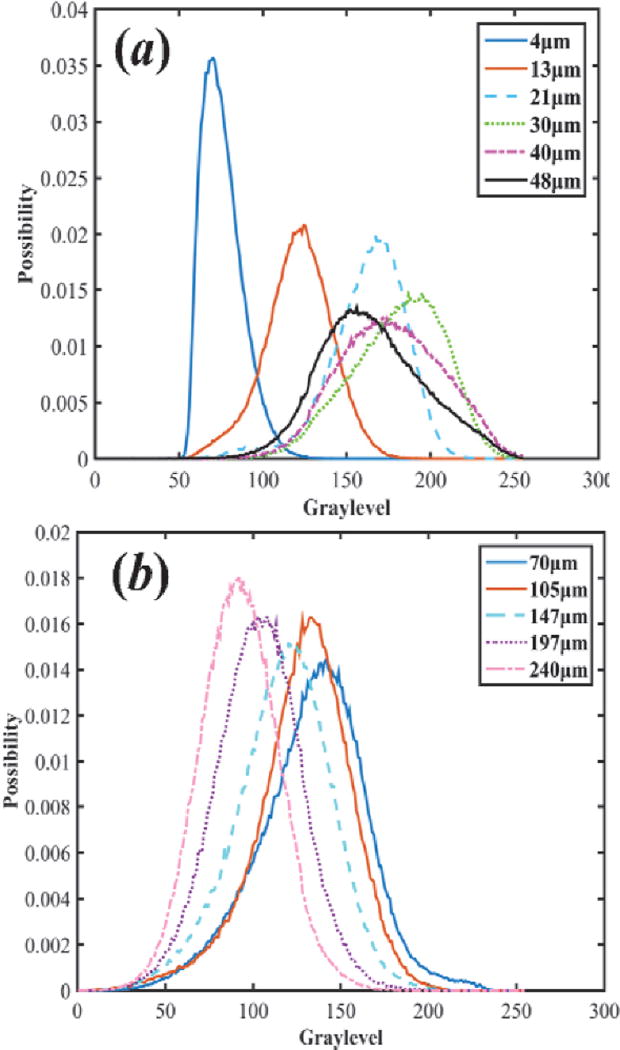
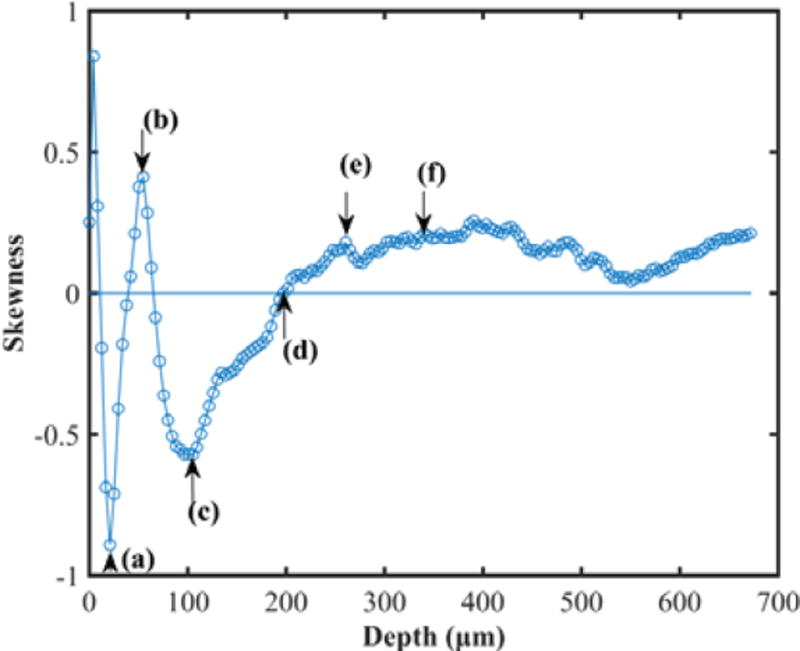
Figure 1 shows 3D OCT image, cross-sectional OCT image of kidney and representative en face OCT images at different depths. The histograms at different depths are plotted in Figure 2, and the skewness of en face OCT image at all depths is calculated and shown in Figure 3. Figure 3 can be divided into two parts. The superficial region (depth = 0–50 µm) mainly contains connective tissues (capsule). En face OCT images in Figure 1(c) and 1(d) are within this region, and OCT image of capsule shows high reflectivity [bright spots in Figure 1(d)]. In addition, Figure 2 (a) shows that skewness in this region fluctuates with depth. Skewness measures the asymmetry of the histogram distribution of en face OCT image at different depths, which is related to the profile of histogram distribution. The central value (peak) increases initially then decreases with depth, while the width of the histogram distribution profile increases with depth, as shown in Figure 2 (a). Thus, the left tail becomes longer at the beginning then gets shorter, and there is a valley in the skewness [point (a) in Figure 3] in this region.
Figure 1.
(a) 3D OCT image of kidney, (b) Cross-sectional OCT image of kidney, (b) Cross-sectional OCT image of kidney. En face OCT image at different depths. (c), (d), (e), (f), (g), and (h) are at the depth of 21 µm, 55 µm, 105 µm, 197 µm, 240 µm, and 280 µm, respectively. En face image size = 1.2 mm × 0.6 mm, each pixel = 4.2 µm.
Figure 2.
Histogram distribution at the different depth ranges of (a) 0–50 µm and (b) 70–240 µm.
Figure 3.
Skewness of OCT image vs. depth for rat kidney. (a), (b), (c), (d), (e), and (f) are at the depth of 21 µm, 55 µm, 105 µm, 197 µm, 240 µm, and 280 µm, respectively. The line of 0 intersects the skewness curve at the point (d).
The other region is the part with depth >50 µm [point (b) and deeper in Figure 3]. This region mainly contains tubular lumens and renal parenchyma. En face OCT images [Figure 1(e), (f), (g), and (h)] show that uriniferous tubular lumens appear to be low backscattering (dark region) as hollow structures, while renal parenchyma appears to be high backscattering (bright region). The gray values decrease with increasing depth, which is consistent with change in the central value of histogram distribution profile in Figure 2(b). Figure 2(b) also indicates that the left tail becomes shorter with increasing depth, and the peak of distribution increases initially and then decreases. Thus, the skewness reaches the minimum at the depth of 105 µm as shown in point (c) of Figure 3.
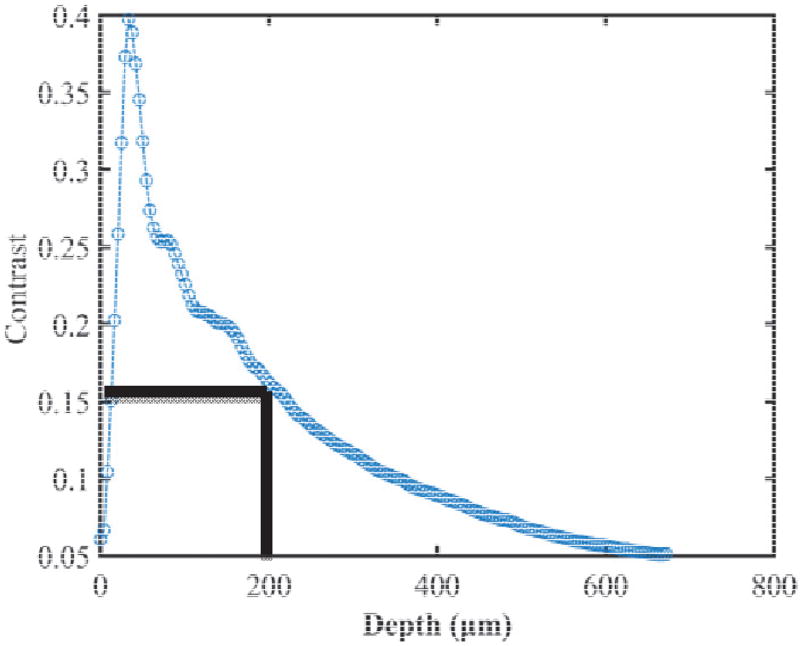
When skewness equals to zero, there is a balance between the left and the right tails of gray level distribution profile. Dark areas of tubular lumen (see Figure 1) dominate the left tail of histogram distribution. With increasing depth, gray value of kidney parenchyma decreases, and the gray level of tubular lumen becomes closer to that of the parenchyma. We calculated the image contrast defined as the ratio of standard deviation and mean of pixel gray values. Figure 4 shows that the contrast is approximately zero at surface and increases sharply within the superficial layer, as this layer contains both connective tissues (capsule, high reflectivity) and tubular lumens (low reflectivity). After this point, the contrast decreases with depth, since the gray values from both tubular lumens and parenchyma become similar. In the region of depth <200 µm, in which the skewness is largely negative as shown in Figure 3, the contrast is higher than 0.15. In this region, the tubular lumens and parenchyma can be readily distinguished. Therefore we focus on this region for analysis of renal ischemia- reperfusion process.
Figure 4.
OCT image contrast vs. depth.
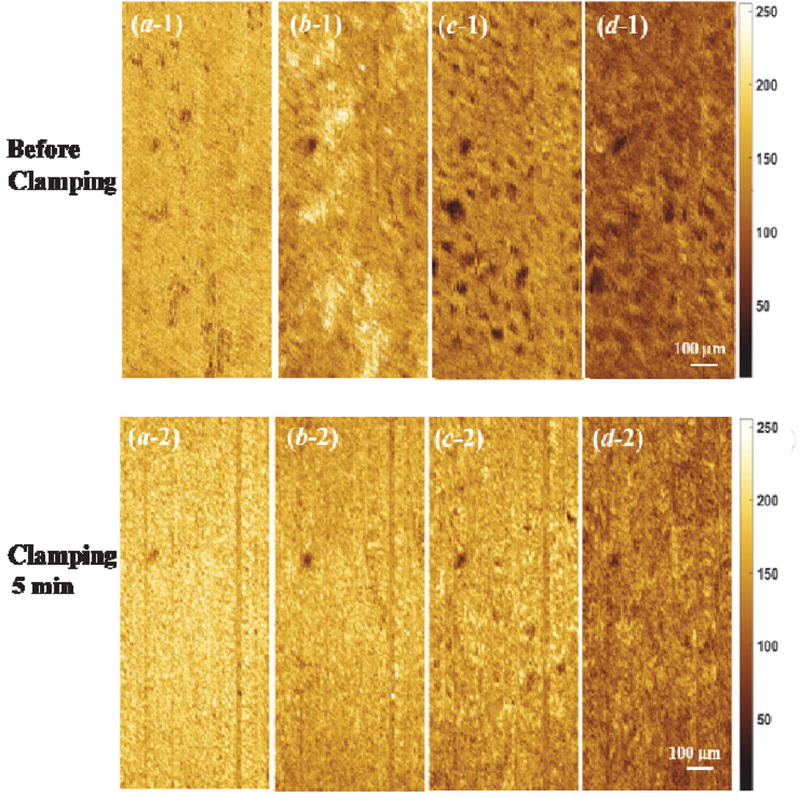
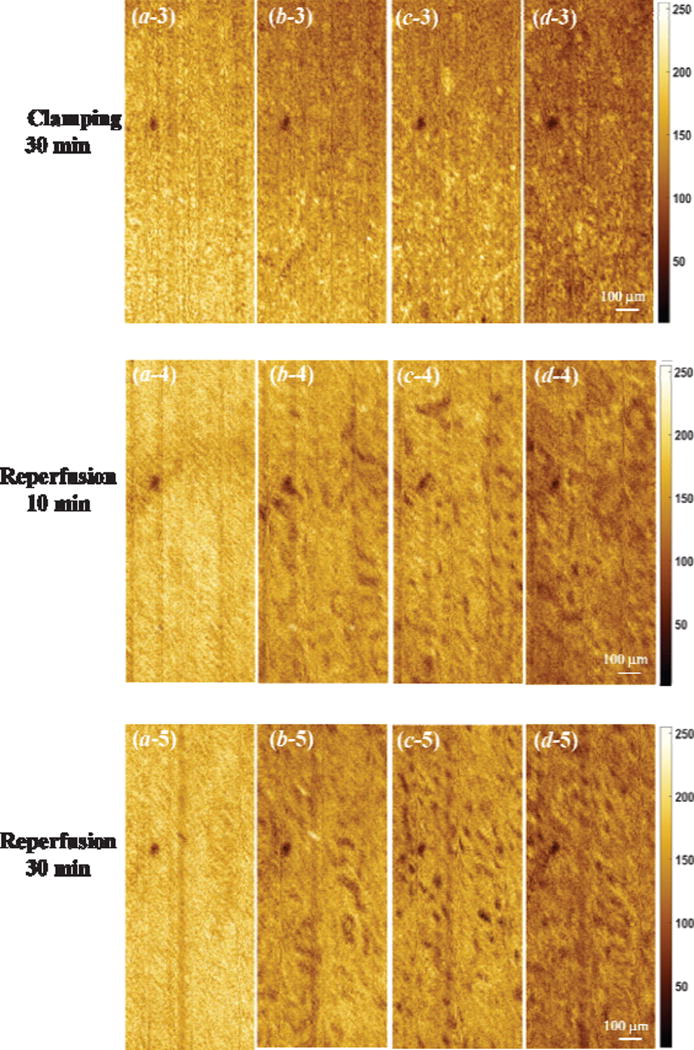
Figure 5 shows the en face OCT images of kidney at different depths during ischemia-reperfusion process. Before clamping the renal vessels, there are numerous open tubular lumens as shown in Figure 5(c-1) and (d-1), and some regions with open tubular lumens in Figure 5(b-1), which could be located at the boundary between capsule and renal cortex. Five-minute of renal ischemia results in rapid epithelial cell swelling in the tubular lumens, especially in the proximal convoluted tubules that locate at the superficial parenchyma of the kidney cortex [see Figure 5(c-2) and (d-2)]. This swelling leads to a significant decrease in tubular luminal diameters. The swollen region causes high light backscattering resulting in higher grey level signal intensity. After 30 minutes of renal vessel clamping, tubular lumens become obliterated as shown in Figure 5(c-3) and (d-3). After reperfusion, the tubular lumens gradually re-open and the luminal size increases [Figure 5(c-4, d-4) and (c-5, d-5)]. Comparing Figure 5(c-4, d-4) with (c-5, d-5), the density and diameter of tubular lumens after 30-minute reperfusion are larger than those after 10-minute reperfusion. Additionally, the tubular size and density after 30-minute recovery shows a slight decrease compared to that before ischemia, which is similar to what we have observed before [14]. Finally, there is an obvious difference in capsule comparing Figure 5(a-1) and (a-5), which demonstrate that the structure changes occurred near the capsule layer during ischemia-reperfusion process take longer time to recover to the initial status.
Figure 5.
Comparison of en face OCT images of kidney at different depth [(a), (b), (c), and (d) are at the depth of 21 µm, 55 µm, 105 µm, and 197 µm, respectively] during ischemia-reperfusion process.
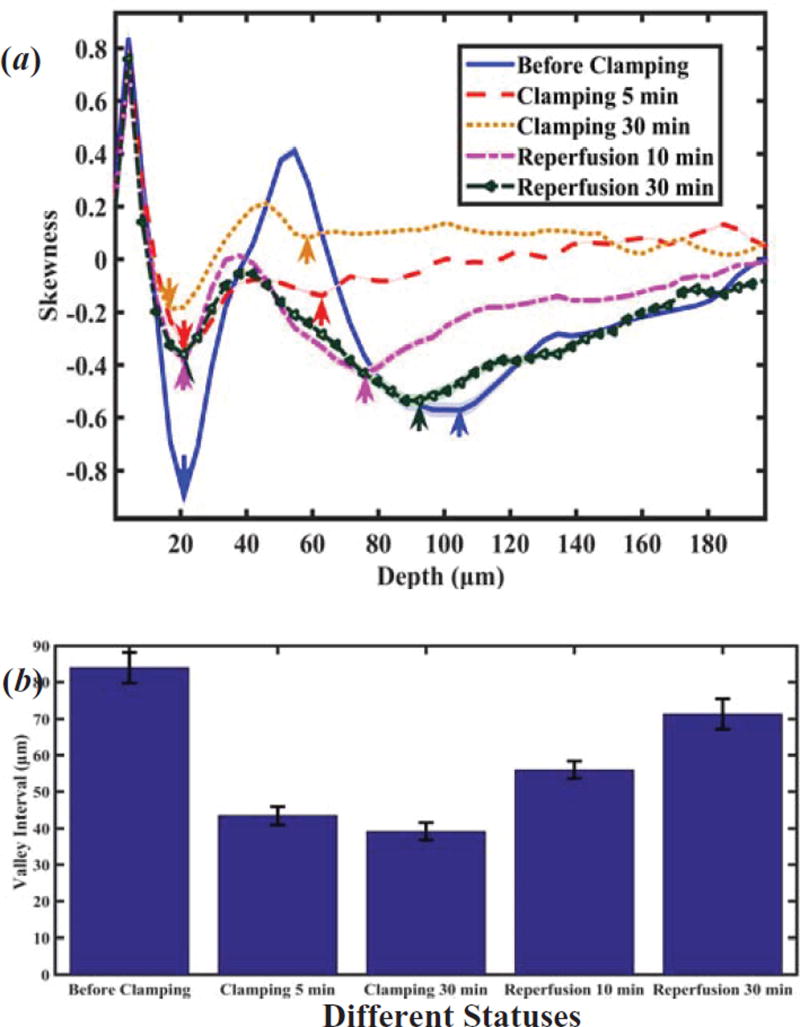
Figure 6(a) shows depth-dependent skewness at different statuses of renal injury. There are two valleys in each skewness curve. The first valley’s position (downward pointing arrow) doesn’t shift significantly during the ischemia-reperfusion process, though the skewness value changes. Both the position and the value of the second valley (upward pointing arrow) change at the different statuses of renal injury/reperfusion. Furthermore, Figure 6(b) shows that there is a significant difference in the depth interval between these two valleys. And Table 1 shows an obvious difference of skewness at different statuses. This result suggests that the interval of the two valleys of skewness from en face OCT image could be used to monitor the ischemia-reperfusion process of kidney.
Figure 6.
(a) Depth-dependent skewness, and (b) depth interval between two valleys of skewness at different statuses of renal injury (n=3). Arrows denote valley positions in (a). Calculating the p values at different status of renal injury with respect to the status of before clamping in (b) all p values less than 0.05.
Table 1.
p-value for cross comparison of skewnesses at different statuses
| Baseline | Clamping 5 min |
Clamping 10 min |
Reperfusion 10 min |
Reperfusion 30 min |
|
|---|---|---|---|---|---|
| Baseline | X | 1.313×10⁻⁴* | 0.890×10⁻⁴* | 5.609×10⁻⁴* | 0.0213* |
| Clamping 5 min | 1.313×10⁻⁴* | X | 0.1007* | 0.0031* | 5.609×10⁻⁴* |
| Clamping 10 min | 0.890×10⁻⁴* | 0.1007* | X | 0.0010* | 3.258×10⁻⁴* |
| Reperfusion 10 min | 5.609×10⁻⁴* | 0.0031* | 0.0010* | X | 0.0053* |
| Reperfusion 30 min | 0.0213* | 5.61×10⁻⁴* | 3.258×10⁻⁴* | 0.0053* | X |
“*” denote statistical significant values (p<0.05)
4. Discussions
OCT can provide high-resolution 3D imaging of kidney in real time, which can be used to quantitatively monitor kidney microanatomy at different statuses [16–18, 20]. In previous studies, image analysis was performed on cross-sectional OCT images. During image analysis, the tubular lumens were firstly segmented out from cross-sectional OCT images based on an empirically-determined intensity threshold, and then the diameter / area / volume of tubular lumens [17, 20] can be calculated. This approach is not fully automatic, as it needs to select an empirical threshold value to segment the tubule.
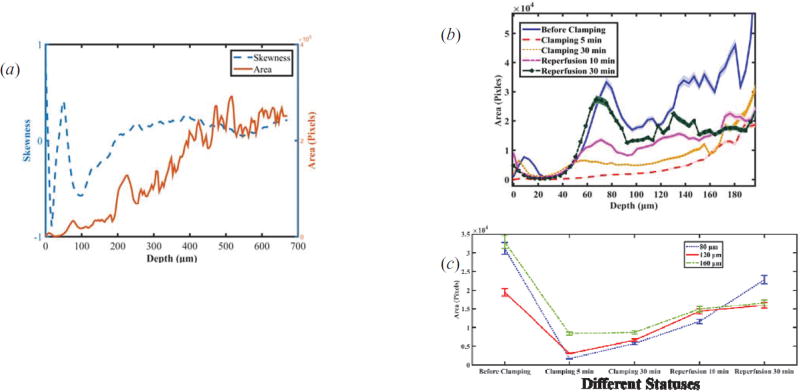
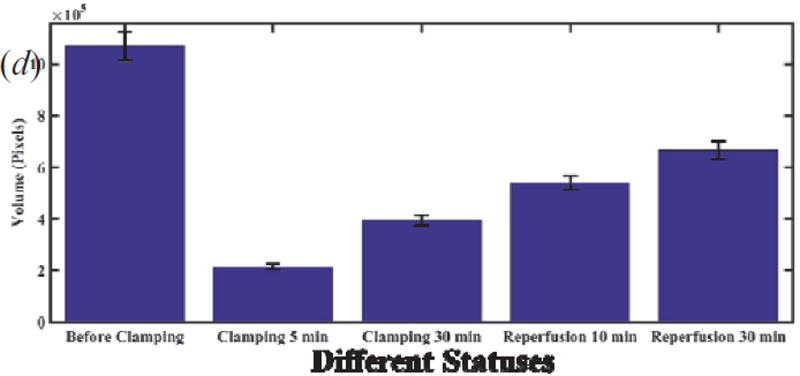
Figure 7(a) shows the comparison of skewness and segmented area (with a threshold value = 82) with areas at different depths for the status of before clamping. Figure 7(b) shows depth-dependent segmented tubule lumen areas at different statuses of renal injury. The trends are different from those of skewness as shown in Figure 6(a). Tubular lumen area at different depth shows different trend during ischemic-reperfusion injury as shown in Figure 7(c). An integrated volume is sum of the areas of tubule lumens at the different depth, and Table 2 shows an obvious difference of volumes at different statuses. Therefore the integrated volume [Figure 7(d)] will provide a indication, which is similar to area [Figure 7(c)].
Figure 7.
(a) Comparison of skewness and segmented lumen areas versus depth.(b) Depth-dependent segmented tubular lumen areas at different statuses of renal injury. (c) Trend of areas at different depths (80 µm, 120 µm, 160 µm) vs. different status. (d) Total segmented tubular lumen volume calculating areas in the range of depth from zero to 200 µm vs. different status.
Table 2.
p-value for cross comparison of volumes at different statuses
| Baseline | Clamping 5 min | Clamping 10 min |
Reperfusion 10 min |
Reperfusion 30 min |
|
|---|---|---|---|---|---|
| Baseline | X | 0.1092×10⁻⁴* | 0.3312×10⁻⁴* | 1.0592×10⁻⁴* | 3.8282×10⁻⁴* |
| Clamping 5 min | 0.1092×10⁻⁴* | X | 1.5685×10⁻⁴* | 4.1426×10⁻⁴* | 0.2349×10⁻⁴ |
| Clamping 10 min | 0.3312×10⁻⁴* | 1.5685×10⁻⁴* | X | 0.0016* | 2.5437×10⁻⁴* |
| Reperfusion 10 min | 1.0592×10⁻⁴* | 4.1426×10⁻⁴* | 0.0016* | X | 0.0067* |
| Reperfusion 30 min | 3.8282×10⁻⁴* | 0.2349×10⁻⁴* | 2.5437×10⁻⁴* | 0.0067* | X |
“*” denote statistical significant values (p<0.05)
The texture analysis algorithm (skewness) applied in this study is a completely automatic calculation method. Skewness value and position shift can be used to quantitatively evaluate the changes in tubular lumens during ischemia-reperfusion injury. This method provides quantitative information regarding changes in superficial uriniferous tubules. Since such changes can be used to predict post-transplant renal function, our method can potentially be applicable in evaluating the status of donor kidneys prior to and after their transplantation as an alternative to the conventional approach (image segmentation with empirical threshold).
5. Conclusions
In summary, a fully automatic texture analysis algorithm has been developed for OCT image analysis of kidney microanatomy during ischemia-reperfusion process. The texture analysis method is based on intensity-based statistics of en face OCT images. We demonstrate its performance in monitoring ischemia-reperfusion process of rat kidney in vivo. This method has the ability for detecting tubular structure alterations caused by ischemia-reperfusion injury on kidney, and has the potential for evaluating post-transplant viability of donor kidneys.
Acknowledgments
Zhifang Li acknowledges the grant support from National Natural Science Foundation of China (No. 81571726), and Changjiang Scholars and Innovative Research Team (No. IRT_15R10). Yu Chen acknowledges the grant supports from the National Institutes of Health (R01 DK094877-01A1 and R21 AG042700-01).
References
- 1.Oykuafutim CA, Hee MR, Lin CP, Reichel E, Schuman JS, Duker JS, Izatt JA, Swanson EA, Fujimoto JG. Imaging of macular diseases with optical coherence tomography. Ophthalmology. 1997;102:217–229. doi: 10.1016/s0161-6420(95)31032-9. [DOI] [PubMed] [Google Scholar]
- 2.Jang I, Tearney GJ, MacNeill B, Takano M, Moselewski F, Iftima N, Shishkov M, Houser S, Aretz HT, Halpern EF, Bouma BE. In vivo characterization of coronary atherosclerotic plaque by use of optical coherence tomography. Circulation. 2005;111:1551–1555. doi: 10.1161/01.CIR.0000159354.43778.69. [DOI] [PMC free article] [PubMed] [Google Scholar]
- 3.Gossage KW, Tkaczyk TS, Rodriguez JJ, Barton JK. Texture analysis of optical coherence tomography images: feasibility for tissue classification. J. Biomed. Opt. 2003;8:570–575. doi: 10.1117/1.1577575. [DOI] [PubMed] [Google Scholar]
- 4.Gossage KW, Smith CM, Kanter EM, Hariri LP, Stone AL, Rodriguez JJ, Williams SK, Bardon JK. Texture analysis of speckle in optical coherence tomography images of tissue phantoms. Phys. Med. Biol. 2006;51:1563–1575. doi: 10.1088/0031-9155/51/6/014. [DOI] [PubMed] [Google Scholar]
- 5.Lindenmaier AA, Conroy L, Farhat G, DaCosta RS, Flueraru C, Vitkin IA. Texture analysis of optical coherence tomography speckle for characterizing biological tissues in vivo. Opt. Lett. 2013;38:1280–1282. doi: 10.1364/OL.38.001280. [DOI] [PubMed] [Google Scholar]
- 6.Chen Y, Aguirre AD, Hsiung P, Huang S, Mashimo H, Schmitt JM, Fujimoto JG. Effects of axial resolution improvement on optical coherence tomography (OCT) imaging of gastrointestinal tissues. Opt. Express. 2008;16:2469–2485. doi: 10.1364/oe.16.002469. [DOI] [PubMed] [Google Scholar]
- 7.Gao W, Zakharov VP, Myakinin OO, Bratchenko IA, Artemyev DN, Kornilin DV. Medical images classification for skin cancer using quantitative image features with optical coherence tomography. Journal of Innovative Optical Health Sciences. 2016;9:1650003. [Google Scholar]
- 8.Lingley-Papadopoulos CA, Loew MH, Manyak MJ, Zara JM. Computer recognition of cancer in the urinary bladder using optical coherence tomography and texture analysis. J. Biomed. Opt. 2008;13:024003. doi: 10.1117/1.2904987. [DOI] [PubMed] [Google Scholar]
- 9.Quellec G, Lee K, Dolejsi M, Garvin MK, Abramoff MD, Sonka M. Three-dimensional analysis of retinal layer texture: identification of fluid-filled regions in SD-OCT of the macula. IEEE Transaction on Medical Imagine. 2010;29:1321–1330. doi: 10.1109/TMI.2010.2047023. [DOI] [PMC free article] [PubMed] [Google Scholar]
- 10.Ughi GJ, Adriaenssens T, Sinnaeve P, Desmet W, D’hooge J. Automated tissue characterization of in vivo atherosclerotic plaques by intravascular optical coherence tomography images. Biomed. Opt. Express. 2013;4:1014–1030. doi: 10.1364/BOE.4.001014. [DOI] [PMC free article] [PubMed] [Google Scholar]
- 11.Qi X, Sivak MV, Isenberg G, Willis JE, Rollins AM. Computer-aided diagnosis of dysplasia in Barrett’s esophagus using endoscopic optical coherence tomography. J. Biomed. Opt. 2006;11:044010. doi: 10.1117/1.2337314. [DOI] [PubMed] [Google Scholar]
- 12.Sullivan AC, Hunt JP, Oldenburg AL. Fractal analysis for classification of breast carcinoma in optical coherence tomography. J. Biomed. Opt. 2011;16:066010. doi: 10.1117/1.3590746. [DOI] [PubMed] [Google Scholar]
- 13.Li L, Asano A, Asano CM, Okajima K. Statistical quantification of the effects of viewing distance on texture perception. J. Opt. Soc. Am. A. 2013;30:1394–1403. doi: 10.1364/JOSAA.30.001394. [DOI] [PubMed] [Google Scholar]
- 14.Chen Z, Milner TE, Srinivas S, Wang X, Malekafzali A, van Gemert MJC, Nelson JS. Noninvasive imaging of in vivo blood flow velocity using optical Doppler tomography. Opt. Lett. 1997;22:1119–1121. doi: 10.1364/ol.22.001119. [DOI] [PubMed] [Google Scholar]
- 15.Wang RK, Jacques SL, Ma Z, Hurst S, Hanson SR, Gruber A. Three dimensional optical angiography. Opt. Express. 2007;15:4083–4097. doi: 10.1364/oe.15.004083. [DOI] [PubMed] [Google Scholar]
- 16.Chen Y, Andrews PM, Aguirre AD, Schmitt JM, Fujimoto JG. High-resolution three-dimensional optical coherence tomography imaging of kidney microanatomy ex vivo. J. Biomed. Opt. 2007;12(3):034008. doi: 10.1117/1.2736421. [DOI] [PubMed] [Google Scholar]
- 17.Andrews PM, Chen Y, Onozato ML, Huang S-W, Adler DC, Huber RA, Jiang J, Barry SE, Cable AE, Fujimoto JG. High-resolution optical coherence tomography imaging of the living kidney. Laboratory Investigation. 2008;88:441–449. doi: 10.1038/labinvest.2008.4. [DOI] [PubMed] [Google Scholar]
- 18.Wierwille J, Andrews PM, Onozato ML, Jiang J, Cable A, Chen Y. In vivo, label-free, three-dimensional quantitative imaging of kidney microcirculation using Doppler optical coherence tomography. Laboratory Investigation. 2011;91:1596–1604. doi: 10.1038/labinvest.2011.112. [DOI] [PMC free article] [PubMed] [Google Scholar]
- 19.Zhi Z, Jung Y, Jia Y, An L, Wang RK. Highly sensitive imaging of renal microcirculation in vivo using ultrahigh sensitive optical microangiography. Biomed. Opt. Express. 2011:1059–1068. doi: 10.1364/BOE.2.001059. [DOI] [PMC free article] [PubMed] [Google Scholar]
- 20.Li Q, Onozato ML, Andrews PM, Chen C-W, Paek A, Naphas R, Yuan S, Jiang J, Cable A, Chen Y. Automated quantification of microstructural dimensions of the human kidney using optical coherence tomography (OCT) Opt. Express. 2009;17:16000–16016. doi: 10.1364/OE.17.016000. [DOI] [PubMed] [Google Scholar]
- 21.Motoyoshi I, Nishida S, Sharan L, Adelson EH. Image statistics and the perception of surface qualities. Nature. 2007;447:206–209. doi: 10.1038/nature05724. [DOI] [PubMed] [Google Scholar]
- 22.Tang Q, Liang C-P, Wu K, Sandler A, Chen Y. Real-time epidural anesthesia guidance using optical coherence tomography needle probe. Quantitative Imaging in Medicine and Surgery. 2015;5:118–124. doi: 10.3978/j.issn.2223-4292.2014.11.28. [DOI] [PMC free article] [PubMed] [Google Scholar]
- 23.Tang Q, Wang J, Frank A, Lin J, Li A, Chen C-Wei, Jin L, Wu T, Greenwald BD, Mashimo Hiroshi, Chen Y. Depth-resolved imaging of colon tumor using optical coherence tomography and fluorescence laminar optical tomography. Biomed. Opt. Express. 2016;7:5218–5232. doi: 10.1364/BOE.7.005218. [DOI] [PMC free article] [PubMed] [Google Scholar]
- 24.Ding Z, Liang C-P, Tang Q, Chen Y. Quantitative single-mode fiber based PS-OCT with single input polarization state using Mueller matrix. Biomed. Opt. Express. 2015;6:1828–1843. doi: 10.1364/BOE.6.001828. [DOI] [PMC free article] [PubMed] [Google Scholar]
- 25.Cristelli M, Zaccaria A, Pietronero L. Universal relation between skewness and kurtosis in complex dynamics. Phys. Rev. E. 2012;85:066108. doi: 10.1103/PhysRevE.85.066108. [DOI] [PubMed] [Google Scholar]
- 26.Otsu N. A Threshold Selection Method from Gray-Level Histograms. IEEE Transactions on Systems, Man, and Cybernetics. 1979;9:62–66. [Google Scholar]
- 27.Knepper MA, Danielson RA, Saidel GM, Post RS. Quantitative analysis of renal medullary anatomy in rats and rabbits. Kidney International. 1977;12:313–323. doi: 10.1038/ki.1977.118. [DOI] [PubMed] [Google Scholar]


