Abstract
Targeted drug delivery is a fast growing industry in healthcare and technologies are being developed for applications utilizing nanocarriers as vehicles for drug transport. As the size scale of these particles becomes further reduced, advanced fluorescence microscopy and image analysis techniques become increasingly important for facilitating our understanding of nanocarrier binding and avidity, thereby establishing the basis for nanocarrier design optimization. While there is a significant body of published work using nanocarriers in vitro and in vivo, the advent of smaller particles that have typically been studied (~500 nm) limits the ability to attain quantitative measurements of nanocarrier binding dynamics since image acquisition and analysis methods are restricted by microscopy pixel size. This work demonstrates the use of a novel calibration technique based on radioisotope counting and fluorescence imaging for enabling quantitative determination of nanocarrier binding dynamics. The technique is then applied to assess the temporal profile of endothelial cell binding of two antibody targeted nanocarrier types in the presence of fluid shear stress. Results are provided for binding of nanoparticles smaller than a microscopy image pixel.
Keywords: Binding, Calibration, Fluorescence Microscopy, Image Analysis, Nanocarrier, Quantitative Binding, Shear Stress, Nanogel, Targeted Drug Delivery
INTRODUCTION
The use of small particles, in the micron and submicron size domain, to target endothelial cells in the vasculature or the airway for the delivery of drugs to treat inflammatory diseases and other ailments is the subject of intense study.1–5 Several studies have reported a variety of design considerations in formulating ideal nanocarriers (NCs) for targeted drug delivery, viz.: (1) NCs that lack cytotoxic potential;6,7 (2) NCs shaped to provide maximum binding to cell surfaces and/or to promote cellular internalization;8 and (3) NCs produced with an optimal size, shape and density to enhance their diffusion in blood, their collision interactions with red blood cells (RBCs) and their propensity to undergo margination,9–12 for which one limiting factor is the dimension of the blood flow cell free layer. A critically important step in furthering the understanding of targeted delivery (for the purpose of optimizing NC delivery from the bloodstream to the bound state on the endothelial cell surface) comprises quantitative studies of NC binding kinetics over time under dynamic conditions with respect to varying parameters such as specific/non-specific binding,4,13,14 antibody (Ab) density on the NC surface, and shear rate conditions in the perfusate flow field.5,15 Such studies are commonly performed using fluorescence microscopy to image nanoparticles (NPs) which are either labelled with a fluorophore or which fluoresce naturally.
A significant amount of work has been conducted under static (no flow) conditions,16,17 and recent work conducted under dynamic (flow) conditions has illustrated quantitative binding for targeted particles in the 500 nm to 2.5 μm size range.5 Larger particles such as those in the micron size range typically demonstrate lower binding (fewer particles bound per cell) than do nano-sized particles, and large particles are not readily endocytosed by cells.18 As a consequence of these limitations in delivery and cellular internalization, the literature is becoming populated with research focused on smaller NCs (size range ~50–300 nm) binding to cells.19–21 There is, however, an inherent difficulty in assessing binding kinetics of NCs smaller than ~700 nm in dynamic experiments: particles of this small size are difficult to image discretely as individual entities due to optical resolution limitations associated with even the best cameras. Technical problems of fluorescence imaging require balancing object size resolution with dimension of the field of view. The use of higher magnification results in a smaller field of view such that less than a single cell can be resolved. Lower magnification enables viewing multiple cells, but at the expense of larger pixel dimension so that individual cell-bound particles cannot be resolved. In essence, providing a rational quantitative result on particle binding has been a major experimental challenge. Previous attempts at determining particle counts12,22 have encountered limitations for several common reasons:
operating a standard static threshold on all images can result in excessive or insufficient numbers;
normalizing particle counts per unit surface area can be compromised by inclusion of hazy fluorescence emanating from internalized particles;
-
for particles smaller than ~500 nm, individual particles become challenging to distinguish for two primary reasons:
according to Rayleigh criterion, particle recognition is limited by the minimum distance between particles which in itself is predicated by the numerical aperture (NA) or the lensing employed; and
a CCD camera will represent what it “sees” as an area comprised of discrete pixels, and those pixels which are illuminated by fluorescence (to be detected) may not be accurately resolved, especially when the particle being detected is in the same size range as, or smaller than, the individual pixels.
For typical fluorescence microscopy applications, a pixel is in the size range of ~160 nm × 160 nm.
To address these issues, we present a study in which we quantify small (in the size range of an individual digital image pixel)_NC cell binding accurately using a novel calibration technique that has been successfully correlated to quantification of larger (larger than the individual pixel) NC binding. This study further employs an image analysis technique by which particle counts per cell are consistently normalized by uniform image thresholding. In addition to assessing particle binding in the time domain, we also present the importance of tunable parameters viz. the ideal particle concentration to maximize binding and the effect of varying shear rate on the propensity of NCs to bind to cells. This study also attempts to explain how non-tunable (e.g., local innate physiological conditions) parameters such as shear rate in blood flow, activated/quiescent state of the vasculature affect binding of these relatively small NCs.
MATERIALS AND METHODS
Materials
Fluorescein isothiocyanate (FITC) labeled polystyrene spheres (PS beads) were purchased from Polysciences (Warrington, PA). All other reagents were from Sigma Chemical (St. Louis, MO) unless otherwise mentioned. The rhodamine-dextran lysozyme nanogels (NGs) were synthesized using a method adopted from a previous study,7 described in short here: Rhodamine labeled Dextran from Leuconostoc ssp. and Lysozyme were dissolved (1:1) in water; pH of the solution was adjusted to 7–8 using 0.1 N sodium hydroxide and was lyophilized. The lyophilized powder was spread out on a glass surface and kept in a desiccator containing saturated KBr solution to react at 60 °C under 79% relative humidity for 18–24 h. The reacted powder was reconstituted in water (5 mg/ml); the pH was adjusted to 10.7 (isoelectric point of lysozyme) using 0.1 N sodium hydroxide, and the solution was heated at 80 °C for 30 min. Once synthesized, NGs were purified via centrifugation using Amicon Ultra-0.5 ml centrifugal filter devices with a 100 kDa molecular weight cutoff (Millipore, Billerica, MA), using the directions of the manufacturer (14,000 g for 10 min to filter off free dextran and lysozyme and 1000 g for 2 min to recover retained NGs) to which an oxidizing agent (0.01 M NaIO4), 25 wt. percent NaCl and deionized water (to bring up volume to 1 mL) were added.
Nanocarrier Characterization and Targeting Antibody Loading
The NCs (PS beads and NGs) were characterized by dynamic light scattering using a ZS90 Malvern Zetasizer Nano Series instrument (Malvern, Westborough, MA). Antibody loading of the NCs was performed as has been previously published.5,23 Briefly, for NG Ab loading, the oxidation reaction (on the chains of the NG outer dextran shell) was placed on a shaker for 3 days after which oxidized NGs were purified using centrifugation and 100 μg Ab (R6.5 or IgG) was added and allowed to react for about 24 hours on a shaker. PS beads were conjugated with anti-Intercellular Adhesion Molecule 1 (anti-ICAM-1) antibody R6.5 (derived in house from hybridoma) via physisorption, i.e., R6.5 added to PS beads and incubated for 60 min. Free non-coated Ab was then separated by centrifugation, and coated PS beads were re-suspended in PBS supplemented with 1% BSA.
Endothelial Cell Culture, Flow Adaptation and Nanocarrier Exposure During Flow
Human umbilical vein endothelial cells (HUVECs) purchased from Lifeline Cell Technology, Walkersville, MD were plated in VascuLife VEGF Cell Culture Media (Lifeline Cell Technology, Walkersville, MD). Cell media samples were regularly checked for mycoplasma contamination using MycoAlert Kit (Lonza, Rockland, ME). For dynamic experiments, cells of passage 2 or 3 were plated onto 22 × 40 Fisherbrand microscope cover glass (Fisher Scientific, Pittsburg, PA) with 1 μg/cm2 fibronectin at a density of 10,000 cells/cm2 and grown to confluence for about 48–72 hr.
Confluent cells were assembled into confocal imaging chambers (Warner Instruments, Hamden, CT) and flow adapted using a peristaltic pump for 48 hr to mimic endothelium whose actin fibers are aligned to flow as in the human microvasculature at shear stresses of 0.1 and 0.5 Pa. In order to simulate inflammation conditions and upregulate the expression of ICAM-1 molecules on the HUVECs luminal surface in dynamic experiments, Tumor Necrosis Factor (TNF-α) at 10 ng/ml was added to the perfusate after the first 24 hr and run for another 24 hr before the experiment was conducted. TNF-α is known to increase ICAM-1 expression by 10–100 fold.5 In either case (with or without TNF-α), after 48 hr of flow adaptation, NCs were introduced into the perfusate for dynamic NC binding studies. NGs were perfused at a concentration of 7.6E11/ml and PS beads were perfused in 4 concentrations ranging from 0.45E11/ml to 1.4E11/ml.
Fixed Cell Experiments
HUVECs were fixed with 2% paraformaldehyde (PFA) for 30 minutes at 4 °C to arrest internalization mechanisms before being assembled into confocal imaging chambers for experiments to determine binding saturation of NCs. NGs were perfused at 7.6E11/ml and PS beads were perfused at 1.4E11/ml.
Imaging Nanocarrier Binding
Images for dynamic experiments were observed using epifluorescence microscopy (Olympus IX-70) and captured using QIClick-R-F-M-12 CCD camera (QImaging, Surrey, BC, Canada). Cells were imaged over 4 hours at various points (15, 30, 45, 60, 120, 180 and 240 min) using a 40× Oil immersion lens (BioVision Technologies, Exton, PA). Images for each time point were averaged: 1–4 image frames per time point, per experiment and then group averaged over three experiments (all experiments were conducted in triplicates). Images taken for dynamic experiments were taken as a series of 10–15 frames.
Radiolabel-Fluorescence Label Calibration Experiments
A separate set of experiments was performed in order to derive a quantitative relationship between bound particle counts obtained by two distinct measures applied to identical, or even the same, samples: radiolabel counts measured from radioactive-isotope labelled NCs and fluorescence-based imaging for particle counting. This is especially valuable since radiolabel counting provides a highly accurate means of determining the number of bound particles, but it cannot readily be employed for dynamic experiments since in situ measurements are not possible. Fluorescence imaging, on the other hand, is excellent for dynamic experiments but does not lend itself to accurate determination of number of bound NCs of imaging pixel (or sub-pixel) size, as is discussed further below. For these experiments anti-platelet endothelial cellular adhesion molecule (anti-PECAM) or Ab62 (derived in house from hybridoma) antibody was used since PECAM expression on HUVEC surface is low and hence reduces error in binding measurements.
For radioisotope-based determination of NG binding, 125I-labeled whole molecule rat IgG (Thermo Scientific) was included in the NG-antibody conjugation at 5% of the quantity of Ab62 anti-PECAM antibody. 125I activity was determined using a 2470 WIZARD2 Automatic Gamma Counter (PerkinElmer Inc., Waltham, MA). Following procedures for standard conjugation of antibody to NGs, centrifugation at 16000 g for 15 min separated NG-antibody conjugates from free [125I]IgG and free Ab62. One min sampling of [125I] gamma count from the separated free antibodies in the supernatant and antibody-NG conjugates in the pellet indicated efficiency of the NG-antibody coupling reaction. [125I] activity in the pellet indicated the total activity in the re-suspended nanogels introduced to cells under flow. Cells were exposed to particles for 30 min under flow, HUVECs exposed to perfusate seeded with NGs were twice treated for 5 min with .05% trypsin-EDTA, mechanically disrupted with a pipette tip, and aspirated. [125I] activity in the aspirated cells was determined and compared to the [125I] activity initially measured in the re-suspended nanogels prior to exposure to cells under flow. The ratio of initial [125I] activity to initial nanogel volume allowed determination of the total volume of cell-bound NGs.
A similar procedure enabled [125I]-based quantification of PS beads binding to HUVECs. At 5% of Ab62 mass, 125I-labeled rat IgG was added alongside Ab62 anti-PECAM to polystyrene NPs in 70 μL filtered PBS as described above. As with NGs, antibody coupling efficiency was determined through [125I] activity on pelleted NPs and in a supernatant containing uncoupled antibody and the quantity of HUVEC-bound nanoparticles was determined through [125I] activity in trypsinized cells.
Experiments were conducted with R6.5 conjugated particles (same loading density), flowing over HUVECs for 30 min using epifluorescence microscopy in parallel. The NP binding counts for these fluorescence-based studies were determined using the image analysis methodology described below. FL and RL measures were plotted on a graph to obtain an equation which serves as the calibration between the estimated FL counts and accurate RL measure. This equation was then applied to the entire data set.
Image Analysis
Images obtained from the microscope (system was not image intensity saturated to obtain data) were processed on ImageJ before using MATLAB to count color pixels. Using the Triangle method (standard on ImageJ) of thresholding, particles were detected and extracted from the background eliminating noise. Each time point image had 15 frames, which were averaged to eliminate particles that were “rolling” and not firmly bound. Large aggregates captured in these averaged frames were then removed using a background subtracting function which excises all thresholded areas having a diameter more than that of the NC (this limit was set as 480 and 640 nm for NGs and PS beads respectively). The MATLAB program was used to provide fluorescence counts. These counts were normalized to cell number using cell counts performed on bright-field (BF) images obtained in sequence with the fluorescence (FL) images at each of the time-points.
The calibration experiments described above provided an accurate count for mass of NCs bound to cells, which can be correlated to number of NCs bound, assuming a standard confluence on the glass surface. The epifluorescence microscopy provided FL counts using the same preprocessing steps on ImageJ (as described above) and these counts were compared to the radiolabelled counts provided from the gamma counter (as described in the previous section) to obtain a calibration factor. The factor was then applied to all FL counts obtained from experimentation to result in accurate particle counts across time and under different experimental conditions.
Statistical Analysis
ANOVA was performed on all data sets to determine significance. A p-value less than or equal to 0.05 was considered to be significant.
RESULTS
Experiments were conducted for NCs of two different sizes, the PS beads were ~240 nm (i.e., larger than a pixel) and the NGs were ~140 nm (i.e., smaller than a pixel). The combination of uniform normalization and calibration was applied to dynamic experiments conducted on both NCs as described above. The results provide new insights into NC binding to cell surfaces. Experiments on both types of NCs were conducted to test varying parameters and their effect on binding and therein effectively conduct a rigorous test on our methodology for quantitative assessment. Results obtained via our experiments show correlations to simulation studies conducted on these particles.24–26
Nanocarrier Size Distribution
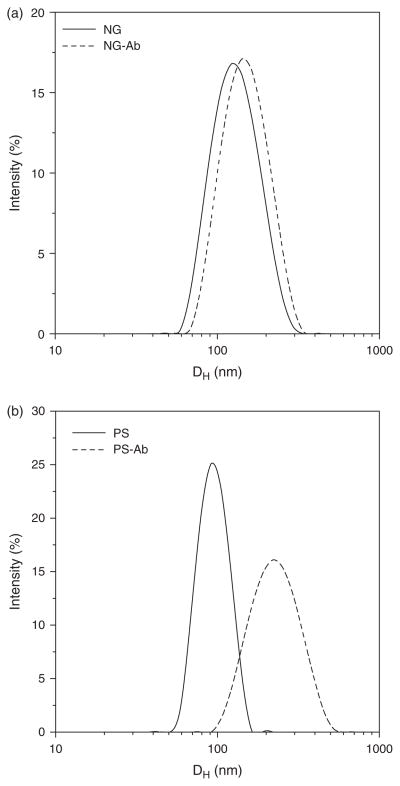
DLS performed for Ab conjugated NCs show NGs sized at ~140 nm (Fig. 1(a)) and the PS beads are ~240 nm (Fig. 1(b)). Figure 1 includes DLS measurements made before and after antibody conjugation to NC surfaces and indicates an increase in particle size following conjugation.
Figure 1.
DLS charts for (a) NGs and (b) PS beads.
Nanocarrier Dynamic Binding Profiles
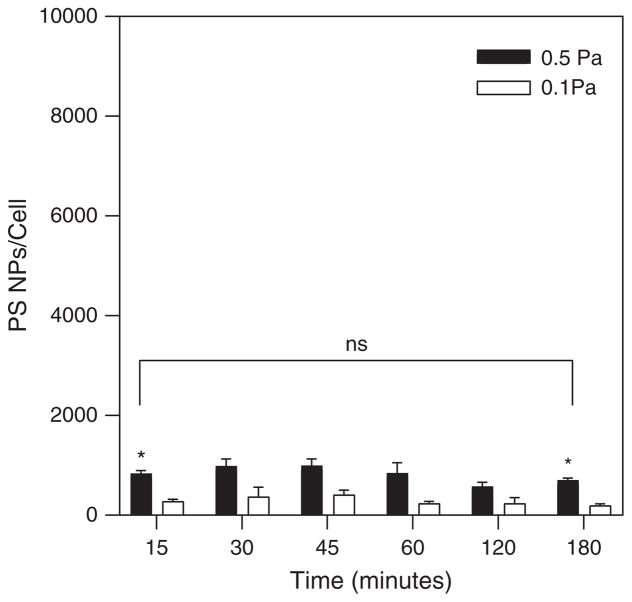
Figure 2 shows the dynamic binding profiles for R6.5 conjugated PS beads on TNF-α treated HUVECs during shear flow. The binding profiles indicate that maximal binding (saturation) occurs within the first 45 min. for a seeding concentration of 1.4E11 particles/mL, and is maintained at this level without significant enhancement or depletion out to 3 hours. While there is a trend for greater numbers of PS beads to bind during flow at the higher shear stress (0.5 Pa) than at the lower shear stress (0.1 Pa), statistical significance was measured only at the first (15 minutes) and last (3 hours) time points.
Figure 2.
PS beads binding at 0.1 Pa and 0.5 Pa over the 3 hour experiment. Seeding concentration of PS beads: 1.4E11 particles/mL.
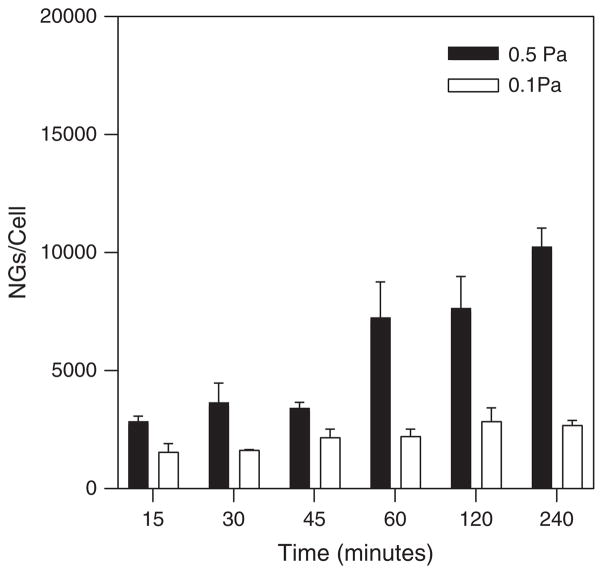
Figure 3 shows the dynamic binding profiles for R6.5 conjugated NGs on TNF-α treated HUVECs during shear flow seeded at a concentration of 7.6E10 particles/mL. NGs were imaged out to 4 hours, with significantly greater binding occurring under higher shear stress (0.5 Pa) compared to lower shear stress (0.1 Pa) at the last time point (and presumably beyond). For low shear stress, there were no significant differences between binding levels measured over the length of the experiment.
Figure 3.
NG binding at 0.1 Pa and 0.5 Pa over the 4 hour experiment. Seeding concentration of NGs: 7.6E10 particles/mL.
Nanoparticle Flow Seeding Concentration Effects on Binding
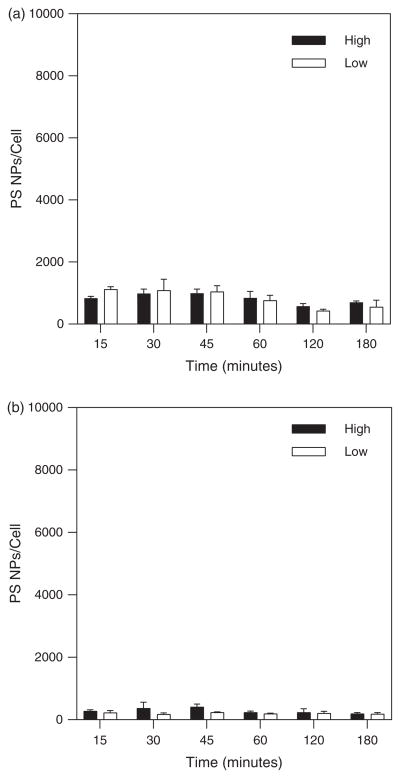
Experiments conducted with R6.5 coated PS beads were performed using a three-fold difference in flow seeding concentration ranging from “low” concentration of 4.5E10 particles/mL to “high” concentration of 1.4E11 particles/mL in order to evaluate the effect of transport enhancement driven by a larger concentration gradient to alter cell binding. Figures 4(a) and (b) show no significant difference between higher and lower concentrations. Again there appears a trend for the more number of particles bound under higher shear stress flow compared to lower shear stress exposure.
Figure 4.
PS bead binding over 3 hours for high and low NC concentrations at (a) 0.1 Pa shear stress and (b) 0.5 Pa shear stress.
Cell Surface Activation Influence on NC Binding
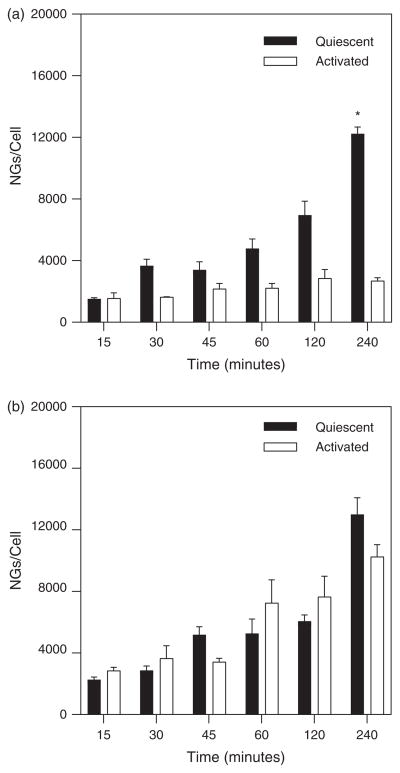
To characterize the effect of cell surface expression of ICAM-1 on NG binding, dynamic experiments were with HUVECs under quiescent conditions in addition to those performed with activated (i.e., TNF-α treated) cells. Experiments were performed under both high and low shear stress conditions (0.5 Pa and 0.1 Pa, respectively) with a flow seeding concentration of 7.6E10 particles/ml. Results shown in Figure 5(a) demonstrate similar (insignificant differences) binding occurred under both quiescent and activated conditions at the higher shear stress. Interestingly, at low shear stress (Fig. 5(b)) there was a trend for greater numbers of NGs to bind to quiescent cells in comparison to activated cells and seems significantly higher at the last time point (4 hours).
Figure 5.
NG binding over 4 hours comparing TNF-α activated cell conditions to quiescent cell conditions at (a) 0.1 Pa shear stress and (b) 0.5 Pa shear stress.
Antibody Conjugation NC Binding
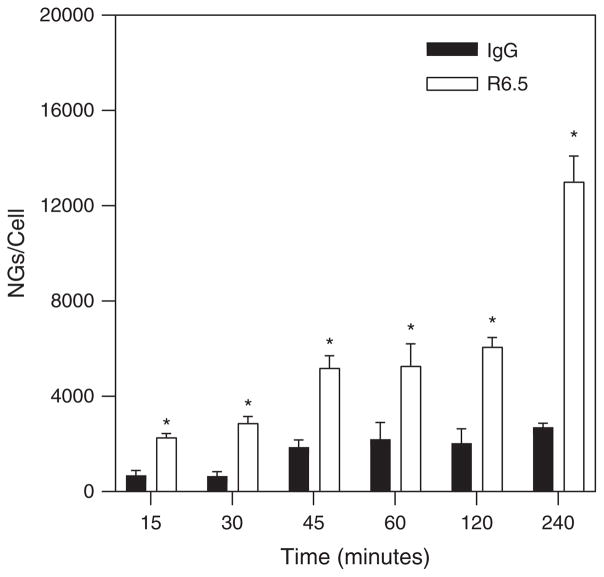
To determine the effects of antibody specificity of binding, dynamic experiments were conducted with NGs conjugated with either R6.5 for specific binding interactions or IgG for non-specific binding interactions with quiescent HUVECs. These experiments were conducted at the high shear stress condition (0.5 Pa) with a flow seeding concentration of 7.6E10 particles/ml. Figure 6 demonstrates that specific binding interactions increase significantly throughout the experimental duration of 4 hours.
Figure 6.
NG binding curves comparing specific (R6.5 conjugation) to non-specific (IgG conjugation) binding under quiescent cell conditions at 0.5 Pa.
DISCUSSION
The goal of these experiments has been to ascertain accurate quantification of binding of NCs under conditions in which the NCs are smaller than an individual digital image pixel. This is the first study in which this dual method approach has been applied to the study of nanoparticle binding to cells in shear flow. The value of the dual radiolabel-fluorescence label binding assessment for calibration purposes as has been applied herein is that it permits the detailed quantitative study of NP binding with particles that are similar in size, or smaller than, the pixel size utilized in the microscopy method. The resultant findings can be interpreted in terms of effects on binding avidity, but it is worthwhile to first understand the rationale for using a calibrated microscopy method to assess binding.
Quantitative Assessment of Nanoparticle Binding
Quantitative binding assessment of nanoparticles (in the size range of 50 to 150 nm) has posed a serious challenge for investigation of targeted drug delivery by light microscopy techniques. Image analysis programs that simply count colored (or white in a binary image) pixels cannot be considered to give accurate information because of a scaling problem associated with the objective and digital camera used, i.e., the pixels in any image captured by a digital camera (on a epifluorescence microscope) will typically be about 160 nm (exact: 161.2 nm), depending on camera, for a 40× oil objective lens enabling imaging of multiple cells. Since this pixel dimension is similar in size to a nanoparticle, there is an inherent difficulty in discriminating individual bound particles. As seen in the Figure 7 below, one particle can give three different outputs depending on its location in a given image, i.e., 1, 2 or 4 counts. If scaled up to realistic binding numbers, the output could be off by a factor of 2 or 4 for each individual image thereby compromising the integrity of a consistent quantitative assessment and possibly giving erroneous binding information.
Figure 7.
A NP can reside in any position relative to pixel arrangement (only 4 pixels shown for representational purposes) and being in the size range of 1 pixel, can confound results. Pixels will light up (give a signal, represented as yellow in figure) even if a portion of the NP falls within their “borders” (pixel sizes depend on objectives; in current work, size was calculated to be ~ 161.2 nm for a 40× oil immersion lens used in an Olympus IX 70 inverted microscope).
In addition to a fundamental error in particle counting, the image acquired at a certain time-point would comprise a single plane of focus on cells. The plane of focus on the images acquired has a thickness (based on numerical aperture of the objective used and the medium of immersion i.e., water/oil/air) of about 340 nm. HUVECs are known to have a thickness of ~3–5 um,19,27 which suggests that each plane of focus captures only about 6 to 10% of the HUVEC topography. Hence the camera image does not capture all of the surface binding accurately.
The technique presented here with radiolabelled particles was developed (as described in the methods section) and the precise, highly sensitive measurements made with the gamma counter were correlated to fluorescent counts made via MATLAB in order to ascertain a calibration which can then be applied over the entire data set. The advantage of this technique is that it eliminates a need for stochastic evaluation of binding orientations as indicated in Figure 6, especially when the data sets are large (in this case, thousands of particles binding per cell). Another reason measuring pixel area can be inaccurate is engendered by cellular internalization of NCs at long perfusion times. Once internalized, the NCs may not be captured as sharp fluorescence dots on the cell surface but may likely appear to be “aggregated” NCs (albeit with a lower intensity) or blobs, presumably due to the additional refraction provided by the cytoplasm.
Fluorescence data at this length scale lose precision for counting bound NCs, but acquiring fluorescence imaging is relatively simple and fast. On the other hand, the radiolabelled counts provide a precise number of bound particles but require the experiment to be halted at every time point and the cells to be scraped from the glass surface (delineated in the methods section), thus being an arduous process. Instead this methodology was adopted for one time point, compared with corresponding fluorescence counts and the relationship was subsequently applied for fluorescence data obtained across other time points for numerous different experimental conditions. This enables more accurate detailed understanding of binding avidity resulting from dynamic experiments.
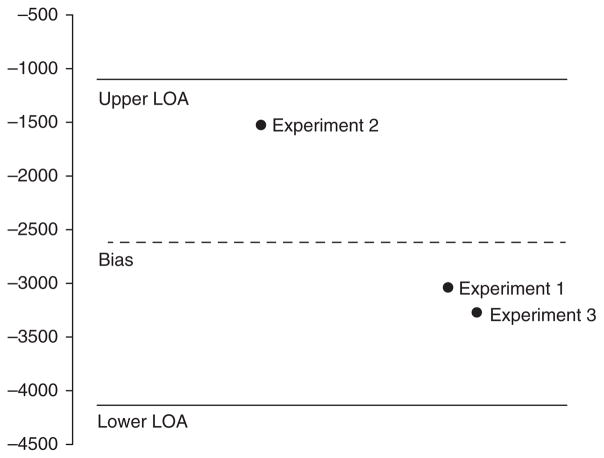
This radiolabeled technique was applied first to PS beads: being in the 240–270 nm range they are much bigger than the individual pixel and hence do not pose the same potential for error that particles smaller than a pixel would (as previously mentioned and illustrated in Fig. 7). A Bland-Altman analysis was then performed to validate the calibration approach (Fig. 8) and showed good correlation between FL counts and corresponding RL measure.
Figure 8.
Bland-Altman analysis to validate FL counts and RL measure made with PS bead experiments.
Binding Avidity
Antibody coating density being roughly at saturation capacity of 7000 Ab/um2 or 200–240 Ab molecules per NC15 for both the NGs and PS beads used in these studies provides some valuable insights.
PS beads and NGs perfused over HUVECs at similar perfusate seeding concentrations showed increased binding by NGs over time, possibly suggesting non-rigid particles diffuse more in flow, as seen in previous computational work. It is also possible that shear stress leads to NG deformation that results in conformations favorable for receptor-ligand interactions to increase cell surface binding.
Fluorimetry studies were conducted with the NGs to understand the nature of their buoyancy. After 60 and 120 min of incubation, the top 20%, middle 60% and bottom 20% were isolated and their respective fluorescence signals were measured using a plate reader (Synergy H1, BioTek, Winooski, VT). The results (not shown) indicate that a little over 60% of the NG volume was in the combination of top 20% and middle 60% of the liquid column, suggesting that the NGs are effectively neutrally buoyant. Since a majority did not settle to the bottom over time, in the perfusate without RBCs, there were no additional factors such as margination effects to a cell free layer or gravity-based settling to enhance binding interactions with the HUVECs. To explore this further, additional experiments were conducted with the flow chamber inverted (coverslip with cells on upper surface instead of lower surface). There was no significant difference found in binding under this configuration, which confirms these findings.
HUVECs treated with TNF-α to increase cell surface expression of ICAM-14,15,28 did not demonstrate a marked increase in NG binding, as observed in another study with smaller but neutrally buoyant particles.19
Results 1 and 2 are in good agreement with those from a recent study24 that delineated the effects of “margination” (with no RBCs present, only buffer) of NCs in laminar flow. Their findings indicated that even though NCs were pushed outward towards the channel walls, the vast majority of NCs remained sufficiently far away from the surface such that receptor-ligand interactions could not lead to NC binding. Hence the resultant binding avidity is low. Result 3 shines light on some very interesting behavior that NGs seem to show: their binding on quiescent cells is higher than on activated cells and this seems to suggest that in addition to the NGs interacting with the surface receptor (ICAM-1), they are interacting non-specifically to the surface of the cell itself (even if devoid of receptors). To study this some more, we performed an experiment with just naïve NGs (no Ab conjugation) over quiescent cells over 4 hours. As Figure 9 shows, binding was observed starting at 15 minutes all the way through to 4 hours. This potentially suggests that binding under quiescent conditions is somehow being amplified by non-specific interactions of the NGs with HUVECs.
Figure 9.
Fluorescence images of NGs over HUVECs at 15 minutes (left), 60 minutes (center) and 240 minutes (right).
Another reason for low avidity stems from the fact that shear stress induces some structural changes in HUVECs, i.e., in addition to rearrangement and aligning of actin stress fibers to the direction of flow, these cells lose their flat morphology and become slightly conical. This influences local hydrodynamics and can cause NCs in flow to interact with a smaller percentage of the surface of the cell hence displaying much lower binding. This can also explain why there is little change in avidity observed on inflamed cells19 and is in agreement with our findings regarding cell activation. Additionally, this may also explain the finding of a relative lack of dependence of specificity in binding.
In our experiments, NGs, but not PS beads, showed a significant increase in binding after 60 min. One explanation is that non-rigid particles assume conformations that limit the shear force they experience: “flattening” of non-rigid particles possibly reduces the effect of eroding forces of shear flow.8,25 Soft NP conformational effects may also minimize the multivalency required for them to remain attached to the cell surface, thus leaving binding sites available for additional soft NPs to bind the surface.
Without an external source for margination (i.e., RBCs or buoyancy effects), the structure/rigidity of the NC appears to play a key role in enhancing particle diffusion and subsequent wall encounters for binding interactions to occur, being more critical at longer times in perfusion. For instance, at a higher shear rate, after 120 min of perfusion, there seems to be no significant increase in NG binding compared to PS bead binding, but there is an obvious trend for NG binding to increase out to 240 min whereas the binding of PS beads saturates at earlier time. NGs can deform into ellipsoidal particles due to the shear forces experienced in laminar flow,25 experiencing no lateral forces (caused in blood flow by collisions with RBCs) they exhibited increased binding compared to their spherical PS bead counterparts. Importantly, shear stress also influences NC diffusion and the resultant wall encounters in laminar flow. As shown above, at the lower shear stress (0.1 Pa), both types of NCs show minimal binding without any increase in binding occurring even at longer perfusion times.
CONCLUSIONS
A combination of radiolabelled and fluorescence particle counting is demonstrated, for the first time, to provide a highly useful calibration method for determining quantitative measurements of cell surface binding of NCs that are similar in size, or smaller, than the pixel dimension that otherwise limits the spatial resolution of optical microscopy. Dynamic shear flow experiments for perfusion times of several hours reveal important effects of a variety of tunable and non-tunable parameters governing binding kinetics at such small length scales. Ultimately, this work reveals that binding avidity may not depend to a great degree on binding specificity, but that may be a limitation of wall encounters of NCs with HUVECs in the absence of RBCs in the perfusate. Future experiments using this calibrated imaging technique with RBCs included in perfusion will provide further detail.
Acknowledgments
This work has been supported by National Institutes of Health (NIH) grant R01 EB006818 for NGs and R01 EB016027 for PS beads.
References
- 1.Ding BS, Dziubla T, Shuvaev VV, Muro S, Muzykantov VR. Mol Interv. 2006;6:98. doi: 10.1124/mi.6.2.7. [DOI] [PubMed] [Google Scholar]
- 2.Mastrobattista E, Storm G, van Bloois L, Reszka R, Bloemen PG, Crommelin DJ, Henricks PA. Biochim Biophys Acta. 1999;1419:353. doi: 10.1016/s0005-2736(99)00074-7. [DOI] [PubMed] [Google Scholar]
- 3.Weller GER, Villanueva FS, Klibanov AL, Wagner WR. Ann Biomed Eng. 2002;30:1012. doi: 10.1114/1.1513565. [DOI] [PubMed] [Google Scholar]
- 4.Sakhalkar HS, Dalal MK, Salem AK, Ansari R, Fu J, Kiani MF, Kurjiaka DT, Hanes J, Shakesheff KM, Goetz DJ. Proc Natl Acad Sci USA. 2003;100:15895. doi: 10.1073/pnas.2631433100. [DOI] [PMC free article] [PubMed] [Google Scholar]
- 5.Calderon AJ, Muzykantov V, Muro S, Eckmann DM. Biorheology. 2009;46:323. doi: 10.3233/BIR-2009-0544. [DOI] [PMC free article] [PubMed] [Google Scholar]
- 6.Connor EE, Mwamuka J, Gole A, Murphy CJ, Wyatt MD. Small. 2005;1:325. doi: 10.1002/smll.200400093. [DOI] [PubMed] [Google Scholar]
- 7.Li J, Yu S, Yao P, Jiang M. Langmuir. 2008;24:3486. doi: 10.1021/la702785b. [DOI] [PubMed] [Google Scholar]
- 8.Decuzzi P, Pasqualini R, Arap W, Ferrari M. Pharm Res. 2009;26:235. doi: 10.1007/s11095-008-9697-x. [DOI] [PubMed] [Google Scholar]
- 9.Toy R, Hayden E, Shoup C, Baskaran H, Karathanasis E. Nanotechnology. 2011;22:115101. doi: 10.1088/0957-4484/22/11/115101. [DOI] [PMC free article] [PubMed] [Google Scholar]
- 10.Jurney P, Agarwal R, Roy K, Sreenivasan SV, Shi L. J Nanotechnol Eng Med. 2015;6:11007. [Google Scholar]
- 11.Decuzzi P, Ferrari M. Biomaterials. 2008;29:377. doi: 10.1016/j.biomaterials.2007.09.025. [DOI] [PubMed] [Google Scholar]
- 12.Thompson AJ, Eniola-Adefeso O. Acta Biomater. 2015;21:99. doi: 10.1016/j.actbio.2015.04.005. [DOI] [PubMed] [Google Scholar]
- 13.Calderon AJ, Bhowmick T, Leferovich J, Burman B, Pichette B, Muzykantov V, Eckmann DM, Muro S. J Control Release Off J Control Release Soc. 2011;150:37. doi: 10.1016/j.jconrel.2010.10.025. [DOI] [PMC free article] [PubMed] [Google Scholar]
- 14.Muzykantov VR, Muzykantov VR. Int Sch Res Not Int Sch Res Not. 2013. p. e916254. [Google Scholar]
- 15.Muro S, Dziubla T, Qiu W, Leferovich J, Cui X, Berk E, Muzykantov VR. J Pharmacol Exp Ther. 2006;317:1161. doi: 10.1124/jpet.105.098970. [DOI] [PubMed] [Google Scholar]
- 16.Davda J, Labhasetwar V. Int J Pharm. 2002;233:51. doi: 10.1016/s0378-5173(01)00923-1. [DOI] [PubMed] [Google Scholar]
- 17.Bloemen PG, Henricks PA, van Bloois L, van den Tweel MC, Bloem AC, Nijkamp FP, Crommelin DJ, Storm G. FEBS Lett. 1995;357:140. doi: 10.1016/0014-5793(94)01350-a. [DOI] [PubMed] [Google Scholar]
- 18.Muro S, Wiewrodt R, Thomas A, Koniaris L, Albelda SM, Muzykantov VR, Koval M. J Cell Sci. 2003;116:1599. doi: 10.1242/jcs.00367. [DOI] [PubMed] [Google Scholar]
- 19.Samuel SP, Jain N, O’Dowd F, Paul T, Kashanin D, Gerard VA, Gun’ko YK, Prina-Mello A, Volkov Y. Int J Nanomedicine. 2012;7:2943. doi: 10.2147/IJN.S30624. [DOI] [PMC free article] [PubMed] [Google Scholar]
- 20.Bhowmick T, Berk E, Cui X, Muzykantov VR, Muro S. J Controlled Release. 2012;157:485. doi: 10.1016/j.jconrel.2011.09.067. [DOI] [PMC free article] [PubMed] [Google Scholar]
- 21.Cochran DB, Wattamwar PP, Wydra R, Hilt JZ, Anderson KW, Eitel RE, Dziubla TD. Biomaterials. 2013;34:9615. doi: 10.1016/j.biomaterials.2013.08.025. [DOI] [PubMed] [Google Scholar]
- 22.Han J, Shuvaev VV, Davies PF, Eckmann DM, Muro S, Muzykantov VR. J Controlled Release. 2015;210:39. doi: 10.1016/j.jconrel.2015.05.006. [DOI] [PMC free article] [PubMed] [Google Scholar]
- 23.Ferrer MCC, Shuvaev VV, Zern BJ, Composto RJ, Muzykantov VR, Eckmann DM. PLOS One. 2014;9:e102329. doi: 10.1371/journal.pone.0102329. [DOI] [PMC free article] [PubMed] [Google Scholar]
- 24.D’Apolito R, Tomaiuolo G, Taraballi F, Minardi S, Kirui D, Liu X, Cevenini A, Palomba R, Ferrari M, Salvatore F, Tasciotti E, Guido S. J Controlled Release. 2015;217:263. doi: 10.1016/j.jconrel.2015.09.013. [DOI] [PubMed] [Google Scholar]
- 25.Sarkar A, Eckmann DM, Ayyaswamy PS, Radhakrishnan R. Soft Matter. 2015;11:5955. doi: 10.1039/c5sm00669d. [DOI] [PMC free article] [PubMed] [Google Scholar]
- 26.Swaminathan TN, Liu J, Balakrishnan U, Ayyaswamy PS, Radhakrishnan R, Eckmann DM. IUBMB Life. 2011;63:640. doi: 10.1002/iub.475. [DOI] [PMC free article] [PubMed] [Google Scholar]
- 27.Vargas-Pinto R, Gong H, Vahabikashi A, Johnson M. Biophys J. 2013;105:300. doi: 10.1016/j.bpj.2013.05.034. [DOI] [PMC free article] [PubMed] [Google Scholar]
- 28.Murciano JC, Muro S, Koniaris L, Christofidou-Solomidou M, Harshaw DW, Albelda SM, Granger DN, Cines DB, Muzykantov VR. Blood. 2003;101:3977. doi: 10.1182/blood-2002-09-2853. [DOI] [PubMed] [Google Scholar]


