Abstract
BACKGROUND AND PURPOSE
Brain trauma is known to result in heterogeneous patterns of tissue damage and altered neuronal and glial metabolism that evolve over time following injury; however, little is known on the longitudinal evolution of these changes. In this study, magnetic resonance spectroscopic imaging (MRSI) was used to map the distributions of altered metabolism in a single subject at five time points over a period of 28 months following injury.
METHODS
MRI and volumetric MRSI data was acquired in a subject that had experienced a moderate traumatic brain injury (Glasgow Coma Scale 13) at five time points, from 7 weeks to 28 months after injury. Maps of N-acetylaspartate (NAA), total choline (Cho), and total creatine signal were generated and differences from normal control values identified using a z-score image analysis method.
RESULTS
The z-score metabolite maps revealed areas of significantly reduced NAA and increased Cho, predominately located in frontal and parietal white matter, that evolved over the complete course of the study. A map of the ratio of Cho/NAA showed the greatest sensitivity to change, which indicated additional metabolic changes throughout white matter. The metabolic changes reduced over time following injury, though with abnormal values remaining in periventricular regions.
CONCLUSIONS
The use of z-score image analysis for MRSI provides a method for visualizing diffuse changes of tissue metabolism in the brain. This image visualization method is of particularly effective for visualizing widespread and diffuse metabolic changes, such as that due to traumatic injury.
Keywords: MR Spectroscopy, longitudinal, z-score image analysis, traumatic brain injury
Introduction
Traumatic brain injury (TBI) results in widespread metabolic alterations that can be detected using magnetic resonance spectroscopy, with the major findings being reduced N-acetylaspartate (NAA), indicating neuronal loss and dysfunction, and increased total choline signal (Cho), which includes free choline, phosphorylcholine, and glycerophosphocholine, that is considered to be a marker of increased cellular turnover. Maps of these brain metabolite distributions can be obtained over approximately 65% of the brain volume using MR Spectroscopic Imaging (MRSI), enabling regional differences to be identified in TBI subjects relative to normal control subjects.1, 2 Studies have shown that alterations of brain metabolite distributions following TBI can be detected shortly after injury,2, 3 even in the absence of structural indications of injury detected by conventional MRI or CT, and that similar alterations can be detected several years after the injury.4 However, the evolution of the spatial distributions of these altered metabolite distributions over time in individual subjects has not been reported.
Previous studies of altered brain metabolites following TBI have largely relied on quantitative measurements from regions-of-interest (ROIs), rather than direct observations from metabolite maps. One reason for this is that visual interpretation of metabolite maps remains problematic, due to difficulties associated with the relatively low spatial resolution of the technique, the presence of image artifacts due to variable spectral quality, and by the fact that the magnitude of the metabolite changes can be comparable to normal variations of these metabolites, which vary by tissue type, brain region, and subject age.5 As a result, analyses have been carried out by comparison of ROI measurements relative to the corresponding control values. Because the MRS-detected metabolite values are not calibrated, it is necessary to apply a signal normalization procedure before comparisons between studies can be made. This is most conveniently carried out by calculating ratios of two metabolites, often using creatine (Cre) as the denominator, or alternatively by using tissue water obtained in a separate measurement.6 Following normalization, quantitative comparisons between studies can then be carried out for each ROI.
An alternative approach for quantitative analysis of alterations in image values is to use voxel-based methods.7 For analyses of images from a single subject, the difference between the subject data and the mean values from a control group can be generated. Since metabolite values change with age, it is preferable to use an age-matched control group. By converting all images for the test subject and the control group into a common spatial reference, these comparisons can be done for each voxel. By scaling the result by the standard deviation at each voxel over the control group a z-score image can be generated.8 Additional considerations for generation of z-score images for MRSI include the relatively large voxel volume, which results in considerable partial volume contributions from grey-matter (GM), white-matter (WM), and CSF, each of which have differing metabolite concentrations; and that the quality of the spectral data can vary across the sampled volume. In this report, the use of z-score images for visualization of metabolic changes following TBI is reported for longitudinal studies in a single subject, over a period of 2.3 years following injury. The analysis method is applied to volumetric MRSI data to provide a detailed analysis of the distributions of tissue injury.
Materials and Methods
Subject Selection
A male subject that had experienced a TBI following a motor vehicle accident at age 22, with a GCS score of 13 on arrival at the emergency room, was studied at time points of 1.7, 7.4, 14.8, 21.7 and 27.7 months after injury. To obtain normal control values for comparison, data was obtained from an existing database5 for 25 healthy subjects, age 20 to 29, mean 25 years old (16 female, 9 male), that reported no history of TBI, or disease or disorder that may affect the brain. Data from an additional four healthy subjects, aged 21 to 28, was also used to evaluate performance of the analysis in normal subjects, of which one subject was studies 5 times. All studies under which the data were obtained was approved by the Institutional Review Board at the University of Miami and all subjects provided written informed consent prior to the study.
Data Acquisition Methods
MR data were acquired for all subjects at 3 Tesla (Siemens, Tim-Trio) using eight-channel phased-array detection. This included a T1-weighted MRI with 1-mm isotropic resolution (magnetization-prepared rapid acquisition gradient echo sequence, TE/TR=4.43/2150 ms, 160 slices) and a T2-weighted gradient-echo (GRE) sequence (TE/TR: 18 ms/658 ms, 44 slices, 3-mm slice thickness, FOV: 220×220 mm2). Volumetric MRSI data was acquired with TR/TE=1710/70 ms, lipid inversion nulling with TI = 198 ms, spin-echo excitation with selection of a 135 mm slab covering the cerebrum, Echo-Planar readout with 1000 spectral sample points, spectral bandwidth 1250 Hz, sampling of 50×50×18 k-space points over 280×280×180 mm3, and an acquisition time of 26 min.2.
The cognitive performance of the TBI subject was evaluated on the first four visits by neuropsychological testing. Z-scores were calculated for each cognitive domain and an overall composite score then calculated. Tests were carried out for the following cognitive domains: immediate and delayed visual memory, immediate and delayed verbal memory, visual scanning and discrimination, non-verbal abstract reasoning and ability to shift and maintain visual perceptual sets, non-verbal abstract reasoning and problem solving, processing speed, auditory attention and concentration, and verbal fluency.
Data Processing and Analysis
MRSI data were processed using the MIDAS package5 to provide metabolite images for NAA, creatine (Cre), Cho, and their ratios. Images were interpolated to 64×64×32 points and following spatial smoothing the effective voxel volume was 1.5 mL. Processing included signal normalization of individual metabolite images to institutional units using tissue water as a reference, which was acquired using a non-water-suppressed acquisition that was interleaved with the metabolite measurement. Maps of the tissue distributions that corresponded to the SI-resolution spatial response function were obtained following segmentation of the T1-weighted MRI using FSL/FAST9. A non-linear registration was then applied to map all metabolite and tissue distribution images to a spatial reference, for which the MNI BrainWeb10 was used, at 2 mm isotropic voxels.
Maps of the significance of the difference of the individual subject results from the mean value of the control group were generated for NAA, Cre, Cho, and Cho/NAA. Prior to this calculation, voxels were first excluded based on the following quality criteria: i) fitted metabolite linewidth >12 Hz; ii) having an outlying value >3 times the standard deviation of all valid voxels over the image; and iii) >30% CSF contribution to the voxel volume. To account for varying contributions of CSF, the individual metabolite maps were corrected for CSF partial-volume contribution as Met′ = Met/(1-fCSF), where Met is the uncorrected single metabolite value and fCSF is the relative fraction of CSF contributing to that MRSI voxel.
To account for the relative fraction of GM and WM, two steps are required. First, mean value maps corresponding to 100% GM and WM were generated using the control subject group, and second, the difference between the single subject result and the control value specifically calculated for the tissue distribution of the test subject data was calculated. The mean value of each metabolite parameter, m, over the control subject group was calculated at each voxel within the brain for 100% GM and 100% WM, termed Rm,GM and Rm,WM. To derive these individual tissue mean values, data were selected for multiple voxels within the immediate neighborhood of the voxel under analysis and a regression of the metabolite parameter and the corrected WM content, f*WM, in each voxel applied, where f*WM = fWM / (fWM+ fGM). The intercept of the regression for f*WM = 0 and 1 then corresponded to the reference values of Rm,GM and Rm,WM. This procedure is referred to as a local regression analysis (LRA). The size of the selected region was set to 5 points spaced at a 4 mm interval (2 cm) in all dimensions, resulting in selection of voxels within a cube of 8 cc. The procedure then calculated the standard deviation of each parameter, σm, across the subject group, which was considered to apply equally to the GM and WM results. The resultant reference data therefore consisted of three maps, Rm,GM, Rm,WM and σm, for each of the three individual metabolite measures and the Cho/NAA ratio. These maps were only calculated if at least 10 studies provided a valid regression result at a voxel after applying the spectral quality exclusion tests.
The difference of the single-subject data relative to the reference mean value image was then calculated. To derive the reference image that accounts for the subject-specific tissue distributions a simulated image, Sm, was created based on the mean value reference maps and the tissue volume fractions for GM and WM, fGM and fWM, at each voxel of the single subject data as:
| [1] |
An image of the difference between the test subject metabolite map, Dm, and the simulated image for each metabolite was then created and scaled by the standard deviation from the normal subject values, to obtain a z-score image, Zm, as:
| [2] |
This analysis resulted in a map of the difference of the selected metabolite parameter from the individual subject data relative to the mean value from the control group, scaled by the standard deviation of the data at each voxel and accounting for the specific tissue distribution in the subject under analysis.
Differences were considered significant for p<0.05 with correction for multiple comparisons applied using the false discovery rate,11 and with the requirement of a contiguous cluster of at least 250 voxels (2 cc). A thresholded z-score map was then generated that showed only voxels that passed significance and cluster size requirements. The formation of the reference measurements and the calculation of the z-score maps was carried out using the PRANA module of the MIDAS software.12
Results
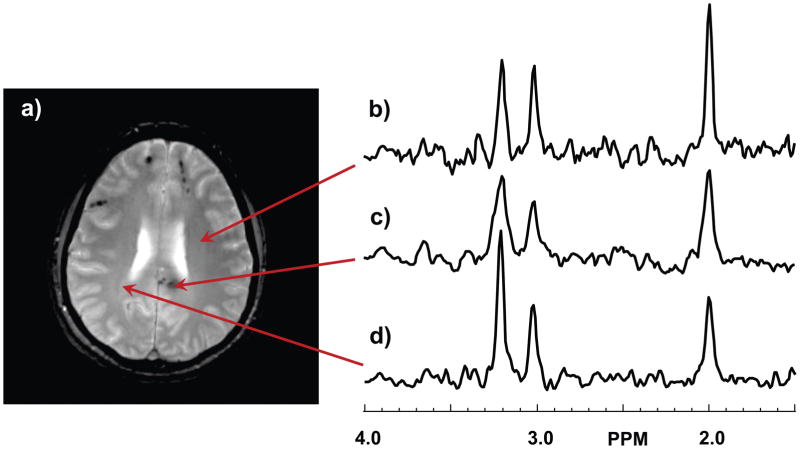
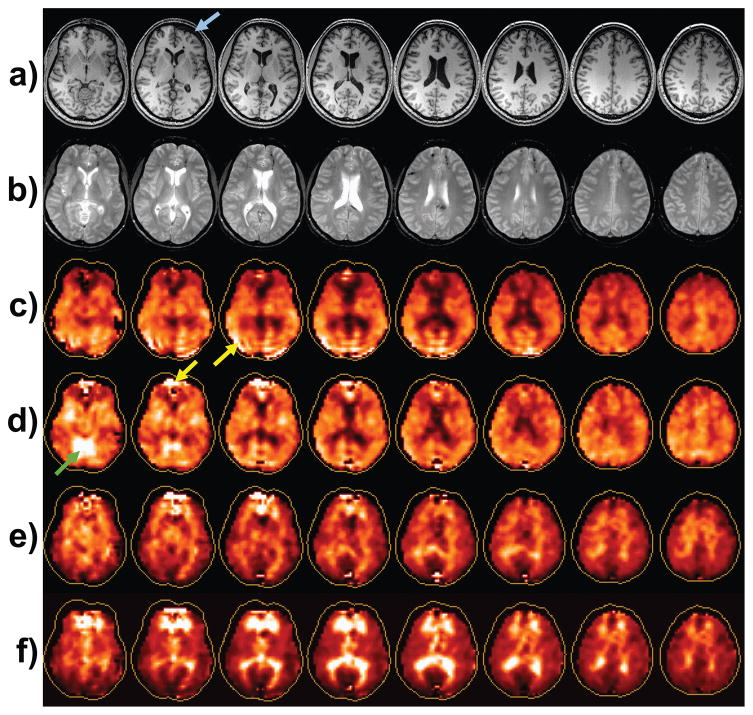
In Figure 1 are shown representative spectra from the TBI subject at the first time point study. The spectrum shown in Fig. 1b indicates a normal-appearing spectrum for white-matter at TE=70 ms., with NAA at 2.0 ppm, Cre at 3.0 ppm, and Cho at 3.2 ppm. The spectrum shown in Fig 1c corresponds to a region with a hemorrhage that is clearly visible on the GRE image, and shows increased Cho and decreased NAA, relative to the Cre peak amplitude, in comparison to that shown in Fig. 1b. The spectral linewidth is also larger than that of Fig. 1b due to the presence of the hemorrhage. A further increase of Cho and decrease of NAA can be seen in the spectrum in Fig. 1d, which is obtained from periventricular white matter where no signal abnormality was visible on either the T1-weighted or GRE images. In Fig. 2 are shown the MRI and metabolite maps for this first time-point study. Structural images showed a large subacute/chronic subdural hematoma on the left frontal surface (arrow) and multiple bilateral frontal punctate hemorrhagic foci at the grey/white-matter junction, which are most clearly visible on the GRE image (Fig. 2b), with a large focus in the splenium of the corpus callosum. The MRIs from the subsequent studies (not shown) showed that the subdural hemorrhage was almost fully resolved by the second study, while the white matter foci were visible for all studies with only mild reduction in size for the focus in the splenium at the time of the final study at 27.7 months.
Figure 1.
Example spectra from the first time-point study. In (a) is shown the gradient-echo image at the slice from which example spectra were selected. Spectra are shown in (b) for a normal region of the brain, (c) at the site of a hemorrhagic lesion, and (d) at a location with no MRI-observed abnormality but with a spectrum indicating abnormal N-acetylaspartate and choline peaks. The vertical scale of the spectra are in arbitrary intensity units.
Figure 2.
Example images from the first time-point study: a) The T1-weighted MRI; b) the T2-weighted MRI; and maps for N-acetylaspartate (NAA) (c), choline (Cho) (d), creatine, and Cho/NAA (f). Arrows refer to features discussed in the text. The contour surrounding each metabolite map represents the full extent of the brain, which indicates that the edge voxels are not fully sampled by the volumetric spectroscopic image acquisition.
The metabolite maps for NAA, Cre, Cho, and Cho/NAA are shown in Fig. 2. Visual interpretation of these individual metabolite maps requires familiarity with this type of data, for example to recognize that bright regions seen in all maps, e.g. as indicated by the yellow arrows, represent image artifacts, particularly in frontal regions where magnetic field inhomogeneity commonly has a detrimental effect on spectral quality; while the bright region seen on the Cre map (Fig. 2d) represents normal variation in the cerebellum and brain stem5. The NAA map shows a general signal reduction in central regions, while the strongest features are evident in the Cho/NAA map, where bright signals are seen in periventricular regions and frontal and parietal white matter. The spatial extent over which the volumetric MRSI acquisition obtains data of adequate quality is limited by the capability for magnetic field shimming over the whole brain volume and proximity to subcutaneous lipids. On average, over the group of control subject studies, the volume that met the quality criteria for a fitted spectral linewidth of ≤13 Hz was 66.7% of the brain volume (range 63.5 to 68%).
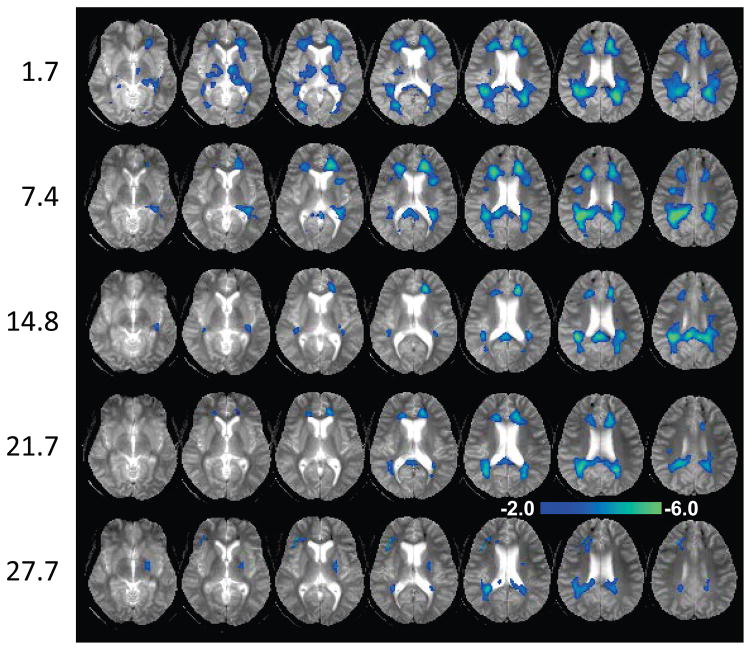
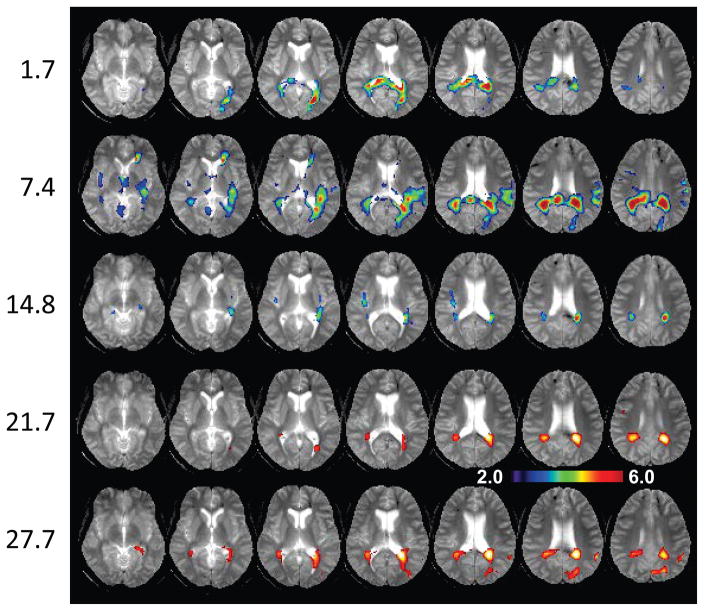
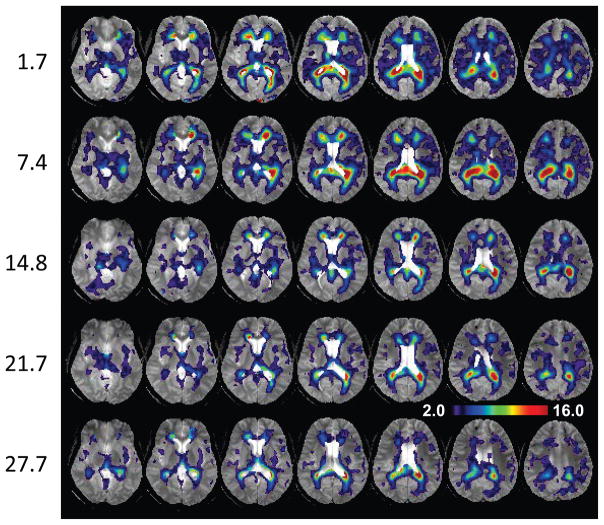
In Figures 3, 4 and 5 are shown z-score maps for NAA, Cho, and Cho/NAA respectively, for each of the five time-point studies, displayed as an overlay on the T2-weighted MRI at each time point. Axial images are shown at 6 mm spacing in the MNI space. Note that different color scales are used for the overlay of the z-scores, with the NAA z-score map showing negative values for −2.0 to −6.0; the Cho z-score map showing increased values for 2.0 to 6.0; and the Cho/NAA z-score map showing increased values for 2.0 to 16.0. Results for NAA indicate widespread reductions in the frontal and parietal white matter and including posterior corona radiata and splenium, reaching values of up to six times the standard deviation of the normal comparison group. These reductions progressively diminished over the course of the later time-point studies. The Cho maps indicate increased values predominately in parietal white matter and including the splenium of the corpus callosum. In comparison to the changes seen for NAA, the regions of altered Cho seen in the initial study were more localized, but then increased in volume and magnitude at the 7.4-month time point study. The subsequent studies show reduction of the Cho signal abnormality, leading to localized changes in the periatrial white matter at the 27.7-month study. Both the NAA and Cho maps showed altered metabolite levels beyond the areas of hemorrhagic involvement.
Figure 3.
The N-acetylaspartate z-score map overlaid on the gradient-echo MRI. Each row corresponds to data for one time point after injury, indicated on the left in months. Images are shown at 6 mm spacing. The scale of the color overlay image is shown for z = −2.0 to −6.0.
Figure 4.
The choline z-score map overlaid on the gradient-echo MRI, with the same layout as used for Fig. 3. The scale of the color overlay image is shown for z = 2.0 to 6.0.
Figure 5.
The choline to N-acetylaspartate ratio z-score map overlaid on the gradient-echo MRI, with the same layout as used for Fig. 3. The scale of the color overlay image is shown for z = 2.0 to 16.0.
Due to the opposite changes of the NAA and Cho abnormalities, the values of the Cho/NAA z-score map are greatly increased relative to the individual metabolite z-score maps, reaching a maximum value of z=30, with a distribution that reflect the locations seen in the NAA and Cho observations while additionally showing more extensive reductions within several white matter regions. While these changes appear to be more evident in the superior brain regions, this in part reflects the larger standard deviation seen in the more inferior slices of the reference maps, which reduces sensitivity to detection of significant changes. These spatially-variant differences in the standard deviation reflect the decreased sensitivity profile of the receiver coil and increased magnetic susceptibility variability in these brain regions. The Cre z-score maps (not shown) showed only scattered small regions of increased values that were not associated with the regions of altered NAA and Cho, suggesting no significant changes.
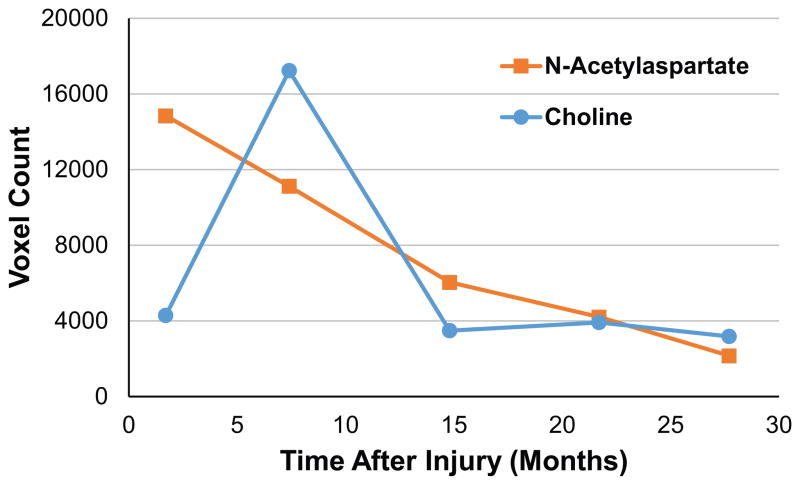
In Fig. 6 is shown a plot of the total number of voxels that reached significantly altered values for NAA and Cho relative to the control group, which summarizes the results shown in Figs. 3 and 4. This result shows a steady decrease in the number of voxels with significantly reduced NAA and the more transient increase at the second time-point in the number of voxels with significantly increased Cho, which then remained at a similar value for the remaining three studies.
Figure 6.
Plot of the count of the number of voxels reaching significantly altered values for N-acetylaspartate and choline, as a function of the time after injury.
Neuropsychological testing for the TBI subject reported summary test scores of −2.63, −1.23, −1.24, and −0.88. This indicates cognitive improvement during the first 7 months after injury, during the time that the metabolic abnormalities as indicated by the Cho distributions were increased. All areas of cognitive functioning were improved by one or two standard deviations at 22 months, although non-verbal abstract reasoning remained strongly affected, with a score of −2.27.
To evaluate the reproducibility of the z-score analysis method and the occurrence of false positives, the data from four healthy subjects who were not included in the comparison group were analyzed. Using the three single time-point measurements and the first study of the repeat measurement, the mean number of voxels reporting a z-score of greater than 2.0 were 2.4%, 4.2%, and 4.2% for the NAA, Cho, and Cho/NAA analyses. In all cases, the false positive voxels occurred in small patches that were randomly distributed over the images. One study exhibited increased errors in the Cho (and Cho/NAA) map due to poorer performance of the water suppression due to local motion, which could be easily identified as image artifacts. For the five time point repeat study, only one measurement resulted in a false positive rate of 3.9% for NAA, and most results had under 1% error.
Discussion
TBI is known to result in highly heterogeneous patterns of tissue damage and to have considerable variability in clinical outcome and recovery after injury;13 however, there is little known on the longitudinal evolution of the distributions of tissue injury. Structural MRI studies following moderate to severe TBI have shown significant reduction in the number of lesions between 7 days and 3 months after injury, with a smaller, but non-significant, further reduction by 12 months after injury.14 Newcombe et al.15 have reported on longitudinal MRI and DTI studies over a median time of 21 months that showed progressive reductions of brain volume and reduced fractional anisotropy in several white-matter tracts, with particularly strong findings for the corpus callosum, in agreement with other studies.16, 17 Using a z-score analysis of DTI, Lipton et al.18 reported on findings for mild injury that detected regions with both increased and decreased FA, the proportion of which varied at 3 months after injury and were significantly reduced after 6 months; however, progressive changes in individual subjects were not reported. Holshouser et al.3 have reported MRS region-of-interest measurements taken within one month after injury and again at six to twelve months, in a group of 31 subjects with moderate to severe TBI. Initial findings included decreased NAA/Cr and increased Cho/Cr, with the second measurement showing continued decrease of NAA/Cr in a group that had poor outcome, and a small recovery of Cho/Cr. The largest changes were found in the corpus callosum, which was also associated with outcome. No image-based analysis of longitudinal changes reflecting neuronal and glial metabolism in individual subjects has been previously reported.
This study has demonstrated that the evolution of altered metabolite distributions in the brain following TBI can be monitored in individual subjects using volumetric MRSI, with findings demonstrating a significant reduction of NAA and increase of Cho in central white-matter regions. The NAA alterations were shown to decrease steadily with time, indicating neuronal recovery, whereas the Cho alterations first increased at the time point of 7.4 months after injury, suggesting a period of reactive astrocytosis, after which the extent of altered values decreased, but with localized increases remaining relatively stable for over two years after injury. The sensitivity to detection of altered metabolism can be increased by mapping changes of the ratio of Cho/NAA, due to the opposite changes of these two metabolites that result from the injury. In addition to visualizing very large changes of this parameter these maps revealed lower levels of metabolic changes over a large fraction of the white matter that was not visible in the individual Cho or NAA z-score maps. The findings of reduced NAA and increased Cho are consistent with previous MRS studies of TBI, both at the subacute2 and chronic3 time points. The long-term alteration of Cho may indicate the presence of gliosis, which have been shown to be present many years after injury19, and glial scar formation20. PET imaging using a glial marker has also provided evidence of long-term activation of microglia, even at 17 years after injury;21 however, that study identified the greatest concentrations in subcortical locations, which is in contrast to the periatrial white matter locations of the increased Cho signal seen in the late time points of this study, suggesting that this finding may instead indicate chronic glial scar formation.
This report has additionally demonstrated that the use of an image analysis based on comparison with mean values from a normal control group greatly facilitates interpretation of metabolite maps. The image calculation method includes checks for data quality and accounts for tissue distributions, normal regional variations of metabolite concentrations, and the spatial variability of the accuracy of the measurement. Advantages of this image analysis approach include simplified interpretation of MRSI results and the availability of objective and quantitative information. These features are of particular value for evaluation of diffuse metabolic changes, such as that observed with MRSI studies of TBI. The main requirements for implementing this z-score image analysis is the availability of comparative normal subject data to act as the signal reference, which requires that consistent data acquisition and processing methods are used for the individual subject study and the reference data acquisitions.
The location of diffuse axonal lesions seen in this subject was consistent with the locations of most frequent findings following TBI 22, including the splenium of the corpus callosum, frontal lobes, and temporal horn of the lateral ventricles. Similarly, the superficial cortex of the frontal lobe is a common location for contusions to be seen 22. However, diffuse injury is also reported to be frequently observed along the gray/white matter interface, which was not seen in the observed metabolic changes, particularly at the later time points, which were largely concentrated in periventricular regions.
Limitations of this study include that this is a single case report, with a mild-to-moderate level of injury and the absence of an initial study at a more acute period. The study also used a moderate TE value that precluded measurement of other metabolites of interest, such as glutamate and myoinositol, which could have provided information on potential glial and excitatory responses.23 For future studies, however, short-TE acquisitions can be used to include this information,24 and more recent implementations of the MRSI acquisition mean that the relatively lengthy acquisition time can be reduced to be better suited for clinical studies.
Conclusion
This study has mapped altered concentrations of NAA and Cho in the brain following TBI, and shown that these changes slowly recover over a period of two years, although with persistent changes remaining in the periventricular white matter regions. Visualization of these changes was achieved by applying a z-score image analysis that has been specifically modified for use with MRSI data.
Acknowledgments
This study was supported by National Institutes of Health research grants R01NS055107, R01EB000822, and R01EB016064.
Footnotes
Disclosures:
The authors declare no conflicts of interest regarding this work.
References
- 1.Govindaraju V, Gauger G, Manley G, Ebel A, Meeker M, Maudsley AA. Volumetric proton spectroscopic imaging of mild traumatic brain injury. AJNR Am J Neuroradiol. 2004;25:730–7. [PMC free article] [PubMed] [Google Scholar]
- 2.Govind V, Gold S, Kaliannan K, et al. Whole-brain proton MR spectroscopic imaging of mild-to-moderate traumatic brain injury and correlation with neuropsychological deficits. J Neurotrauma. 2010;27:483–96. doi: 10.1089/neu.2009.1159. [DOI] [PMC free article] [PubMed] [Google Scholar]
- 3.Holshouser BA, Tong KA, Ashwal S, et al. Prospective longitudinal proton magnetic resonance spectroscopic imaging in adult traumatic brain injury. J Magn Reson Imaging. 2006;24:33–40. doi: 10.1002/jmri.20607. [DOI] [PubMed] [Google Scholar]
- 4.Cohen BA, Inglese M, Rusinek H, Babb JS, Grossman RI, Gonen O. Proton MR spectroscopy and MRI-volumetry in mild traumatic brain injury. AJNR Am J Neuroradiol. 2007;28:907–13. [PMC free article] [PubMed] [Google Scholar]
- 5.Maudsley AA, Domenig C, Govind V, et al. Mapping of brain metabolite distributions by volumetric proton MR spectroscopic imaging (MRSI) Magn Reson Med. 2009;61:548–59. doi: 10.1002/mrm.21875. [DOI] [PMC free article] [PubMed] [Google Scholar]
- 6.Gasparovic C, Song T, Devier D, et al. Use of tissue water as a concentration reference for proton spectroscopic imaging. Magn Reson Med. 2006;55:1219–26. doi: 10.1002/mrm.20901. [DOI] [PubMed] [Google Scholar]
- 7.Ashburner J, Friston K. Voxel-based morphometry - the methods. Neuroimage. 2000;11:805–21. doi: 10.1006/nimg.2000.0582. [DOI] [PubMed] [Google Scholar]
- 8.Mizumura S, Kumita S. Stereotactic statistical imaging analysis of the brain using the easy Z-score imaging system for sharing a normal database. Radiat Med. 2006;24:545–52. doi: 10.1007/s11604-006-0056-8. [DOI] [PubMed] [Google Scholar]
- 9.Zhang Y, Brady M, Smith S. Segmentation of brain MR images through a hidden Markov random field model and the expectation-maximization algorithm. IEEE Trans Med Imag. 2001;20:45–57. doi: 10.1109/42.906424. [DOI] [PubMed] [Google Scholar]
- 10.Collins DL, Zijdenbos AP, Kollokian V, et al. Design and construction of a realistic digital brain phantom. IEEE Trans Med Imag. 1998;17:463–8. doi: 10.1109/42.712135. [DOI] [PubMed] [Google Scholar]
- 11.Benjamini Y, Krieger AM, Yekutieli D. Adaptive linear step-up procedures that control the false discovery rate. Biometrika. 2006;93:491–507. [Google Scholar]
- 12.MIDAS. [accessed June 1 2017]; mrir.med.miami.edu:8000/midas.
- 13.Rosenbaum SB, Lipton ML. Embracing chaos: the scope and importance of clinical and pathological heterogeneity in mTBI. Brain Imaging Behav. 2012;6:255–82. doi: 10.1007/s11682-012-9162-7. [DOI] [PubMed] [Google Scholar]
- 14.Moen KG, Skandsen T, Folvik M, et al. A longitudinal MRI study of traumatic axonal injury in patients with moderate and severe traumatic brain injury. J Neurol Neurosurg Psychiatry. 2012;83:1193–200. doi: 10.1136/jnnp-2012-302644. [DOI] [PubMed] [Google Scholar]
- 15.Newcombe VF, Correia MM, Ledig C, et al. Dynamic Changes in White Matter Abnormalities Correlate With Late Improvement and Deterioration Following TBI: A Diffusion Tensor Imaging Study. Neurorehabil Neural Repair. 2016;30:49–62. doi: 10.1177/1545968315584004. [DOI] [PubMed] [Google Scholar]
- 16.Dinkel J, Drier A, Khalilzadeh O, et al. Long-term white matter changes after severe traumatic brain injury: a 5-year prospective cohort. AJNR Am J Neuroradiol. 2014;35:23–9. doi: 10.3174/ajnr.A3616. [DOI] [PMC free article] [PubMed] [Google Scholar]
- 17.Farbota KD, Bendlin BB, Alexander AL, Rowley HA, Dempsey RJ, Johnson SC. Longitudinal diffusion tensor imaging and neuropsychological correlates in traumatic brain injury patients. Front Hum Neurosci. 2012;6:160. doi: 10.3389/fnhum.2012.00160. [DOI] [PMC free article] [PubMed] [Google Scholar]
- 18.Lipton ML, Kim N, Park YK, et al. Robust detection of traumatic axonal injury in individual mild traumatic brain injury patients: intersubject variation, change over time and bidirectional changes in anisotropy. Brain Imaging Behav. 2012;6:329–42. doi: 10.1007/s11682-012-9175-2. [DOI] [PubMed] [Google Scholar]
- 19.Gentleman SM, Leclercq PD, Moyes L, et al. Long-term intracerebral inflammatory response after traumatic brain injury. Forensic Sci Int. 2004;146:97–104. doi: 10.1016/j.forsciint.2004.06.027. [DOI] [PubMed] [Google Scholar]
- 20.Burda JE, Bernstein AM, Sofroniew MV. Astrocyte roles in traumatic brain injury. Exp Neurol. 2016;275(Pt 3):305–15. doi: 10.1016/j.expneurol.2015.03.020. [DOI] [PMC free article] [PubMed] [Google Scholar]
- 21.Ramlackhansingh AF, Brooks DJ, Greenwood RJ, et al. Inflammation after trauma: microglial activation and traumatic brain injury. Ann Neurol. 2011;70:374–83. doi: 10.1002/ana.22455. [DOI] [PubMed] [Google Scholar]
- 22.Gentry LR, Godersky JC, Thompson B. MR imaging of head trauma: review of the distribution and radiopathologic features of traumatic lesions. AJR Am J Roentgenol. 1988;150:663–72. doi: 10.2214/ajr.150.3.663. [DOI] [PubMed] [Google Scholar]
- 23.Kierans AS, Kirov II, Gonen O, et al. Myoinositol and glutamate complex neurometabolite abnormality after mild traumatic brain injury. Neurology. 2014;82:521–8. doi: 10.1212/WNL.0000000000000105. [DOI] [PMC free article] [PubMed] [Google Scholar]
- 24.Goryawala MZ, Sheriff S, Maudsley AA. Regional distributions of brain glutamate and glutamine in normal subjects. NMR Biomed. 2016;29:1108–16. doi: 10.1002/nbm.3575. [DOI] [PMC free article] [PubMed] [Google Scholar]


