Abstract
Microaneurysms (MAs) are known as early signs of diabetic-retinopathy which are called red lesions in color fundus images. Detection of MAs in fundus images needs highly skilled physicians or eye angiography. Eye angiography is an invasive and expensive procedure. Therefore, an automatic detection system to identify the MAs locations in fundus images is in demand. In this paper, we proposed a system to detect the MAs in colored fundus images. The proposed method composed of three stages. In the first stage, a series of pre-processing steps are used to make the input images more convenient for MAs detection. To this end, green channel decomposition, Gaussian filtering, median filtering, back ground determination, and subtraction operations are applied to input colored fundus images. After pre-processing, a candidate MAs extraction procedure is applied to detect potential regions. A five-stepped procedure is adopted to get the potential MA locations. Finally, deep convolutional neural network (DCNN) with reinforcement sample learning strategy is used to train the proposed system. The DCNN is trained with color image patches which are collected from ground-truth MA locations and non-MA locations. We conducted extensive experiments on ROC dataset to evaluate of our proposal. The results are encouraging.
Keywords: Diabetic retinopathy, Color fundus images, Microaneurysms detection, Deep convolutional neural network, Reinforcement sample learning strategy
Introduction
Color fundus camera is a useful tool that can be used for the back of eye screening. The back of eye screening helps the physician to evaluate the eye for early detection of the potential diseases such as diabetic retinopathy (DR). DR is deduced as the most common cause of blindness in developed countries [1] and microaneurysms (MAs) are the early sign of DR. An expert physician can determine the locations of the MAs in fundus images manually, which is a challenging task. Therefore in the last two decades, fundus images based automatic fast and reliable MAs detection algorithms have been proposed [2–8].
Niemeijer et al. [2] grouped the MAs into three categories namely; subtle, regular and obvious based on their visibility in fundus images. Authors also aimed to detect the MAs which are close to vessels. Antal et al. [3] extended the Niemeijer’s work by adding extra two categories. These new two categories were constructed based on the MAs which are in macula and which are on the periphery of the image. Authors also determined the characteristics of the detected MAs. Later, Antal et al. [4] proposed another MAs detection method which was based on context aware approach. In the proposed method, a set of candidate MAs were extracted and then an ensemble method was used for classification. Fleming et al. [5] proposed an image enhancement based method for efficient MAs classification. The proposed method was based on contrast normalization and the authors compared their proposal with various other contrast normalization methods. Quellec et al. [6] proposed wavelet domain template matching approach for efficient MA localization. Authors adapted a sequence of wavelet families optimally for improving the classification accuracy. In [7], the authors proposed an efficient MAs detection model. The proposed method firstly applied a dark object filtering based method for candidate MAs extraction. Then, singular spectrum analyses of cross section profiles of MAs were extracted as statistical features. K-Nearest Neighbour (k-NN) classification was finally used to distinguish MAs and non-MAs. Another dark object diameter based method was proposed by Walter et al. [8]. Authors used a top-hat based method to determine the initial segments. After initial segmentation, a thresholding was employed to extract MA candidates. Kernel density estimation with variable bandwidth was employed to distinguish MAs and non-MAs. Wu et al. [9] proposed a novel approach for detection of MAs. Proposed method was consisted of four stages; pre-processing of input fundus images, candidate MAs extraction, feature extraction and classification. Authors considered the cross-section profiles of MAs for potential MAs candidate extraction. Statistical features and KNN classification is employed for efficient classification.
As deep learning has been attracted so many researcher nowadays, there have been some works where deep learning was used for MAs detection [10–15]. Shan et al. [10] used the popular Stacked Sparse Autoencoder (SSAE) for MAs classification in fundus images. Small image patches, where MAs were localized, were used in training SSAE. Authors mentioned that during training, SSAE learns high-level features from pixel intensities and these learned features were then fed into a classifier to categorize each image patch as MA or non-MA. Haloi et al. [11] proposed a deep learning scheme for discrimination of the MA and non-MA structures. The deep learning scheme was trained with dropout training procedure and max-out activation function. Authors indicated that they did not use any pre-processing stage during the classification of MAs. Abramoff et al. [12] dictated in their research work that by using a deep-learning based algorithm, the automatic detection of DR in fundus images has been improved significantly. Authors compared their deep learning based method’s results with some of the previously reported results and put forwarded the improvement. Gulshan et al. [13] proposed another deep learning based methodology for detection of the DR in fundus images. Deep convolutional neural network (DCNN) was used in order to detect DR. During the training of DCNN, retrospective development data set was used. Authors indicated that DCNN achieved high sensitivity and specificity for detection of the referable DR. In [14], authors used two DCNN namely Combined Kernels with Multiple Losses Network (CKML Net) and VGGNet with Extra Kernel (VNXK) for detection of the DR in fundus images. Authors used hybrid color space for improving the detection of the DR. The results on EyePACS and Messidor datasets showed the efficiency of the proposed on detection of the DR.
In this paper, we proposed a novel MAs detection methodology, which is based on a candidate MAs extractor, and a DCNN architecture. The developed method initially adopted a series of image pre-processing such as binary region of interest (ROI) mask generation, median and Gaussian filtering, background subtraction and bright pixels determination in order to facilitate the candidate MAs extraction. Candidate MAs extraction is carried out in five steps; obtaining the spiral sequence of gray scale values in a given window size, an increasing length segmentation approach is employed for partitioning of the spirally sequenced gray scale values. Two new images are generated in the third step. Thresholding of generated new images and removing the all connected and elongated structures is handled in steps four and five respectively. After candidate MAs detection, small image patches were collected for both true MAs and non-MAs. A data augmentation procedure was used to augment the number of training number of MAs. To do that, the input image patches were flipped on X, Y axis, and were rotated + 90°, respectively. The training of the DCNN was carried out with reinforcement sample learning strategy. The experimental works were carried out on ROC dataset [15]. The results showed the efficiency of the proposed method. We further compared our results with some existing methods on the same dataset.
The organization of the paper is as following; in the next section, the proposed method is introduced with its components. Pre-processing, candidate MAs extractor and DCNN concepts are introduced. In “Experimental works and results” section, the experiments and obtained results are presented. In “Conclusion” section, we conclude the paper.
Proposed method
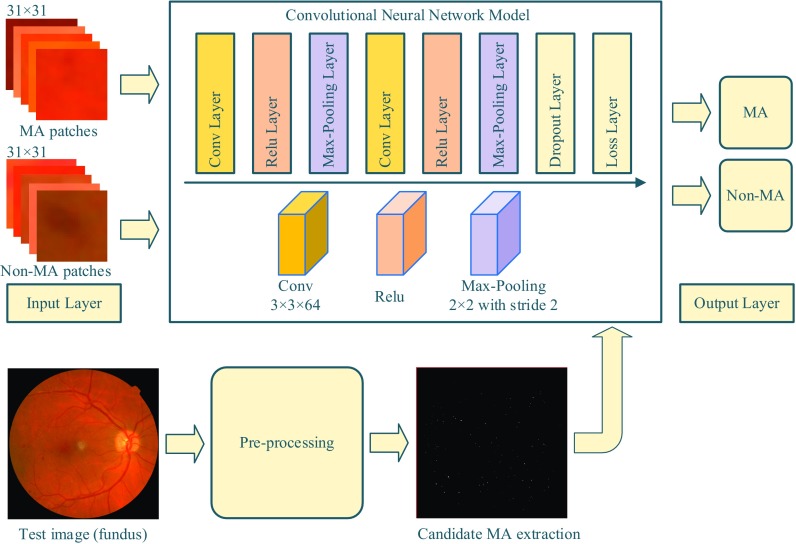
The proposed MA detection system is composed of three stages: image pre-processing, candidate MA extraction and DCNN based classification. While the pre-processing and candidate MA extraction stages were performed on the green channel of the retinal images, the DCNN stage was performed on three channels of the retinal images. An overall schema of the proposed method is given in Fig. 1.
Fig. 1.
Proposed MAs detection scheme
Pre-processing
This stage employs a series of pre-processing steps such as binary region of interest (ROI) mask generation, median and Gaussian filtering, background subtraction and bright pixel determination in order to facilitate the candidate MAs extraction. In addition, a shade correction method [5] was performed to prevent potential confusions of MAs and non-MAs. The shade correction operation is introduced as following;
A background image Imbg is constructed by applying a 45 × 45 median filter to the input green channel image Igch.
A Gaussian filtered (variance = 1 and width = 3) image Iggch is subtracted from the background image Imbg for obtaining a new image Igsb. The positive values in Igsb show the bright pixels in Iggch which means no MAs are on these pixels. The gray values of these pixels in Igsb are replaced by the values of their corresponding pixels in Imbg. Finally, the Iigsb image which is the inverted image of Igsb is fed into the next stage.
Candidate MA extraction
The aim of candidate extraction is to reduce the complexity of the proposed method. In addition, determination of all possible regions showing MA-like characteristics is another aim of candidate extraction [5]. In previous works, morphological transformations and pixel interactions are generally used to obtain potential MA candidates. Although these methods can extract a great deal of true MAs as candidates, there are still several challenging situations which cause this method ineffectively in detecting ground-truth MAs as candidates [5]. In this stage, we use the following steps to improve its performance:
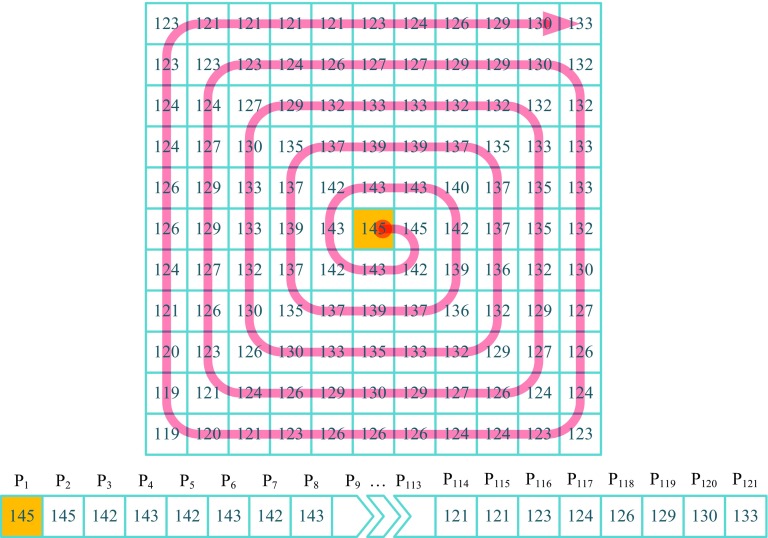
Step 1 To alleviate the deficiencies of the previous candidate extraction methods, in this work, we propose a new candidate extraction method. The proposed method is based on the spiral sequence of gray level values in a clockwise direction in a given local window size. An illustrative figure, which shows the spiral sequence of gray scale values on an 11 × 11 window, is shown in Fig. 2.
Fig. 2.
Spiral sequence of gray scale values
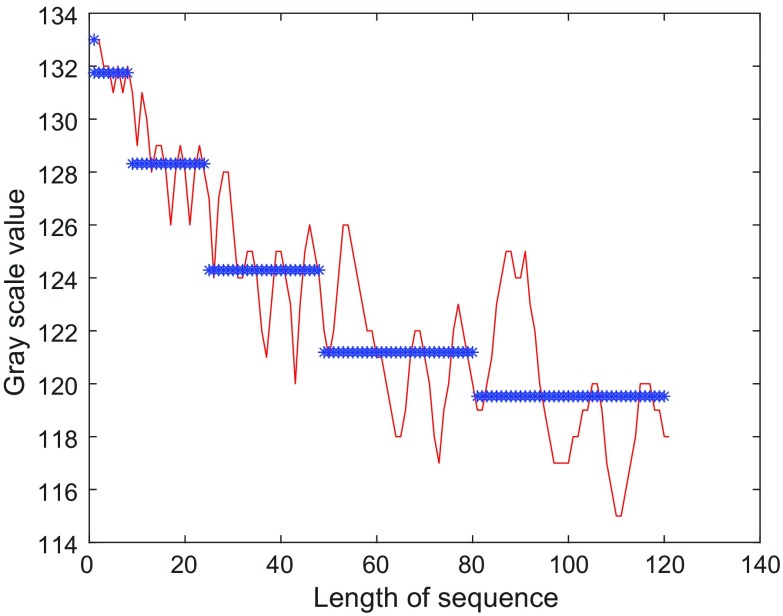
As MAs have a 2D Gaussian distribution, the spiral sequence of gray scale values inside a given window should have a gradually decreasing structure as shown in Fig. 3.
Fig. 3.
Segmentation of the spiral sequence of gray scale values
Step 2 After obtaining the spiral sequence of gray level values, an increasing length segmentation approach is employed for partitioning of the sequence, and mean gray scale values are calculated in each segmented sequence. This procedure is illustrated in Fig. 3. In Fig. 3, while the red curve shows the spiral sequence of the gray scales, the blue stars show both the segment borders and the related five mean gray scale values Mgsv.
Step 3 Two new images are constructed based on the obtained mean gray scale values as following;
| 1 |
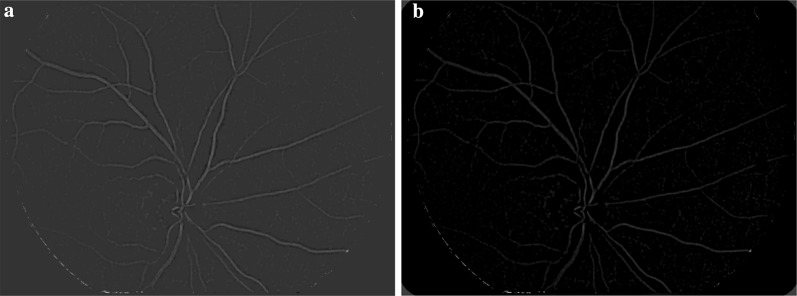
where max() shows the maximum gray scale value in the spiral sequence, max(Mgsv) shows the maximum of the mean gray scale values, and similarly, min(Mgsv) shows the minimum mean gray scale value. Figure 4 shows the images respectively.
Fig. 4.
a Inew1 image, b Inew2 image
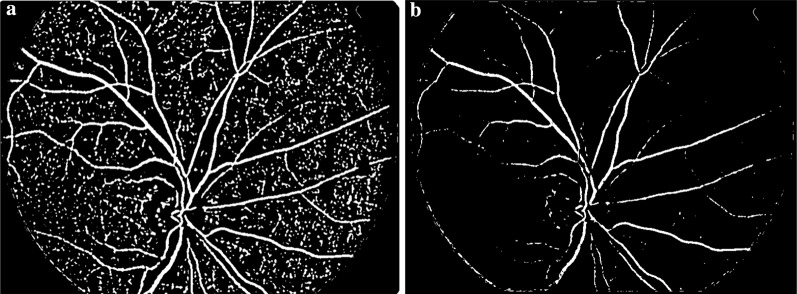
Step 4 The obtained images are then thresholded as shown in Fig. 5. The threshold Thrv value for images is chosen as bright pixels and the threshold ThrMAs value is determined heuristically.
Fig. 5.
Thresholded images. a Inew1 image, b Inew2 image
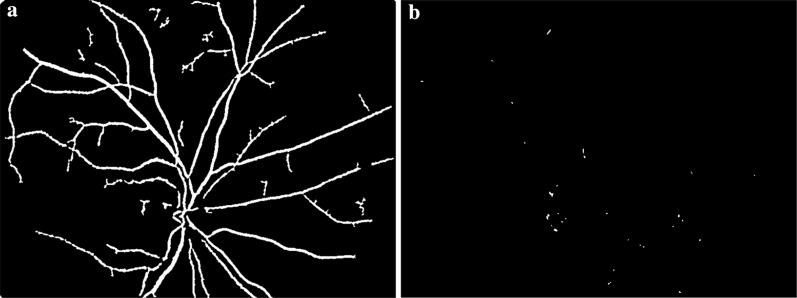
Step 5 The vessels in the thresholded are identified using a morphological connected component analysis operation and then subtracted from to obtain the candidate MAs as shown in Fig. 6. In other words, all connected, elongated structures in are eliminated in and the left regions are considered as Mas candidates.
Fig. 6.
a Detected vessel, b detected candidate MAs
Deep convolutional neural networks (DCNN)
DCNN is an important method for object detection [16]. For a given input image, DCNN incorporates spatial information between pixels into the nodes of network. Generally, DCNN architecture contains three basic layers: convolution, pooling, and fully connected layers. Convolution and pooling layers are embedded sequentially. Convolution and pooling operations construct the features. The classification is performed based on these features with the fully connected layer. In DCNN architecture, there is a huge number of parameter that needs to be tuned during DCNN training stage. The training of DCNN is handled with the conventional back propagation algorithm.
The DCNN architecture contains the following layers as:
Convolution layer: this layer contains a sequence of filters, whose coefficients are adjusted during the training process. In the training procedure of the DCNN, each filter is convolved across the width and height of the input volume in the forward pass.
Pooling layer: pooling layer aims to create a non-linear down-sampling. In other words, pooling partitions the input volume into a set of non-overlapping rectangle sub-regions and for each sub-region, the considered operation is applied for obtaining the output. The pooling operation reduces the spatial size of input which also reduces the amount of parameters and computation in the network.
Fully connected layer: the classification process is carried out in fully connected layer. Neurons in this layer have full connections to all activations in the previous layer.
Reinforcement sample learning strategy
The idea of reinforcement sample learning is to reinforce training the network on these samples with poor performance in the training procedure [17]. The detailed steps are described as follows:
Divide the samples into several batches randomly;
Train the model using all batches of samples in one epoch;
Identify the batches whose performance is lower than the criteria for the current epoch;
Tune the network only using these batches with more epochs;
Go to step 2 to train the model until the termination criterion are satisfied.
The criterion to identify the samples with poor performance is as follows:
| 2 |
where is the batch of samples at t epoch and is the classification error rate of batch at t epoch. N is the total number of batches. If the batch’s error rate is greater than the C, it will be trained using more epochs. In step 4, the network is tuned only on these batches with poor accuracy. The iteration epochs to tune are determined by a strategy based on their previous error rate. The idea is that the poorer performance, the more epochs will be employed to retrain the batch of samples. The repeated epoch number is determined by:
| 3 |
| 4 |
where is a function to map the absolute difference value of Er and C to epoch number. In our experiment, we use a piecewise function to implement it.
Experimental works and results
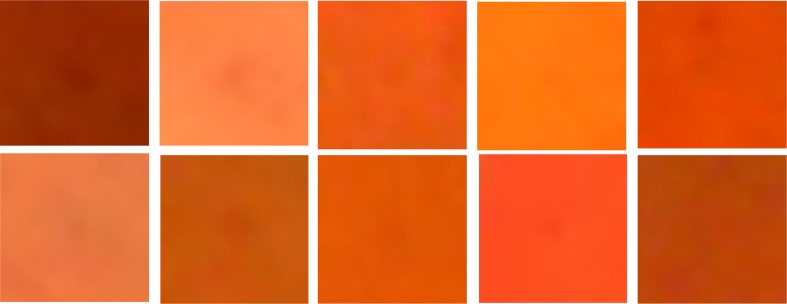
Experiments were conducted on the Retinopathy Online Challenge (ROC) database [15]. The ROC database contains two different sizes (768 × 576 and 1389 × 1383) of color images. There are in total 100 images that are equally partitioned into training and test sets. Only the ground-truth locations of the MAs are indicated for training set images. There are no ground-truth MA locations for test set images. Thus, we conducted our experiments and evaluated the detection results on training set images. As training dataset contains totally 50 images, 336 true MAs were indicated in 37 images. Randomly selected 289 of the true MAs were used in training and the rest was used for testing. Several samples of MA image patches are shown in Fig. 7. Data augmentation was applied before training of the DCNN. Therefore, training image patches were flipped on X, Y axis, respectively.
Fig. 7.
Sample patches for MAs
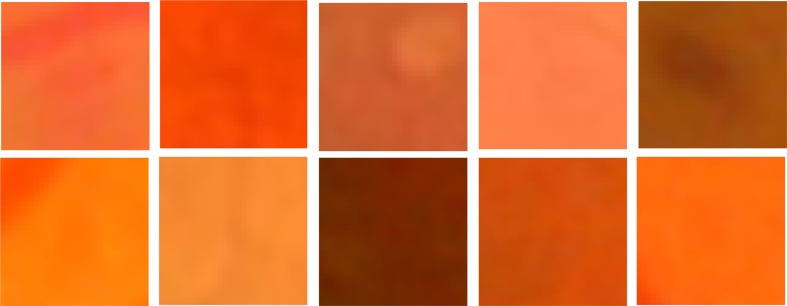
Further augmentation was handled by rotating the image patches + 90°. Thus, totally 1156 MA image patches were used in training of the DCNN. In addition, 5000 non-MA image patches were used in the training of the DCNN. Several non-MA image patches are shown in Fig. 8.
Fig. 8.
Sample patches for non-MAs
The DCNN model has 9 layers. The first layer was an input layer and after it, a convolution layer was adopted with 64 filters of size 3 × 3. A Relu layer followed the convolution layer. A pooling layer was next to Relu layer where maximum operator was used. In pooling layer, the filter size was 2 × 2 and the stride value was chosen as 2. In the second convolution layer, 64 filters of size 3 × 3 were considered and Relu and pooling layers followed it. In the second pooling layer, we used the same parameters as considered in the first one. A fully connected layer was next to second pooling layer. One dropout layer with 0.65 dropout probability was considered in the model. The DCNN model was ended with a loss layer where softmax was considered. The DCNN model was trained with reinforcement sample learning algorithm. The related training parameters and their values were given in Table 1. These values were tuned heuristically.
Table 1.
Training parameters and their values
| Parameter | Value |
|---|---|
| maxEpochEachIter | 5 |
| miniBatchSize | 100 |
| initialLearnRate | 0.001 |
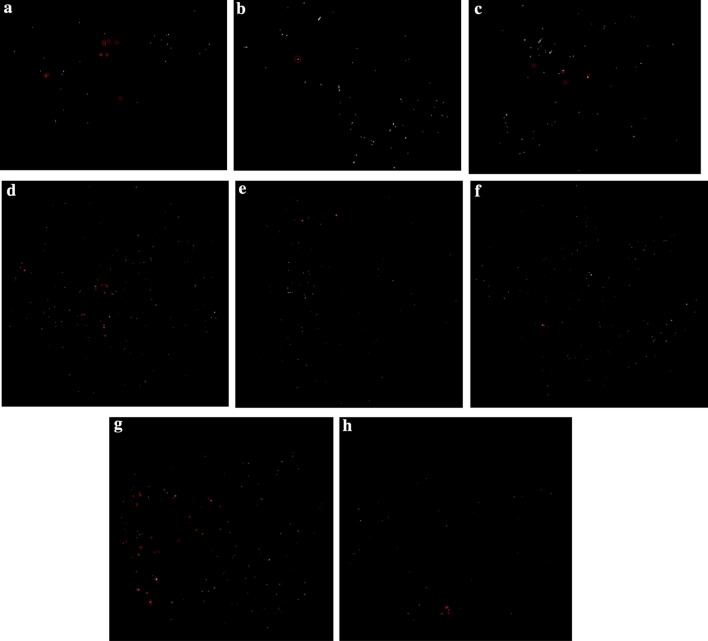
The extracted MA candidates for various test images were given in Fig. 8. The red circles show the ground truth MA locations and the white regions in the black background show the candidate MA locations. As seen in Fig. 9a, there were 9 true MA locations and proposed candidate detector found four of them correctly. In addition, in Fig. 9g, there were 25 true MA locations as indicated with red circles, our candidate detector extracted 15 of them correctly.
Fig. 9.
Detected candidate MAs, red circles show the ground-truth MA locations
The obtained DCNN results were also given in Fig. 10. As seen in Fig. 10, the blue circles show the detected the MAs location and the red circles show the ground-truth MAs location.
Fig. 10.

DCNN classification results, blue circles show the detected MAs and red circles show the ground-truth
As seen in Fig. 10a, four true positives and ten false positives were recorded. In Fig. 10b, the proposed system accurately detect the true MA location, however, nine false positives were produced. In addition, for Fig. 10e, two true positives and seven false positives were obtained.
We further compared our results with two other methods [9, 18] by calculating the Free-Response Receiver Operating Characteristic curve (FROC). FROC is a plot of operating points displaying the possible tradeoff between the sensitivity vs the average number of false positive detection per image. The sensitivity is calculated as follows:
| 5 |
where TP denotes true positive and FN denotes false negative.
The final score of a method was calculated as the average sensitivity at seven false positive rates (1/8, 1/4, 1/2, 1, 2, 4 and 8 false positives per image). Figure 11 shows the FROC curve of the proposed method and compared methods. These curves showed that our proposal was effective than the compared methods on detection of the MA locations. Table 2 also shows the sensitivities at seven false positive rates (1/8, 1/4, 1/2, 1, 2, 4 and 8 false positives per image) for the proposed method and the compared Wu’s method [9] and Lazar’s method [18]. While our method achieved an overall score of 0.221, Wu’s and Lazar’s methods achieved 0.202, and 0.152 scores, respectively.
Fig. 11.
The FROC curves of proposed method and compared methods
Table 2.
Sensitivities at predefined FP per image rate for the proposed method and compared methods
| 1/8 | 1/4 | 1/2 | 1 | 2 | 4 | 8 | |
|---|---|---|---|---|---|---|---|
| Lazar’s method | 0.037 | 0.055 | 0.103 | 0.162 | 0.196 | 0.223 | 0.285 |
| Wu’s method | 0.037 | 0.056 | 0.103 | 0.206 | 0.295 | 0.339 | 0.376 |
| Proposed method | 0.039 | 0.061 | 0.121 | 0.220 | 0.338 | 0.372 | 0.394 |
Conclusion
Computer aided diagnostic systems are quite popular recently and so many research papers published day by day [19, 20]. In this paper, a new MA detection method was proposed which was constructed on image pre-processing, candidate MAs extraction and DCNN based classification. The proposed method is applied on ROC training dataset and the obtained results are presented accordingly. The proposed method evaluation was done both visually, where the obtained MAs and the ground-truth MAs were shown on the fundus images. We further evaluated our method quantitatively with FROC curves and then compared the proposed method performance with two other methods performance’s according to the FROC curves. In the future, we plan to augment our MA and non-MA patches for increasing the efficiency of our method. To this end, we will use some other existing datasets. In the data augmentation procedure, hundreds of thousand true positive and false positive MA samples collection necessitate long time which we could not manage to handle it in a limited time interval.
Acknowledgements
We would like to thank the Scientific and Technological Research Council of Turkey (TÜBİTAK-1512, 2150121) for its financial support.
Publisher’s Note
Springer Nature remains neutral with regard to jurisdictional claims in published maps and institutional affiliations.
References
- 1.Who DR report http://www.who.int/blindness/causes/priority/en/index5.html.
- 2.Niemeijer M, van Ginneken B, Cree M, Mizutani A, Quellec G, Sanchez C, et al. Retinopathy online challenge: automatic detection of microaneurysms in digital color fundus photographs. IEEE Trans Med Imaging. 2010;29(1):185–195. doi: 10.1109/TMI.2009.2033909. [DOI] [PubMed] [Google Scholar]
- 3.Antal B, Hajdu A. Improving microaneurysm detection using an optimally selected subset of candidate extractors and preprocessing methods. Pattern Recogn. 2012;45(1):264–270. doi: 10.1016/j.patcog.2011.06.010. [DOI] [Google Scholar]
- 4.Antal B, Hajdu A. Improving microaneurysm detection in color fundus images by using context-aware approaches. Comput Med Imaging Graph. 2013;37:403–408. doi: 10.1016/j.compmedimag.2013.05.001. [DOI] [PubMed] [Google Scholar]
- 5.Fleming AD, Philip S, Goatman KA, Olson JA, Sharp PF. Automated microaneurysm detection using local contrast normalization and local vessel detection. IEEE Trans Med Imaging. 2006;25(9):1223–1232. doi: 10.1109/TMI.2006.879953. [DOI] [PubMed] [Google Scholar]
- 6.Quellec G, Lamard M, Josselin PM, Cazuguel G, Cochener B, Roux C. Optimal wavelet transform for the detection of microaneurysms in retina photographs. IEEE Trans Med Imaging. 2008;27(9):12301241. doi: 10.1109/TMI.2008.920619. [DOI] [PMC free article] [PubMed] [Google Scholar]
- 7.Wang S, Tang HL, Hu Y, Sanei S, Saleh GM, Peto T. Localising microaneurysms in fundus images through singular spectrum analysis. IEEE Trans Biomed Eng. 2016 doi: 10.1109/TBME.2016.2585344. [DOI] [PubMed] [Google Scholar]
- 8.Walter T, Massin P, Erginay A, Ordonez R, Jeulin C, Klein J-C. Automatic detection of microaneurysms in color fundus images. Med Image Anal. 2007;11:555–566. doi: 10.1016/j.media.2007.05.001. [DOI] [PubMed] [Google Scholar]
- 9.Wu B, Zhu W, Shi F, Zhu S, Chen X. Automatic detection of microaneurysms in retinal fundus images. Comput Med Imaging Graph. 2017;55:106–112. doi: 10.1016/j.compmedimag.2016.08.001. [DOI] [PubMed] [Google Scholar]
- 10.Shan J, Li L. A deep learning method for microaneurysm detection in fundus images. In: 2016 IEEE first international conference on connected health: applications, systems and engineering technologies (CHASE), Washington, DC; 2016. pp. 357–358.
- 11.Haloi M. Improved microaneurysm detection using deep neural networks; 2015. arXiv preprint arXiv:1505.04424.
- 12.Abramoff MD, Lou Y, Erginay A, et al. Improved automated detection of diabetic retinopathy on a publicly available dataset through integration of deep learning. Invest Ophthalmol Vis Sci. 2016;57:5200–5206. doi: 10.1167/iovs.16-19964. [DOI] [PubMed] [Google Scholar]
- 13.Gulshan V, et al. Development and validation of a deep learning algorithm for detection of diabetic retinopathy in retinal fundus photographs. Jama. 2016;316(22):2402–2410. doi: 10.1001/jama.2016.17216. [DOI] [PubMed] [Google Scholar]
- 14.Vo HH, Verma A. New deep neural nets for fine-grained diabetic retinopathy recognition on hybrid color space. In: 2016 IEEE international symposium on multimedia (ISM), San Jose, CA; 2016. pp. 209–215.
- 15.Dai B, Xiangqian W, Wei B. Retinal microaneurysms detection using gradient vector analysis and class imbalance classification. PLoS ONE. 2016;11(8):e0161556. doi: 10.1371/journal.pone.0161556. [DOI] [PMC free article] [PubMed] [Google Scholar]
- 16.LeCun Y, Bengio Y, Hinton G. Deep learning. Nature. 2015;521(7553):436–444. doi: 10.1038/nature14539. [DOI] [PubMed] [Google Scholar]
- 17.Sengur A, Gedikpinar M, Akbulut Y, Deniz E, Bajaj V, Guo Y. DeepEMGNet: an application for efficient discrimination of ALS and normal EMG signals. In: Březina T, Jabłoński R, editors. Mechatronics 2017. MECHATRONICS 2017. Advances in intelligent systems and computing, vol. 644. Springer, Cham.
- 18.Istvan L, Andras H. Retinal microaneurysm detection through local rotating cross-section profile analysis. IEEE Trans Med Imaging. 2013;32(2):400–407. doi: 10.1109/TMI.2012.2228665. [DOI] [PubMed] [Google Scholar]
- 19.Siuly, Wang H, Zhang Y. Detection of motor imagery EEG signals employing Naïve Bayes based learning process. Measurement. 2016;86:148–158. doi: 10.1016/j.measurement.2016.02.059. [DOI] [Google Scholar]
- 20.Siuly S, Li Y. Discriminating the brain activities for brain–computer interface applications through the optimal allocation-based approach. Neural Comput Appl. 2015;26(4):799–811. doi: 10.1007/s00521-014-1753-3. [DOI] [Google Scholar]


