Abstract
Many biological molecules are by their nature amphiphilic and have the ability to act as surfactants, stabilizing interfaces between aqueous and immiscible oil phases. In this paper, we explore the adsorption kinetics of surfactin, a naturally occurring cyclic lipopeptide, at hexadecane/water interfaces and compare and contrast its adsorption behaviour with that of synthetic alkyl benzene sulfonate isomers, through direct measurements of changes in interfacial tension upon surfactant adsorption. We access millisecond time resolution in kinetic measurements by making use of droplet microfluidics to probe the interfacial tension of hexadecane droplets dispersed in a continuous water phase through monitoring their deformation when the droplets are exposed to shear flows in a microfluidic channel with regular corrugations. Our results reveal that surfactin rapidly adsorbs to the interface, thus the interfacial tension equilibrates within 300 ms, while the synthetic surfactants used undergo adsorption processes at an approximately one order of magnitude longer timescale. The approach presented may provide opportunities for understanding and modulating the adsorption mechanism of amphiphiles on a variety of interfaces in the context of life sciences and industrial applications.
Keywords: biosurfactant, adsorption, liquid–liquid interface, microfluidics
1. Introduction
The adsorption of surfactants at the interface between two immiscible fluids plays an important role in many technological and industrial applications, including mineral flotation in the recovery of valuable ores, corrosion inhibition, dispersion of solids and oil recovery [1–5]. In their soluble form, amphiphilic molecules possess the propensity to form micelles [6], which, in general, have to dissociate prior to their adsorption onto the interfaces. Understanding the interplay between micelle dissociation and interfacial adsorption of active molecules to liquid/liquid interfaces is of key importance for achieving control of both emulsion stability and interface properties. Thus, much effort has been devoted to studying the thermodynamics and kinetics of the adsorption process with several of quantitative models proposed [7,8]. In this paper, we set out to probe the mechanism of adsorption of the biosurfactant surfactin to oil/water interfaces. Surfactin is naturally produced by biologically active microorganisms as a cyclic heptapeptide (Glu-Leu-D-Leu-Val-Asp-D-Leu-Leu). It is a bacterial cyclic lipopeptide, known for its ability to effectively act as a surfactant [9] along with special biological properties [10] and has emerged as a desired stabilizer with ideal properties in the pharmaceutical, cosmetics and food additives areas. In particular, the biodegradability and low toxicity of surfactin coupled with its ability to enhance the biodegradation and solubilization of low solubility compounds has made it an attractive additive to hydrocarbon-based surfactants and a promising candidate for microbial-enhanced oil recovery and bioremediation of environmental pollutants [11]. Indeed, currently most industrial applications use hydrocarbon-based amphiphililic molecules as surface active agents which, however, can display high toxicity or exhibit environmentally problematic properties, making their large-scale use potentially unsafe. In this study, we used two isomers of sodium cetyl benzene sulfonate (SCBS) as representative synthetic surfactants with properties analogous to those of petroleum sulfonate, which is a widely applied surfactant in enhanced oil recovery.
Here, we study the molecular events associated with adsorption processes directly by determining the changes in the interfacial tension of the oil/water interface as a function of time. In order to gain insights into the mechanism of adsorption, kinetics measurements in the millisecond range are required. A variety of techniques have been explored for probing the interfacial tension of liquid/liquid emulsions, such as maximum bubble pressure [12,13], drop volume [14,15] and dynamic interfacial tensiometry involving pendant drop [16] and spinning drop approaches [17,18]. These conventional bulk techniques, however, are limited by the predominance of diffusion at large scales which can obscure the dynamics intrinsic to the adsorption process itself. To elucidate the mechanism and the kinetics of this adsorption process, the measurements must be performed in kinetically controlled or mixed regimes, which are dominant at small volume systems or in the presence of convection. Compared with conventional methods, microfluidics always provide highly sensitive and accurate analytical steps [19,20]. Thus, to overcome these limitations we employed a microfluidic interfacial tensiometry approach [21]. This method relies on the use of physical constrictions and expansions to measure the deformation of a droplet in the fluid flow field. Tracking the droplet deformation during its flow through physical constrictions formed by varying the channel width can be used to infer its interfacial tension and hence the amount of surfactant molecules that are adsorbed to the interface at a given time point. As the droplet's interfacial tension can be measured at a millisecond resolution, including at the early time points immediately following the droplet generation, this dynamic microtensiometry tool enables the adsorption process to be followed prior to its equilibration. Additionally, the small volume of the droplets produced, in combination with the presence of convective currents present in the system enable kinetically controlled regimes to be probed. We first derived an empirical relationship between the deformation of individual microdroplets and the interfacial tension at its water/hexadecane interface within the specific geometry of our device. By combining these results with the equilibrium measurements obtained by conventional spinning drop tensiometry, we obtained quantitative data on the time resolved decay in interfacial tension and associated surfactant adsorption curves that were further used to develop a model for obtaining the adsorption and desorption rate of surfactants at the oil/water interface.
2. Material and methods
2.1. Surfactants
Surfactin was produced by Bacillus subtilis TD7 cultures [22]. To isolate the surfactin from the culture medium, we first adjusted the pH of the fermentation broth to 8.0 and then subjected it to centrifugation at 5000 r.p.m. to remove the bacterial cells. In order to exploit the low solubility of surfactin in acidic environments, we next lowered the pH to 2 through the addition of hydrochloric acid and collected the precipitate. The surfactin was obtained by extraction from the precipitate with diethyl ether followed by reversed-phase high-performance liquid chromatography. The molecular structure of surfactin is shown in figure 1. SCBS was synthesized by Qilan company. The results of ESI-MS, 1HNMR and 13CNMR showed the purity to be greater than or equal to 95%. All the surfactants were prepared in 10 mM phosphate buffer at a pH of 7.4 and the surfactant concentrations ranged from 0.1 to 0.5 mM—all these values are above the critical micelle concentration (CMC) of the three surfactants [23,24] (table 1).
Figure 1.
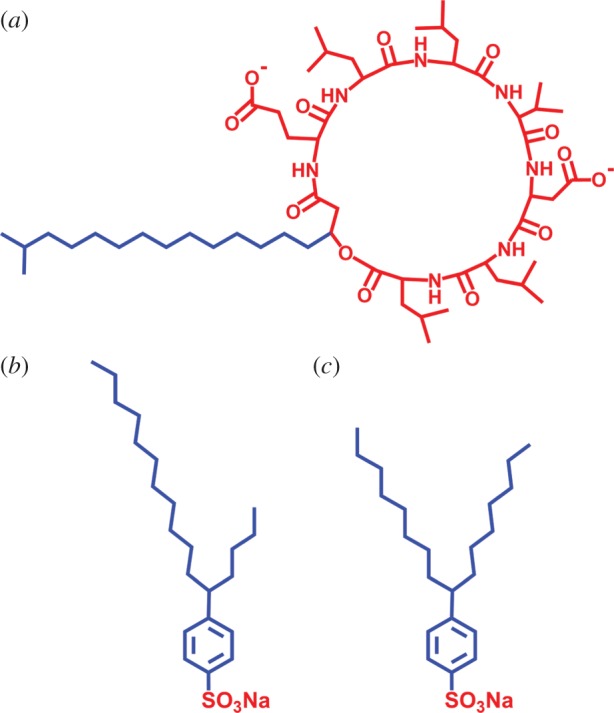
The structure of surfactants: (a) surfactin; (b) 5-SCBS; (c) 8-SCBS. Blue and red parts represent hydrophobic and hydrophilic groups, respectively.
Table 1.
Physicochemical properties of the surfactants.
| surfactants | CMC mmol l−1 | γ∞ (at 0.1 mM) mN m−1 | Γ∞ mmol m−2 |
|---|---|---|---|
| surfactin | 2.3 × 10⁻² | 1.985 | 1.62 × 10⁻³ |
| 5-SCBS | 1.2 × 10⁻² | 0.354 | 4.97 × 10⁻³ |
| 8-SCBS | 1.1 × 10⁻² | 0.064 | 2.58 × 10⁻³ |
2.2. Methods
2.2.1. Dynamic light scattering measurement
The diameters of the micelles formed by the three surfactants used in this work were determined by dynamic light scattering (DLS) measurements (Nano-ZS; Malvern Instruments Ltd, UK) at 45°C. The hydrodynamic radii were determined at three different concentrations—Ctot = 0.1 mM, 0.25 mM and 0.5 mM—corresponding to the values at which the adsorption process was probed. All the measurements were performed at a scattering angle of 173°. The average micelle diameters are shown in electronic supplementary material, table S1 (the values shown in the table are the averages of the measurements at the three concentrations) and the number size distributions are shown in electronic supplementary material, figure S1.
2.2.2. Spinning drop tensiometry
The interfacial tension between hexadecane and water was measured by the spinning-drop tensiometry approach at 45°C using a SVT 20 tensiometer (Dataphysics, Germany) operated at 4500 r.p.m. The values for the interfacial tensions were recorded at 5 min intervals, and were assumed to have equilibrated when consecutive readings agreed to within 0.001 mN m−1. The volumetric ratio between the surfactant solution and the hexadecane in the spinning-drop tensiometer was set to be 2000. All the measurements were performed in 10 mM phosphate buffer at a surfactant concentration of 0.1 mM.
2.2.3. Microfluidic device design and measurements
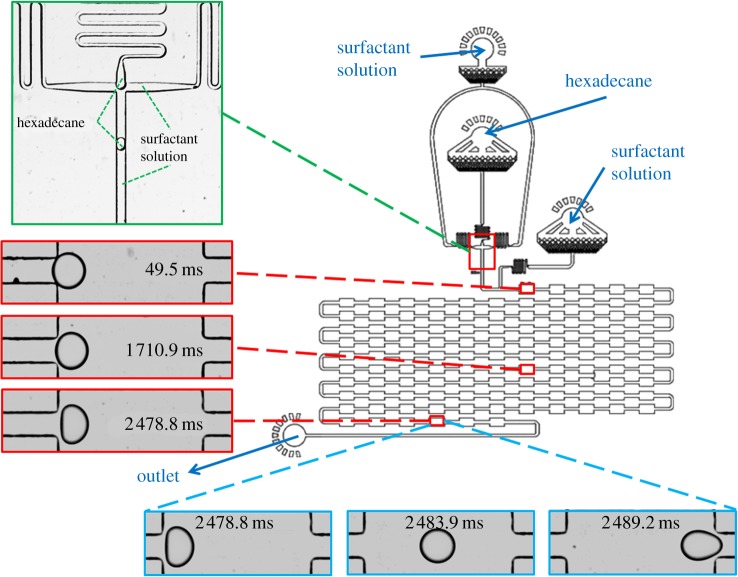
Microfluidic devices were fabricated using standard photolithography techniques [25]. The microfluidic channels were patterned into polydimethylsiloxane (PDMS; Sylgard184, Dow Corning) using SU-8 photoresist (SU8-3050 Microchem) on silicon masters. PDMS devices were then plasma bonded to glass microscope slides using oxygen plasma (Diener Ecectronics) to form sealed devices. To form the hydrophilic surface, the sealed devices were retreated in a plasma oven for 500 s and were then filled with water to maintain the hydrophilicity of the channel. Hexadecane droplets were produced in a flow focusing microfluidic device. Droplet formation was followed by a delay line with 110 successive chambers each 150 μm in width and 300 μm in length. The chambers were connected by 50 μm wide and 300 μm long constrictions and all the channels (figure 2) were fabricated to a height of 50 μm.
Figure 2.
Device design with 110 successive chambers 150 μm wide and 300 μm long, adapted from Brosseau et al. [21]. Droplets are produced in a flow focusing droplet maker (green enlarged area) and then flowed into a series of chambers. The two-dimensional projection of the contour of the droplets remained to a good approximation circular at the entrance to the first chamber but the observed deformation gradually increased as the droplet moved along the delay line (red enlarged area). It takes approximately 10 ms for a droplet to flow through each chamber (blue enlarged area).
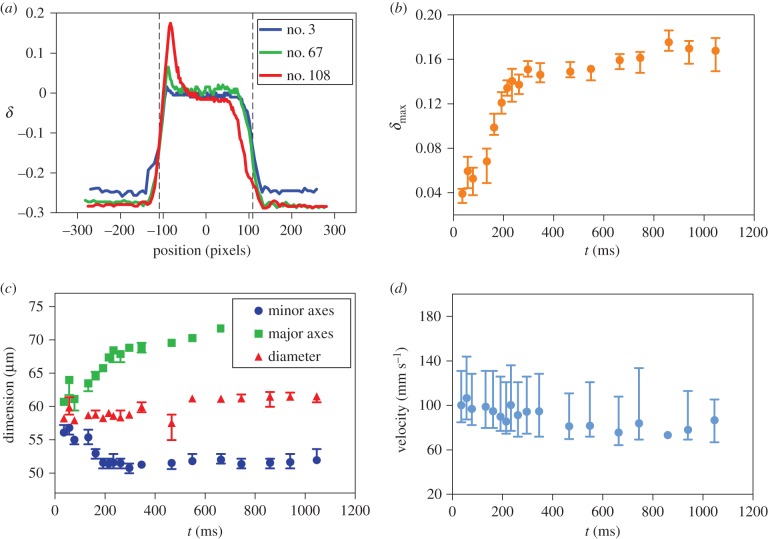
The devices were then mounted on a microscope with a temperature controlled stage fixed to 45°C. The fluids were injected by glass syringes (Hamilton, 1 ml) using automated syringe pumps (Nemesys Gmbh) to control precisely the flow rates of the fluids in the channels. Droplet deformation was recorded using a high-speed camera operating at a frame rate of 15 000 fps and all the images were processed with home-built image analysis tools. The lengths and widths of droplets flowing through the chambers were extracted by detecting the two-dimensional projection of the contour of the droplets. The relative deformation of each droplet, δ, at each specific time point was defined as δ = (L − l)/(L + l), where L and l are the major and the minor axes of the droplet. The deformation profile in each specific chamber (figure 3a) was used to determine the maximum deformation in that chamber and the variation in the latter parameter with time as the droplet moves along the delay line is shown in figure 3b–d.
Figure 3.
(a) The relative deformations of the droplets flowing in the chambers are quantitatively described using the relationship δ = (L − l)/(L + l). Maximum deflections were defined as the peak values in each of the chambers. The dashed lines show the boundaries of the chamber. The variation in (b) the maximum deformation, (c) droplet dimension and (d) velocity in time when the droplet flows through the delay line and the deformation reaches maximum (data shown on the example of droplets in 0.5 mM surfactin solution). Green and blue symbols in (c) represent the maximum value of the major and minor axes of the droplet, respectively, and the red symbols are the averaged droplet diameters when the relative deformation was δ < 0.01. The error bars correspond to the highest and lowest values.
3. Results and discussion
We first characterized the interfacial tensions of the synthetic surfactants and the biosurfactant solutions under equilibrium conditions. To this effect, the water/hexadecane interfacial tension was measured using a spinning drop interfacial tensiometer. Using this approach, a lower density drop (hexadecane) was injected into a spinning tube filled with a higher density continuous phase (surfactant solution). The droplet deformation was used to obtain the dynamic interfacial tension. In such bulk experiments, equilibrium state was reached within 500 s, a timescale dominated by diffusive mass transport (electronic supplementary material, figure S2a). The interfacial tensions of surfactin, 5-SCBS and 8-SCBS obtained through these measurements are reported in table 1.
We next focused on probing the dynamics of the molecular events underlying adsorption. In bulk experiments, the adsorption timescale is typically governed by diffusive mass transport to the interface which can be slow and thus mask more rapid dynamics [26]. A convenient strategy to address this limitation is to work at microfluidic lengthscales where diffusion times are reduced and the presence of convective currents in multiphase flows allows rapid mass transport. In such microfluidic systems, the interfacial tension of a microdroplet can be probed by exposing it to hydrodynamic stresses and monitoring the resulting deflection, δmax, in real time using kilohertz rate timelapse microscopy. We achieved repeated application of a well-defined hydrodynamic stress through the use of periodic constrictions in a longer channel following a droplet maker element integrated into a single microfluidic device design, following the strategy of Brosseau et al. [21]. The data in figure 3a–b show that the droplet deformation induced in the subsequent constrictions is not constant throughout the entire chamber sequence, but rather varies in time following exposure of the interface to the surfactants. The delay time achieved through the advective transport of the droplet from one chamber to the next is approximately 20 ms, thus allowing access to measurements of the evolution of the interfacial tension on millisecond timescales.
In order to relate the measured deformation quantitatively to the interfacial tension we consider two dimensionless numbers [21] expected to control the process: (i) the capillary number defined as the ratio between viscosity force and surface tension Ca = ηu/γ, where η is the viscosity of the continuous phase, u is the advection velocity and γ is the oil/water interfacial tension; (ii) a geometrical factor R* = 2R/W that relates the droplet radius R to the channel width W. As such, on dimensionality grounds, we expect to be able to express the maximal deformation of droplets as a function of these two dimensionless parameters δmax ≡ δmax(Ca, R*).
In our microfluidic experiments, the droplet deformation reached a plateau within the experimental time only for the surfactin system. The latter was thus used as the basis for performing the calibration between the spinning drop tensiometry and the microfluidic tensiometry measurements. By keeping the capillary number constant, figure 4b, we note that the deformation δmax scales with the normalized droplet diameter R* (δmax∝R*1.1). The variation in the droplet diameter in these data was obtained by varying the ratio of the flow rate of the dispersed oil phase relative to that of the continuous aqueous phase but keeping their sum constant. Similarly, by varying the capillary number through changing the flow rates of both continuous and the dispersed phase while keeping their ratio constant and maintaining the normalized droplet diameter constant, figure 4a, we obtain δmax ∝ Ca0.5. Overall, a good collapse of the data onto the following master curve was found
| 3.1 |
with  as a fitting constant.
Figure 4.
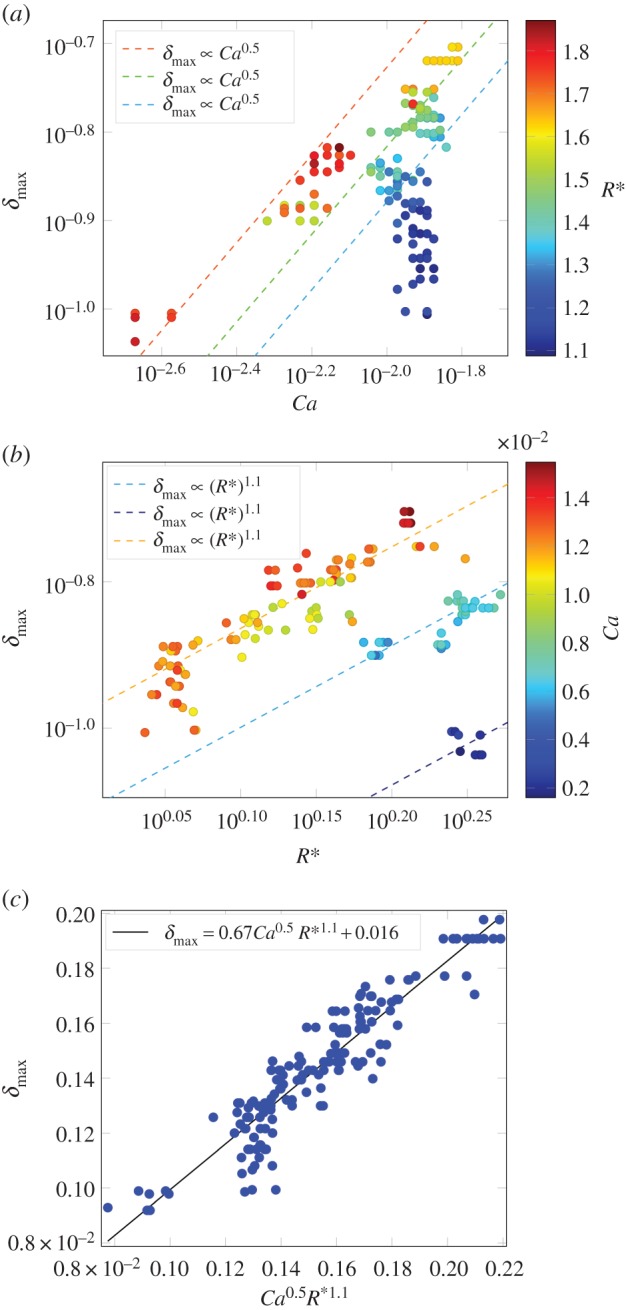
The maximal deformation of droplets as a function of (a) droplet capillary number and (b) dimensionless droplet diameter for 0.1 mM surfactin solution by microfluidic devices. (c) A linear relationship confirms the data indeed obey a power law δmax ∝ Ca0.5R*1.1.
The desired behaviour can be produced by explicitly considering the formation and dissociation of micelles.
In all experiments, the viscosity of the continuous phase was maintained at 0.5897 mPa s. The accuracy of this relationship can be seen by the fact that the data acquired at different flow rates and droplet sizes collapses onto a single master curve when considered as a function of the two dimensionless numbers (figure 4c). Both the equation derived in this work and in [21] rationalize that the relative deformation depends on the capillary number Ca and on the normalized droplet diameter R*. The precise exponents and coefficients in the equations, however, vary due to differences in device geometries and hence the flow fields inducing the deformation (e.g. δmax ∝ Ca2/3R*3.7 for the geometries used in [21].)
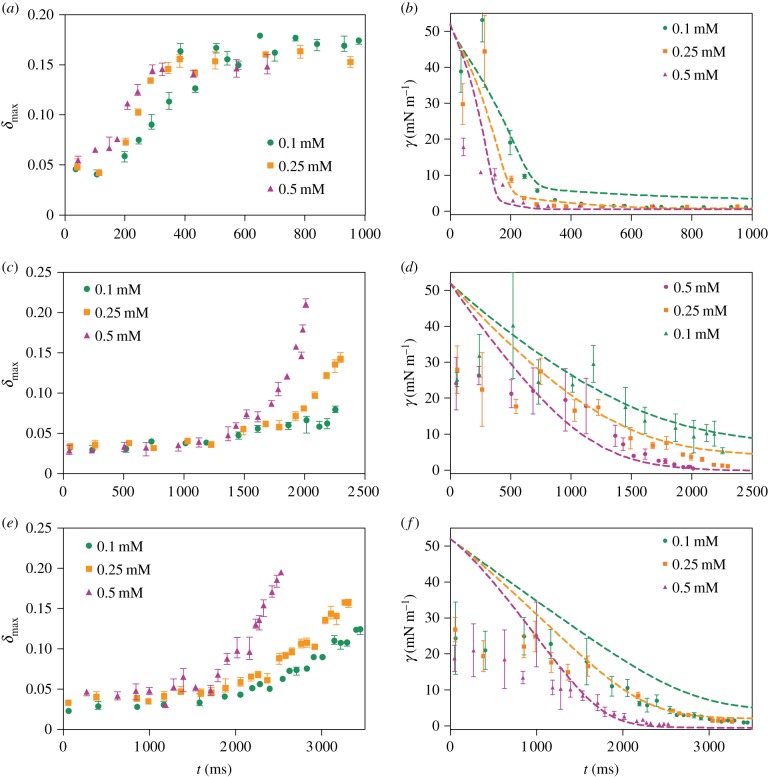
By using this strategy, we were able to acquire data on the dynamics of the interfacial tension on oil/water interface during the adsorption of both surfactin and SCBS. When the droplets first entered the aqueous solution the surfactant concentration at the droplet surface was low and the droplets retained their spherical shapes rapidly. The combined effect of the small deflection at early time points and their fast movement leading to the inability to record the exact maximum value of the deflection even with a high-speed camera proved challenging to accurately record interfacial tension values larger than around 20 mN m−1. To overcome this limitation and still monitor the adsorption process over longer time periods, we lowered the flow rates of both the continuous and the dispersed phase. This enabled us to probe both the deformations closer to their equilibrium values which are reached only over longer time periods, and to record the images closer to the maximal deformation occurring very rapidly after the droplet enters the expansion chamber in the channel. The recorded kinetic curves reporting on surfactant adsorption (figure 5) reveal a strikingly different behaviour between the different surfactants studied—namely, the adsorption of surfactin reaches a steady state within approximately 300 ms, while the changes in the interfacial tension subsequent to SCBS adsorption under the same conditions proceeded at a significantly longer timescale.
Figure 5.
The maximal deformation of droplets incubated with pure surfactant and the derived interfacial tensions at the hexadecane–water interface: (a,b) surfactin, (c,d) 5-SCBS and (e,f) 8-SCBS. In each plot, three surfactant concentrations are tested, i.e. 0.1 mM (green circles), 0.25 mM (orange squares) and 0.5 mM (purple triangles). Global fits (dashed lines) are performed based on our model with the parameters listed in table 2.
Next, we relate these observations to information on the molecular processes underlying the adsorption behaviour. A basic model describing surface adsorption processes is the Langmuir model:
| 3.2 |
where the concentration of free binding sites is (Γ∞ − Γ(t)), the concentration of the adsorbing species is c(t) and the rate constants of adsorption and desorption are given by ka and kb, respectively.
There are two basic possibilities for how the adsorption process evolves; the adsorbing species could be monomeric or they could be in the form of micelles as structures which dissociate upon adsorption. In the former case, c(t) = CMC, the system should show no dependence on the total monomer concentration because of being above its CMC. The equilibrium surface concentration of the surfactant, Γeq(c), depends on the concentration of surfactant in solution, c. Above the CMC, surfactant monomers begin to form aggregates in the bulk in order to minimize the free energy of the system [27]; as such the surfactant concentration on the surface above the CMC is therefore independent of the total surfactant concentration Γeq(cCMC) [27]. In the latter case, however, c(t) is the micelle concentration and we would expect the coverage at equilibrium to be dependent on the total surfactant concentration. The experimental data show that the kinetics are dependent on the total concentration, while the equilibrium coverage cannot be reproduced by a simple Langmuir model. Therefore, this model does not fit the data (electronic supplementary material, figure S3). Furthermore, earlier works [28,29] suggest that surfactants’ micelle diameter are usually twice the thickness of the adsorption layer, which indicates that it has to be the individual molecules rather than their aggregates that adsorb to the interface. A previous study [28] found that at pH 7.5 surfactin adopts a ball-like structure with a thickness of 14 Å at the air/water interface and the overall structure of the adsorbed surfactin layer appears to be identical to a thickness of 15 Å at a hydrophobic octadecyltrichlorosilane-coated silicon surface. They further showed that the micellar structure of surfactin was a sphere with an overall diameter of 50 Å, which is similar to our DLS results with a diameter of 4.45 nm. Earlier work [29] showed that the thickness of the adsorption layer of symmetric and asymmetric sodium para-dodecyl benzene sulfonate, LAS6 (phenyl ring is joined to the middle of the alkyl chain) and LAS4 (phenyl ring is functionalized at the ‘C4’ position), ranged from 20 to 31 Å at the air/water interface by a single layer. Small angle neutron scattering data on this system [29] showed that LAS4 and LAS6 are elliptical with an inner core radius of around 15 Å, an outer shell radius around 17 Å and an elliptical ratio of approximately 1.5. According to these results, the overall diameter of LAS is approximately 64 Å with an elliptical ratio of 1.5. Our surfactants, SCBSs, are a homologue of sodium dodecyl benzene sulfonate with an additional four carbon atoms. For this reason, it is expected that they should have similar properties in both micellar size and adsorption layer.
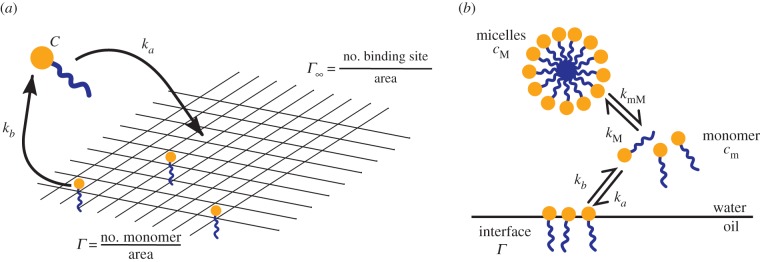
The behaviour observed on our experiments can be produced by explicitly considering the formation and dissociation of micelles. The overall process for surfactant adsorption is illustrated in figure 6. The simple analysis discussed earlier assumed that the monomer and micelles were in equilibrium on the timescales of surface adsorption, but when the two processes happen on comparable timescales, the model is given by the following set of four ordinary differential equations:
| 3.3 |
 |
3.4 |
| 3.5 |
| 3.6 |
where n is the reaction order for micelle formation, cM(t) is the concentration of micelles, cm(t) is the concentration of monomer and kM and kmM are the rate constants of formation and dissociation of micelles. The initial conditions were cM(t = 0) = (ctot − cCMC)/n and cm(t = 0) = cCMC, Γ(t = 0) = 0. Using the model above we can predict the surface tension as a function of the surfactant concentration. The predicted curves for small micelles (n = 3) are shown in electronic supplementary material, figure S4 and for bigger micelles (n = 20) in electronic supplementary material, figure S5. According to the work of Shen et al. [28] and Tucker et al. [29], we apply the different values of n for the surfactants as in table 2. For the SCBS surfactants, which are the homologue of sodium dodecyl benzene sulfonate with four more carbon atoms, the size of aggregates in the bulk solution is around 100 nm, which indicates a large aggregation number [27]. However, when fitting our data with aggregation number n = 5000, the fitting lines with various concentrations coverage (electronic supplementary material, figure S7c,d). Even with n = 500, the fitting lines are very close (electronic supplementary material, figure S7a,b). In both cases, the results abstracted from the model indicate that the adsorption kinetics are affected slightly by the reaction order for micelle formation, but governed more strongly by the variations in concentration. Fission of large micelles into smaller ones has been observed in a number of simulation and experimental-based studies [30–32] and this process happens in short timescales relative to surfactant exchange process. It is likely, therefore, that the presence of fresh oil/water interface first triggers the elongated micelles to break up into smaller micelles with lower aggregation numbers.
Figure 6.
Schematic of the model used to analyse the adsorption data. (a) Langmuir adsorption model and (b) explicit description of micelle dissociation.
Table 2.
Parameter values abstracted from model.
| surfactants | lgka | lgkb | lgkM | lgkmM | n |
|---|---|---|---|---|---|
| surfactin | 7.4 | −2.9 | 97 | −0.1 | 20 |
| 5-SCBS | 5.27 | −1.2 | 95 | 6 | 53 |
| 8-SCBS | 5.37 | −2.65 | 95 | 0.4 | 39 |
The variation of cm over time is shown in electronic supplementary material, figure S6. Before a droplet comes into contact with micellar surfactant solutions, the monomer concentration remains at its CMC value. The introduction of oil droplets transiently breaks this balance. At the start of the process, the adsorption of monomers to the oil/water interface decreases the concentration of monomers, pushing the micelles to dissociate into monomers. In this model, when the concentration of monomers at the droplet surface reaches saturation, the bulk solution reaches equilibrium and the monomer concentration returns back to the CMC.
The adsorption rate, ka, for surfactin is over two orders of magnitude higher than that observed for the SCBSs, a factor which explains the differences in the delay times in the overall kinetics of the adsorption of these surfactants. In particular, surfactin shows the highest preference for adsorbing to the hexadecane/water interface due to the unfavourable contact between the aqueous solvent and its hydrophobic moiety, the alkyl chain and the hydrophobic side chains in the amino acid residues [33–35]. Although 5-SCBS and 8-SCBS exhibit a similar adsorption rate, the higher kb value induces 5-SCBS to reach its equilibrium state faster. The similar adsorption rates but dramatically varied desorption rates for 5-SCBS and 8-SCBS illustrate that different structures of alkyl chain of SCBSs can largely affect their interfacial activity. 8-SCBS with comparable length of branched alkyl chains exhibits tighter binding with hexadecane than 5-SCBS.
4. Conclusion
In this work, a microfluidic tensiometry platform achieving a millisecond time resolution was applied to characterize the adsorption behaviour of a naturally occurring amphiphile surfactin and two synthetic surfactants 5-SCBS and 8-SCBS. In combination with equilibrium interfacial tension measurements by conventional spinning drop tensiometer, we have determined the adsorption and desorption rates of surfactant molecules and the micelle formation and dissociation rates. Our results show that surfactin adsorption reaches a steady state significantly faster than that of the synthetic surfactants studied. Comparison with molecular models of the adsorption process suggests that this difference originated from the fact that the molecule adsorption rate for surfactin is higher than that for SCBS. More generally, these measurements outline a path towards elucidating the mechanisms of amphiphile interactions with liquid–liquid interfaces via microfluidic measurements.
Supplementary Material
Data accessibility
This article has no additional data.
Competing interests
We declare we have no competing interests.
Funding
The research leading to these results has received funding from the European Research Council under the European Union's Seventh Framework Programme (FP7/2007-2013) through the ERC grant PhysProt (agreement no. 337969) (T.P.J.K, A.L.). We thank the Newman Foundation (T.P.J.K.), the BBSRC (T.P.J.K.), the EPSRC (K.L.S), the FEBS Long-Term Fellowship (A.L.), the Tsinghua University Initiative Scientific Research Program (grants 20151080424) (L.H.) and the programme of the China Scholarships Council (CSC) (L.H., L.K.), National Science Foundation of China (grant no. 21203063) (H.G.) and the Fundamental Research Funds for the Central Universities of China (H.G.).
References
- 1.Schramm LL. 2000. Surfactants: fundamentals and applications in the petroleum industry. Cambridge, UK: Cambridge University Press. [Google Scholar]
- 2.Banat IM, Makkar RS, Cameotra SS. 2000. Potential commercial applications of microbial surfactants. Appl. Microbiol. Biotechnol. 53, 495–508. [DOI] [PubMed] [Google Scholar]
- 3.Nitschke M, Costa SGVAO. 2007. Biosurfactants in food industry. Trends Food Sci. Technol. 18, 252–259. ( 10.1016/j.tifs.2007.01.002) [DOI] [Google Scholar]
- 4.Jayne Lawrence M. 1994. Surfactant systems: their use in drug delivery. Chem. Soc. Rev. 23, 417–424. ( 10.1039/cs9942300417) [DOI] [Google Scholar]
- 5.Attwood D. 2012. Surfactant systems: their chemistry, pharmacy and biology. Berlin, Germany: Springer Science & Business Media. [Google Scholar]
- 6.Mańko D, Zdziennicka A, Jańczuk B. 2014. Thermodynamic properties of rhamnolipid micellization and adsorption. Colloids Surf. B: Biointerfaces 119, 22–29. ( 10.1016/j.colsurfb.2014.04.020) [DOI] [PubMed] [Google Scholar]
- 7.Atkin R, Craig VSJ, Wanless EJ, Biggs S. 2003. Mechanism of cationic surfactant adsorption at the solid–aqueous interface. Adv. Colloid. Interface. Sci. 103, 219–304. ( 10.1016/S0001-8686(03)00002-2) [DOI] [PubMed] [Google Scholar]
- 8.Chang C-H, Franses EI. 1995. Adsorption dynamics of surfactants at the air/water interface: a critical review of mathematical models, data, and mechanisms. Colloids Surf. A: Physicochem. Eng. Aspects 100, 1–45. ( 10.1016/0927-7757(94)03061-4) [DOI] [Google Scholar]
- 9.Arutchelvi J, Sangeetha J, Philip J, Doble M. 2014. Self-assembly of surfactin in aqueous solution: role of divalent counterions. Colloids Surf. B Biointerfaces 116, 396–402. ( 10.1016/j.colsurfb.2013.12.034) [DOI] [PubMed] [Google Scholar]
- 10.Song C-S, Ye R-Q, Mu B-Z. 2007. Molecular behavior of a microbial lipopeptide monolayer at the air–water interface. Colloids Surf. A: Physicochem. Eng. Aspects 302, 82–87. ( 10.1016/j.colsurfa.2007.01.055) [DOI] [Google Scholar]
- 11.Song C-S, Ye R-Q, Mu B-Z. 2008. Aggregation behavior and surface morphology studies of surfactin in Langmuir–Blodgett films. Colloids Surf. A: Physicochem. Eng. Aspects 330, 49–54. ( 10.1016/j.colsurfa.2008.07.038) [DOI] [Google Scholar]
- 12.Fainerman VB, Miller R, Joos P. 1994. The measurement of dynamic surface tension by the maximum bubble pressure method. Colloid. Polym. Sci. 272, 731–739. ( 10.1007/BF00659287) [DOI] [Google Scholar]
- 13.Bendure RL. 1971. Dynamic surface tension determination with the maximum bubble pressure method. J. Colloid. Interface. Sci. 35, 238–248. ( 10.1016/0021-9797(71)90116-0) [DOI] [Google Scholar]
- 14.Miller R, Hofmann A, Hartmann R, Halbig A, Schano K-H. 1992. Measuring dynamic surface and interfacial tensions. Adv. Mater. 4, 370–374. ( 10.1002/adma.19920040513) [DOI] [Google Scholar]
- 15.Teipel U, Aksel N. 2001. Adsorption behavior of nonionic surfactants studied by drop volume technique. Chem. Eng. Technol. 24, 393–400. ( 10.1002/1521-4125(200104)24:4%3C393::AID-CEAT393%3E3.0.CO;2-T) [DOI] [Google Scholar]
- 16.DelRıo OI, Neumann AW. 1997. Axisymmetric drop shape analysis: computational methods for the measurement of interfacial properties from the shape and dimensions of pendant and sessile drops. J. Colloid. Interface. Sci. 196, 136–147. ( 10.1006/jcis.1997.5214) [DOI] [PubMed] [Google Scholar]
- 17.Hartland S. 2004. Surface and interfacial tension: measurement, theory, and applications. Boca Raton, FL: CRC Press. [Google Scholar]
- 18.Cayias JL, Schechter RS, Wade WH. 1975. The measurement of low interfacial tension via the spinning drop technique. ACS Symposium Series, Vol. 8, Chapter 17, pp. 234–247. Washington, DC: ACS Publications. [Google Scholar]
- 19.Yates EV, Müller T, Rajah L, De Genst EJ, Arosio P, Linse S, Vendruscolo M, Dobson CM, Knowles TPJ. 2015. Latent analysis of unmodified biomolecules and their complexes in solution with attomole detection sensitivity. Nat. Chem. 7, 802–809. ( 10.1038/nchem.2344) [DOI] [PubMed] [Google Scholar]
- 20.Arosio P, et al. 2015. Microfluidic diffusion analysis of the sizes and interactions of proteins under native solution conditions. ACS Nano. 10, 333–341. ( 10.1021/acsnano.5b04713) [DOI] [PubMed] [Google Scholar]
- 21.Brosseau Q, Vrignon J, Baret J-C. 2014. Microfluidic dynamic interfacial tensiometry (µDIT). Soft Matter 10, 3066–3076. ( 10.1039/c3sm52543k) [DOI] [PubMed] [Google Scholar]
- 22.Liu J-F, Yang J, Yang S-Z, Ye R-Q, Mu B-Z. 2012. Effects of different amino acids in culture media on surfactin variants produced by Bacillus subtilis TD7. Appl. Biochem. Biotechnol. 166, 2091–2100. ( 10.1007/s12010-012-9636-5) [DOI] [PubMed] [Google Scholar]
- 23.Carrillo C, Teruel JA, Aranda FJ, Ortiz A. 2003. Molecular mechanism of membrane permeabilization by the peptide antibiotic surfactin. Biochim. Biophys. Acta (BBA)-Biomembranes 1611, 91–97. ( 10.1016/S0005-2736(03)00029-4) [DOI] [PubMed] [Google Scholar]
- 24.Jin L, Garamus VM, Liu F, Xiao J, Eckerlebe H, Willumeit-Römer R, Mu B, Zou A. 2016. Interaction of a biosurfactant, surfactin with a cationic gemini surfactant in aqueous solution. J. Colloid. Interface. Sci. 481, 201–209. ( 10.1016/j.jcis.2016.07.044) [DOI] [PubMed] [Google Scholar]
- 25.Xia Y, Whitesides GM. 1998. Soft lithography. Annu. Rev. Mater. Sci. 28, 153–184. ( 10.1146/annurev.matsci.28.1.153) [DOI] [Google Scholar]
- 26.Jin F, Balasubramaniam R, Stebe KJ. 2004. Surfactant adsorption to spherical particles: the intrinsic length scale governing the shift from diffusion to kinetic-controlled mass transfer. J. Adhes. 80, 773–796. ( 10.1080/00218460490480770) [DOI] [Google Scholar]
- 27.Dreiss CA, Feng Y. 2017. Wormlike micelles: advances in systems, characterisation and applications, vol. 6 Cambridge, UK: Royal Society of Chemistry. [Google Scholar]
- 28.Shen H-H, Thomas RK, Chen C-Y, Darton RC, Baker SC, Penfold J. 2009. Aggregation of the naturally occurring lipopeptide, surfactin, at interfaces and in solution: an unusual type of surfactant? Langmuir 25, 4211–4218. ( 10.1021/la802913x) [DOI] [PubMed] [Google Scholar]
- 29.Tucker I, Penfold J, Thomas RK, Dong CC, Golding S, Gibson C, Grillo I. 2011. The adsorption and self-assembly of mixtures of alkylbenzene sulfonate isomers and the role of divalent electrolyte. Langmuir 27, 6674–6682. ( 10.1021/la200961a) [DOI] [PubMed] [Google Scholar]
- 30.Sammalkorpi M, Karttunen M, Haataja M. 2008. Micelle fission through surface instability and formation of an interdigitating stalk. J. Am. Chem. Soc. 130, 17977–17980. ( 10.1021/ja8077413) [DOI] [PubMed] [Google Scholar]
- 31.Rharbi Y, Winnik MA. 2003. Salt effects on solute exchange and micelle fission in sodium dodecyl sulfate micelles below the micelle-to-rod transition. J. Phys. Chem. B 107, 1491–1501. ( 10.1021/jp020842f) [DOI] [Google Scholar]
- 32.Gao J, Li S, Zhang X, Wang W. 2010. Computer simulations of micelle fission. Phys. Chem. Chem. Phys. 12, 3219–3228. ( 10.1039/b918449j) [DOI] [PubMed] [Google Scholar]
- 33.Chen H-L, Juang R-S. 2008. Recovery and separation of surfactin from pretreated fermentation broths by physical and chemical extraction. Biochem. Eng. J. 38, 39–46. [Google Scholar]
- 34.Lin S-C, Jiang H-J. 1997. Recovery and purification of the lipopeptide biosurfactant of Bacillus subtilis by ultrafiltration. Biotechnol. Tech. 11, 413–416. ( 10.1023/A:1018468723132) [DOI] [Google Scholar]
- 35.Liu Q, Lin J, Wang W, Huang H, Li S. 2015. Production of surfactin isoforms by Bacillus subtilis BS-37 and its applicability to enhanced oil recovery under laboratory conditions. Biochem. Eng. J. 93, 31–37. ( 10.1016/j.bej.2014.08.023) [DOI] [Google Scholar]
Associated Data
This section collects any data citations, data availability statements, or supplementary materials included in this article.
Supplementary Materials
Data Availability Statement
This article has no additional data.


