Abstract
Fibroblast migration plays a key role during various physiological and pathological processes. Although migration of individual fibroblasts has been well studied, migration in vivo often involves simultaneous locomotion of fibroblasts sited in close proximity, so-called ‘en masse migration’, during which intensive cell–cell interactions occur. This study aims to understand the effects of matrix mechanical environments on the cell–matrix and cell–cell interactions during en masse migration of fibroblasts on collagen matrices. Specifically, we hypothesized that a group of migrating cells can significantly deform the matrix, whose mechanical microenvironment dramatically changes compared with the undeformed state, and the alteration of the matrix microenvironment reciprocally affects cell migration. This hypothesis was tested by time-resolved measurements of cell and extracellular matrix movement during en masse migration on collagen hydrogels with varying concentrations. The results illustrated that a group of cells generates significant spatio-temporal deformation of the matrix before and during the migration. Cells on soft collagen hydrogels migrate along tortuous paths, but, as the matrix stiffness increases, cell migration patterns become aligned with each other and show coordinated migration paths. As cells migrate, the matrix is locally compressed, resulting in a locally stiffened and dense matrix across the collagen concentration range studied.
Keywords: fibroblast, collagen, migration, mechanical microenvironment, cell–cell interaction, cell–matrix interaction
1. Introduction
Migration of fibroblasts is a key phenomenon during various physiological and pathological processes including wound healing [1] and cancer development [2,3]. During these processes, fibroblasts remodel compliant collagen extracellular matrix (ECM) by compacting, degrading and synthesizing the matrices [4]. In addition, when collagen-based acellular constructs are used as exogenous provisional matrices to treat chronic wounds by enhancing wound closure [5], fibroblasts infiltrate and remodel the matrices to form regenerated tissues [6]. For successful healing, fibroblasts must migrate into the wound site, and then synthesize and remodel the matrices [7]. The granulation tissue formation and wound closure depend on proper infiltration of this provisional matrix by fibroblasts [4].
During fibroblast migration, mechanical cues by the ECM are known to play a major role in regulating cellular behaviours [8,9]. There have been numerous studies of regulation of individual fibroblast migration by ECM mechanical properties and microstructure [10–13]. In the absence of neighbouring cells, fibroblasts preferentially migrate from low stiffness to high stiffness regions both on polymeric substrates and within collagen matrices with generated rigidity gradients through a process known as durotaxis [10,11]. Cells cultured on stiff substrates are associated with increased size of cell matrix adhesions that enable application and transmission of larger traction forces than those on softer substrates [12].
Although single cell studies provide insights on mechanisms of cell motility and cell–matrix interactions, migration in vivo often involves fibroblasts that move at the same time and at close proximity [14,15]. Unlike collective migration that is typically observed in epithelial cell sheets with cell–cell contact [16,17], this en masse migration behaviour does not necessarily depend on cell–cell adhesion, yet it suggests a degree of coordination in fibroblast behaviours during wound healing in vivo. Traction forces applied simultaneously by a group of migrating cells can give rise to large-scale deformation of the matrix, as well as stress and mechanical property gradients across the matrix [15]. This altered mechanical environment is expected to further stimulate fibroblast migration. However, these bi-directional interactions between groups of fibroblasts and their mechanical environment are not well understood. Specifically, in the current literature there is a lack of research on the effects of spatio-temporal alteration of the mechanical environment by multiple cells on the cell–cell and cell–matrix interactions.
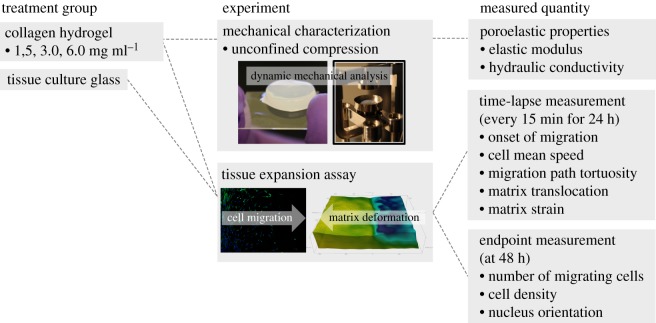
This study, thus, aims to understand the effects of the matrix mechanical environment, which undergoes dynamic remodelling by a group of cells, on the cell–matrix and cell–cell interactions during en masse migration of fibroblasts on collagen matrices. Specifically, we hypothesize that a group of migrating cells can significantly deform the matrix, whose mechanical microenvironment drastically changes compared with that of the undeformed matrix, and this dynamic alteration of the matrix microenvironment reciprocally affects cell migration behaviour. The underlying rationale for this mechanism is that multiple fibroblasts collectively generate mechanical forces large enough to deform the collagen matrices, which spatio-temporally alters their mechanical environment including elastic modulus and porosity. Thus, the migration may correlate with the spatio-temporal patterns of this deformed matrix. As outlined in figure 1, this hypothesis was tested by performing time-resolved measurements of cell and ECM movement during the en masse migration of fibroblasts on collagen hydrogels with varying collagen concentrations. For this study, a new in vitro fibroblast–collagen matrix platform was developed that allows simultaneous measurement of cellular movement and matrix deformation. The results of this study are further discussed to understand the mechanical interactions between cells and the ECM during wound healing and development of new wound dressings for improved wound healing outcomes.
Figure 1.
Study outline indicating the treatment groups studied, experiments performed and measured quantities of interest. (Online version in colour.)
2. Material and methods
2.1. Cell culture and reagents
Early passage human foreskin fibroblasts were maintained in culture medium (DMEM/F12; Invitrogen, NY, USA) supplemented with 10% fetal bovine serum, 2 mM L-glutamine and 100 µg ml−1 penicillin/streptomycin. The fibroblasts were cultured in 75 cm2 T-flasks at 37°C and 5% CO2 and were consistently harvested at 80% confluency by using 0.05% trypsin and 0.53 mM EDTA. The cells that were used in the experiments were between the 10th and 15th passages. For selective cell seeding in the tissue expansion assay, 2 × 10⁵ cells were retrieved from the flask and centrifuged at 2000 rpm for 4 min. Cells were then labelled with targeted quantum dots (QDs; Q-tracker 655; Invitrogen, NY, USA) by incubation in culture medium containing QD stock with 1:500 dilution for 30 min. Then cells were centrifuged twice while being washed with unsupplemented culture medium in between. The resulting cell pellet was resuspended in 80 µl of unsupplemented culture medium and used in the experiments. Migration studies were conducted using a promigratory growth factor medium with reduced serum content [18], which included culture medium supplemented with 1% fetal bovine serum, 2 mM L-glutamine, 100 µg ml−1 penicillin/streptomycin and 50 ng ml−1 human platelet-derived growth factor (PDGF-BB; Millipore, MA, USA).
2.2. Collagen matrices
Collagen matrices were prepared as described in our earlier work [19] with several modifications. Briefly, a stock solution of rat tail collagen type-1 (Corning Inc., NY, USA) was mixed with 10× Dulbecco's phosphate-buffered saline (10× DPBS; Life Technologies), 1.0 N NaOH, cell culture grade distilled water and fluorescent microspheres with 10 µm diameter (G1000B; Thermoscientific) at appropriate proportions to obtain a final collagen solution that had neutral pH, isotonic ionic strength, a collagen concentration of 1.5, 3 or 6 mg ml−1 and a microsphere concentration of 9 × 10⁵ particles ml−1. The microspheres served as tracers of matrix movement in subsequent tissue image deformetry analysis. The collagen solution was dispensed into sample containers and allowed to polymerize by incubation at 37°C overnight. The sample container was sealed using laboratory parafilm to prevent dehydration of the specimen during incubation. The resulting hydrogels exhibited an isotropic fibrillar matrix microstructure with direction-independent distributions of pore size, fibre density and orientation as observed in our previous studies [19,20]. We controlled for other factors that may affect stiffness and microstructure, such as polymerization temperature and pH and we did not use external cross-linking agents. For collagen coating, glass substrates were incubated with a solution of 50 ng ml−1 rat tail collagen type-1 in 0.02 M acetic acid at 37°C for 1 h, rinsed with DPBS three times and dried under a stream of sterile air.
2.3. Mechanical characterization of collagen matrices
The elastic modulus and hydraulic conductivity of collagen matrices were measured by a dynamic mechanical analyser (DMA) (Q800; TA Instruments, DE, USA) and interpreted as key indicators of mechanical stiffness and matrix porosity, respectively [21,22]. Acellular collagen matrices were cast into a disc shape with 12 mm diameter and approximately 3 mm thickness. Force–displacement measurements were performed during unconfined compression of the specimen between two parallel plates by application of a loading ramp from 0 to 10 mN at a rate of 2 mN min−1 without any preconditioning or equilibration phases. A small amount of compressive force (less than 1 mN) was applied in the beginning to ensure initial contact between the specimen and compression plate. During compression, the specimen was fully immersed in physiological saline solution (PBS) where free flow of interstitial fluid in and out of the specimen through its lateral boundaries was allowed. The loading programme resulted in a simultaneous increase in compressive strain and the presence of stress relaxation evidenced by a concave-down trend observed in experimental stress–strain profiles. This behaviour was in agreement with the material's poroelastic nature where relaxation time is dependent upon the hydraulic conductivity and elastic modulus of the solid matrix [23]. We, therefore, used a poroelastic model [24] that considers the collagen matrix as a porous material saturated with interstitial fluid and describes its mechanical response based on its linear elastic properties and resistance to interstitial flow. Assuming isotropic material and small strains, our model expresses the compressive stress and strains in the collagen matrix as transcendental functions of time and three model parameters: elastic modulus (Es), Poisson's ratio (νs) and hydraulic conductivity (K). The details of the model are provided in the electronic supplementary material. The model parameters were determined by fitting the predictions of the stress–strain profile against the DMA data by nonlinear least-squares regression that minimized the squared sum of the difference between the experimental observations and the model predictions. Optimization was performed using a custom Matlab routine that used a third-party optimization toolbox, OPTI [25].
2.4. Tissue expansion assay
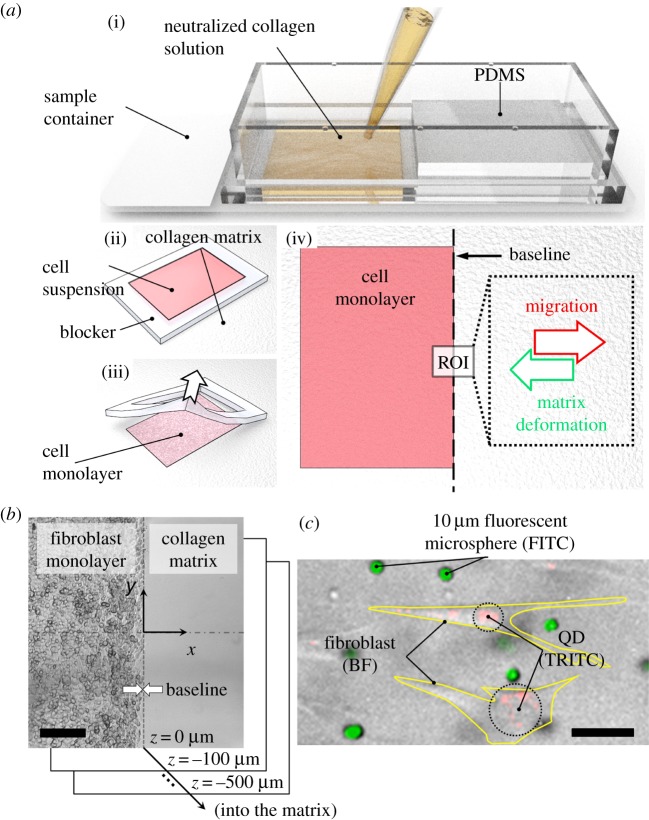
Thin rectangular slabs of collagen matrices with approximate thicknesses of 1 mm were produced in a customized chamber slide (Nunc Labtek-II; Fisher Scientific) as described in the previous section and illustrated in figure 2a, inset (i). Then, 80 μl of fibroblast suspension in unsupplemented DMEM containing 2 × 10⁵ cells was placed on top of the collagen hydrogels where the spread of the solution was confined to a rectangular region with 45 mm2 area using a thin, flexible blocker made of polydimethylsiloxane (PDMS) as illustrated in figure 2a(ii). Upon incubation at 37°C for 30 min, the cells settled down onto the hydrogel surface. We identified 30 min to be sufficient for cells to attach to the substrate, after which they began the remodelling process both mechanically and potentially in other ways. At the end of the incubation, the culture medium was removed, and the blocker was carefully peeled off the hydrogel surface with tweezers, resulting in a densely packed cell monolayer patterned selectively on the hydrogel surface (figure 2a(ii)). Cells freely migrated out from this initial seeding region into the unpopulated regions on the surface of the hydrogel in every direction. Since the main focus of this study is the early phase of matrix remodelling by migrating cells, time-lapse observations were immediately started in order to measure cell migration and matrix deformation in a region of interest (ROI) located at the boundary of the seeding as indicated in figure 2a(iv). Densely seeded adherent cells result in general consolidation unless the substrate is properly restrained. In order to prevent tissue-wide displacements and detachment at the chamber boundaries, we used four cylindrical support posts, 3 mm in diameter, partially overlapping with the cell seeding region as shown in the electronic supplementary material, figure S1. These posts effectively constrained the bulk hydrogel displacement, particularly in the y-direction. The ROI for imaging purposes was located away from the posts and the corners of the seeding region such that the migration and matrix translocation were predominantly in the x-direction.
Figure 2.
Tissue expansion assay developed to characterize fibroblast migration and collagen matrix translocation. (a) The tissue expansion assay was set up using the following procedure. (i) Neutralized collagen solution was dispensed into a customized sample container and allowed to polymerize. (ii) A rectangular region was isolated on top of the collagen matrix by using an elastomer blocker, and cell suspension was introduced into the resulting cavity. (iii) Upon incubation, cells settled down onto the matrix surface. The blocker was gently peeled off the surface, resulting in a cell monolayer patterned on the matrix. (iv) Promigratory growth factor medium was added on top of the matrix, and a region of interest (ROI) at the boundary of the cell was observed by time-lapse microscopy every 15 min for 24 h. (b) A partial view of the imaging ROI at the beginning of the experiment showing the baseline and image coordinates used for subsequent analysis. Imaging was performed at multiple focal planes 100 µm apart, including the matrix surface (z = 0 µm) and half way into the matrix (z =−500 µm). The scale bar is 200 µm. (c) A bright field (BF) microscopy image of fibroblasts superimposed with fluorescence images of quantum dots (QDs) and polystyrene microspheres that served as intracellular and extracellular tracers, respectively, to characterize cell migration and matrix translocation. The scale bar is 50 µm. FITC, fluorescein isothiocyanate; TRITC, tetramethylrhodamine fluorescene. (Online version in colour.)
2.5. Fluorescence labelling and microscopy imaging
Figure 2b presents a partial view of a typical imaging field of view at the beginning of the experiments where the fibroblast monolayer and the unpopulated collagen matrix were separated by a distinct interface, referred to as the baseline. The left- and right-hand sides of the baseline are referred to as the seeding and migration regions, respectively. A coordinate system is defined such that the baseline is aligned along the y-direction, cell migration predominantly occurs in the +x-direction, and the z-axis is defined along the thickness of the collagen matrices.
For time-lapse study of cell migration and matrix deformation, collagen matrices that were seeded with fibroblasts were placed in a stage top incubator (Okolab H501-EC; Warner Instruments, CT, USA) and imaged under an inverted epifluorescence microscope (IX71; Olympus, Center Valley, PA, USA) every 15 min for 24 h. At each time point, images were acquired at multiple focal planes 100 µm apart from each other and at positions between the hydrogel surface and 500 µm deep into the hydrogel as indicated in figure 2b and illustrated in the electronic supplementary material, figure S2. At each focal plane, both bright field and fluorescence illuminations were used to identify the 10 µm sized microspheres embedded within the collagen matrix (excitation/emission: 495 nm/519 nm) and QDs internalized by the cells (excitation/emission: 547 nm/573 nm) as shown in figure 2c. All images were captured by a CCD camera (Retiga 2000R; Qimaging, Canada).
For endpoint measurements of migration distances, the cell nuclei were labelled with Hoechst 33342 (Sigma Aldrich, MI, USA) in culture medium, fixed with 4% formaldehyde, and imaged under an epifluorescence microscope (IX71; Olympus, Center Valley, PA, USA). Three fields of view, approximately 2.5 mm wide, were imaged across the baseline for each specimen.
For visualization of the actin cytoskeleton, fibroblasts on collagen matrices were fixed with 4% formaldehyde, blocked with 2% bovine serum albumin, permeabilized with 0.5% Triton-X and stained with Alexa Fluor 488 phalloidin (Invitrogen). Confocal images were obtained using a fluorescence microscope (BX51; Olympus, Center Valley, PA, USA) equipped with structured light illumination (OptiGrid; Qioptiq Photonics, Munich, Germany) and a CCD camera (DP72; Olympus) at locations x = 500 µm and x = 1000 µm in the migration region.
2.6. Tissue image deformetry
A tissue image deformetry technique that enables time-resolved measurements of large deformations was developed. Time-lapse fluorescence images of extracellular tracers, i.e. fluorescent microspheres, were first analysed by digital particle image velocimetry (PIV) [26] using multi-pass window deformation [27] implemented in DaVis (LaVision, MI, USA). The resulting instantaneous velocity field was then integrated over time to determine the paths of material points (electronic supplementary material, figure S3). Similar incremental-PIV (I-PIV) techniques have been previously used for deformetry measurements to study microstructural alterations in collagen matrices [28–30]. Material paths calculated by I-PIV were validated against trajectories of extracellular tracers directly determined by single particle tracking [31] in Fiji [32]. Additional details of this method are provided in the electronic supplementary material.
A 60 × 45 grid of material points enabled calculation of the displacement and deformation fields of the collagen matrix at a resolution of approximately 60 µm. The collagen matrix was assumed to be initially undeformed. The displacement of each material point i, ui, was defined as ui(t) = xi(t) − xi,o in terms of the particle position at time t, xi(t), and the initial position, xi,o. The displacement field, ui, was approximated by interpolation and used to calculate the displacement and deformation gradient tensors, ∇ui and F = I + ∇ui, with I being the identity tensor. Then the Cauchy finite strain tensor was calculated by
| 2.1 |
The calculated strain is based on the finite strain tensor, E, calculated by
| 2.2 |
The deformation calculations were performed using a custom Matlab script.
2.7. Characterization of cell migration
In the endpoint migration assays, the number and distribution of cells within the migration region were determined by counting the labelled cell nuclei and binning the nuclei locations at 100 µm intervals from the baseline at 48 h from the beginning of the experiment. In the time-lapse studies, the time of onset of migration was estimated by observation of the time point at which cells first started to emerge from the baseline. The apparent trajectories of individual cells were determined by semi-automatic tracking of intracellular QDs using Trackmate [31] in Fiji [32]. Each treatment group involved 38–75 cells tracked for 7–23 h. For conditions with collagen matrices, the reported trajectories were based on the relative velocity of the cell with respect to the matrix where the matrix velocity obtained by PIV was subtracted from the apparent cell velocity obtained by QD tracking. The mean speed of each cell was defined as the ratio of the total distance travelled by the cell to the total duration of the trajectory. The tortuosity of the cell trajectory was defined as the ratio of the total distance travelled by the cell to the net distance between the coordinates of the cell at the first and last time points of the trajectory. Tortuosity is considered as a measure of deviation from the straight path and is always greater than or equal to unity. The definitions of mean speed and tortuosity are illustrated in the electronic supplementary material, figure S4. All calculations were performed using a custom Matlab script.
2.8. Statistical analysis
Experiments were repeated three or four times for each treatment group. Experimental data are reported as the mean ± standard deviation. Differences in treatment means were tested by one-way analysis of variance (ANOVA) and pairwise comparisons were performed by Student's t-test unless otherwise noted. Bonferroni adjustments were not used to minimize the type-II error while testing for differences between specific pairs of treatment groups [33–35]. Dynamic cell migration metrics, i.e. mean speed and tortuosity, were non-normally distributed and hypothesis testing on those quantities was based on Kruskal–Wallis ANOVA. The associated pairwise comparisons were performed by Wilcoxon–Mann–Whitney rank sum test. In this study, each specimen was tested once and the number of repetitions (N ≥ 3) sufficiently resolved the differences between treatment groups of interest. In all experiments, differences were considered statistically significant when the p-value was less than 0.05.
3. Results
3.1. Mechanical properties of collagen matrices
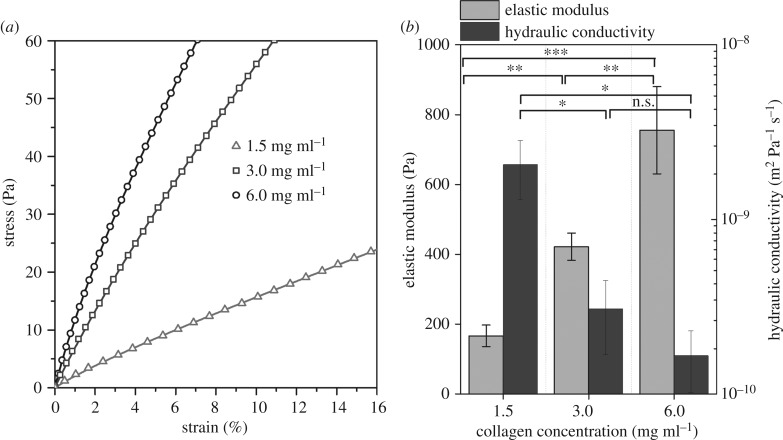
The results of dynamic mechanical analysis are shown in figure 3. As the collagen concentration increases, the strain decreases at a given stress condition. Thus, the elastic modulus was found to be between 150 and 750 Pa and showed a significant increase with collagen concentration (figure 3a). Hydraulic conductivity, which is a measure of the porosity of the collagen matrices, showed a reverse trend. It decreased with increasing collagen concentration. The values were between 1 × 10⁻¹⁰ and 3 × 10⁻⁹ m2 Pa−1 s−1 (figure 3b). Then, matrix porosities were estimated based on hydraulic conductivity measurements and were found to be between 0.90 and 0.99 (electronic supplementary material, figure S5). These results confirm that the collagen concentration changes both mechanical stiffness and matrix porosity simultaneously.
Figure 3.
Characterization of collagen matrix mechanical properties. (a) Representative stress–strain curves observed during unconfined compression of collagen gels by ramp loading. Symbols indicate the experiments. Lines are model predictions based on best fitting parameters. (b) Elastic modulus and hydraulic conductivity of collagen matrices estimated by fitting a poroelastic model to experimental stress–strain curves. *p-value < 0.05, **p-value < 0.01, ***p-value < 0.001.
3.2. En masse migration of fibroblasts
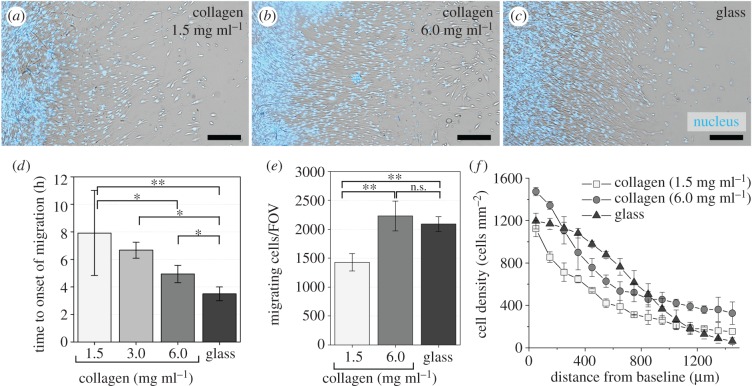
The tissue expansion assay developed in this study allowed the formation of a densely packed fibroblast monolayer with controlled geometry on both collagen matrix and glass substrates. Upon removal of the elastomer blocker, cells started moving into initially unpopulated regions of the substrates. Figure 4a–c shows micrographs of the migration pattern after 48 h. It was observed that relocation of fibroblasts occurred in bulk, where a large number of cells started to migrate and remained in close proximity as they simultaneously migrated. The timing and extent of the mass migration of fibroblasts on compliant collagen matrices were markedly different from those on collagen-coated glass substrate. First of all, the initiation of migration was delayed on collagen matrices in comparison with glass. Migration on glass started as early as 4 h after the beginning of the experiment while the time to onset of migration increased up to nearly 8 h on collagen matrices, with the largest increase observed for the case of the lowest density collagen (1.5 mg ml−1) (figure 4d). The number of migrating cells and the penetration depth of the cell front in the case of 1.5 mg ml−1 collagen were significantly lower than those for high density collagen (6.0 mg ml−1) and glass. As a result, cell densities observed on 1.5 mg ml−1 collagen after 48 h were significantly less than those on 6.0 mg ml−1 collagen matrix and glass substrates. On the other hand, these metrics were comparable between high density collagen (6.0 mg ml−1) and glass (figure 4e,f).
Figure 4.
Mass migration of fibroblasts on collagen matrices. (a–c) Migration patterns after 48 h on collagen matrices with 1.5 and 6.0 mg ml−1 concentrations versus on glass. Cell nuclei (blue) are superimposed on the bright field images. Scale bars are 300 µm. (d) Time to onset of migration, which indicates the time at which cells first emerge from the baseline. (e) Number of migrating cells per imaging field of view (FOV) and (f) distribution of cell density after 48 h. (Online version in colour.)
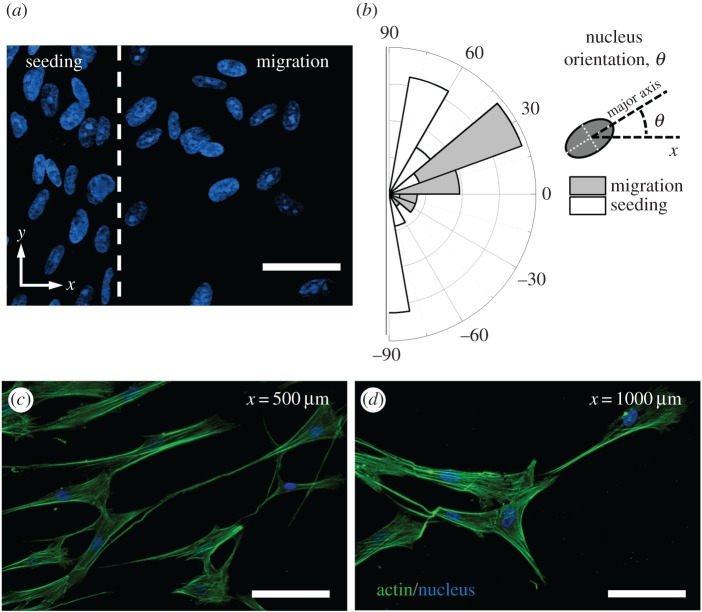
The morphological characteristics of migrating fibroblasts are presented in figure 5. The cell nucleus alignment changed direction between the seeded cells and the cells that were migrating. In the seeding region, the nucleus orientation was predominantly parallel to the baseline while in the migrating cells the nucleus orientation became aligned with the migration direction of the cells (figure 5a,b). The morphology of the fibroblasts on the collagen matrix was typical of migrating cells (figure 5c,d).
Figure 5.
Morphological characteristics of migrating fibroblasts. (a) Comparison of orientations of nuclei in cells that have started migrating (right) and quiescent cells within the seeding region (left). Scale bar is 50 µm. (b) Distribution of nucleus orientation for cells within the migration and seeding regions as illustrated in (a). Nuclear morphology (blue) and actin cytoskeletal organization (green) of fibroblasts that have migrated over distances of (c) 500 μm and (d) 1000 μm from the baseline after 24 h. Scale bars are 100 µm. The images are from cells migrating on 3.0 mg ml−1 collagen matrices. (Online version in colour.)
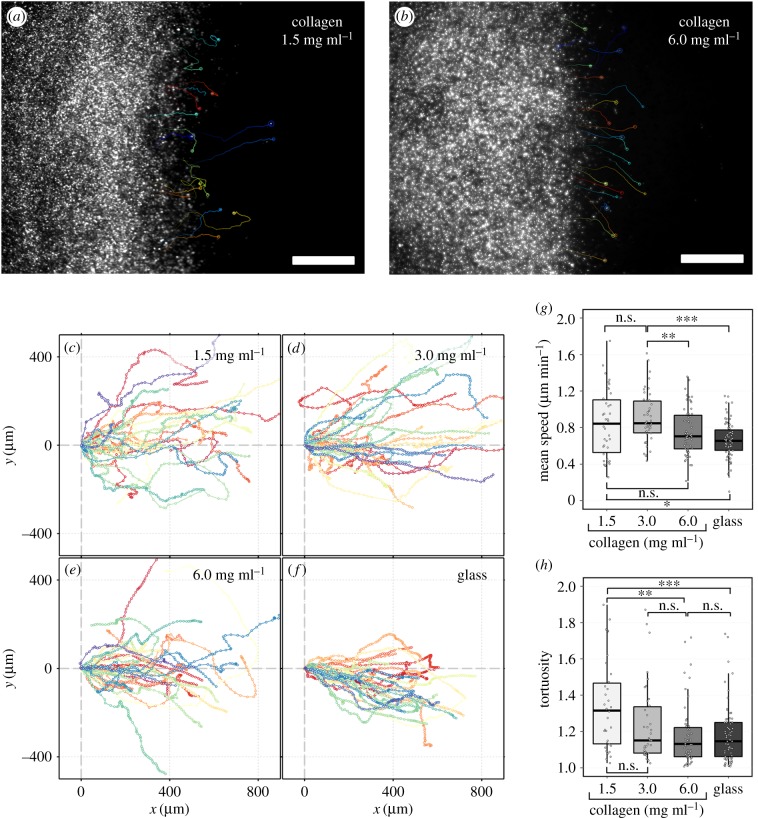
Cells also showed differences in their migration dynamics between collagen and rigid glass substrates. Cells on low density collagen (1.5 mg ml−1) showed varying orientations while cells on stiff collagen matrix (6 mg ml−1) showed aligned cells and unidirectional migration which was similar to the behaviour on the glass substrate (figure 6a,b; electronic supplementary material, movie S1). Cells on 1.5 and 3.0 mg ml−1 collagen matrices showed more variation in direction than those on the glass substrate, where cells performed unidirectional motion resulting in a relatively coherent stream (figure 6c–f). While cells also moved at a greater velocity on low density collagen, overall, the low density collagen case still showed decreased overall migration, potentially due to the decreased directional persistence and increased tortuosity of their motion (figure 6g,h). The definition of the tortuosity is provided in the Material and methods section and illustrated in the electronic supplementary material, figure S3.
Figure 6.
Dynamic characteristics of fibroblast migration on collagen matrices and glass substrate. Apparent trajectories of cells migrating on (a) low density (1.5 mg ml−1) and (b) high density (6.0 mg ml−1) collagen matrices. Trajectories of single cells are indicated by individually coloured solid lines superimposed upon snapshots of QD intensity at 24 h. Scale bars are 500 μm. (c–f) Trajectories of 30 randomly selected cells migrating on different substrates where each trajectory indicates the relative movement of the cell with respect to the matrix, superimposed on a common origin for illustration purposes. (g) Mean speed and (h) tortuosity of cell trajectories for cells migrating on different substrates. **p-value < 0.01, ***p-value < 0.001. (Online version in colour.)
3.3. Matrix remodelling prior to en masse migration
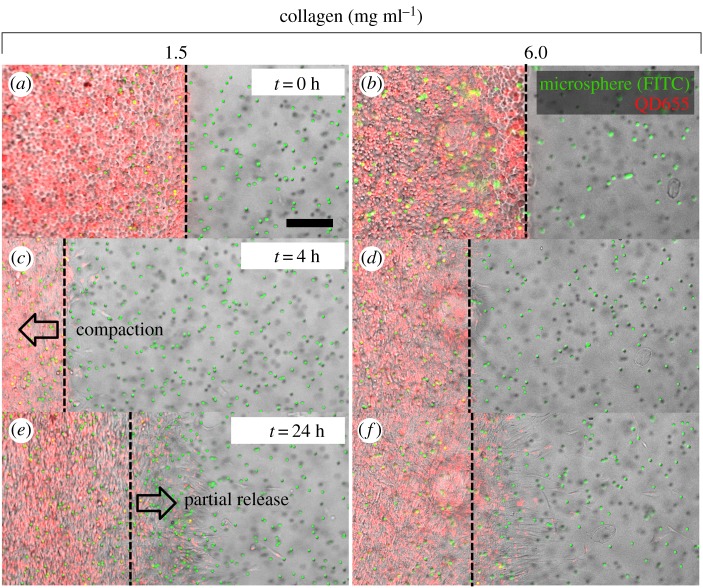
The collagen matrices underwent significant remodelling prior to initiation of migration. Figure 7 presents micrographs of migration acquired at several time points on the low and high density collagen matrices. It was observed that cells on collagen matrix first remodelled this deformable substrate by contraction. The mass contraction of fibroblasts resulted in displacement of the migration baseline from its initial position towards the seeding region. Cells started migrating only after partial recovery of the matrix compaction. The amount of both compaction and partial release depended upon the collagen matrix density (figure 7a–f; electronic supplementary material, movie S2).
Figure 7.
Matrix remodelling prior to initiation of migration depends on the collagen concentration. (a–f) Time-lapse microscopy images of cell and matrix movement for collagen matrices with 1.5 and 6.0 mg ml−1 concentrations indicating the distinct compaction and partial release phases. The scale bar is 200 µm and is common for all figures. (Online version in colour.)
3.4. Spatio-temporal matrix deformation during en masse migration
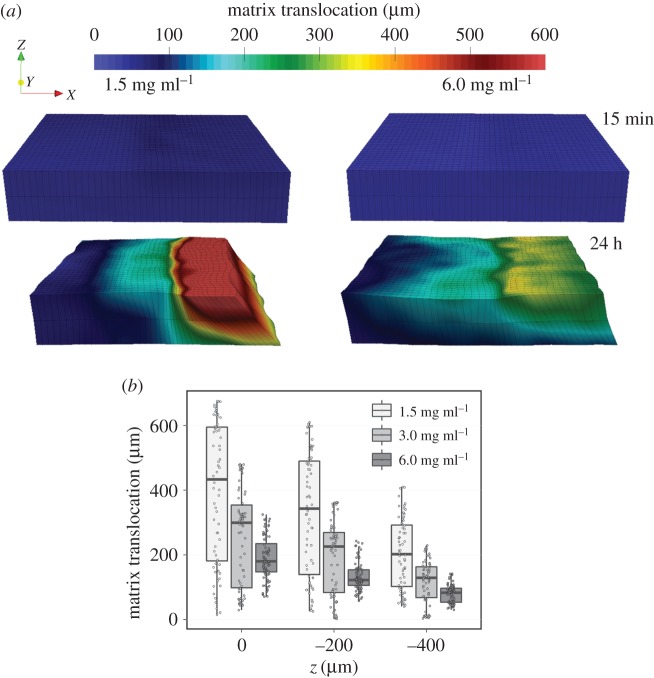
Using the developed tissue image deformetry technique, the extent, distribution and evolution of cell-mediated collagen matrix remodelling were determined. The translocation of the matrix by fibroblasts was predominantly on the hydrogel surface, as indicated by the contours of displacement magnitude in figure 8a. The magnitude of matrix translocation diminished within the hydrogel for the collagen densities studied (figure 8b; electronic supplementary material, figure S1b). These results suggest that the deformation has three-dimensional characteristics, whose penetration also depends on the collagen concentration.
Figure 8.
Fibroblasts induce shear deformation on collagen matrices. (a) Contours of in-plane collagen matrix translocation based on measurements at varying distances from the matrix surface. Translocation in the z-direction is not displayed in the contours. (b) Depth-dependence of matrix translocation. Matrix translocation is highest at the matrix surface and is diminished within the matrix. (Online version in colour.)
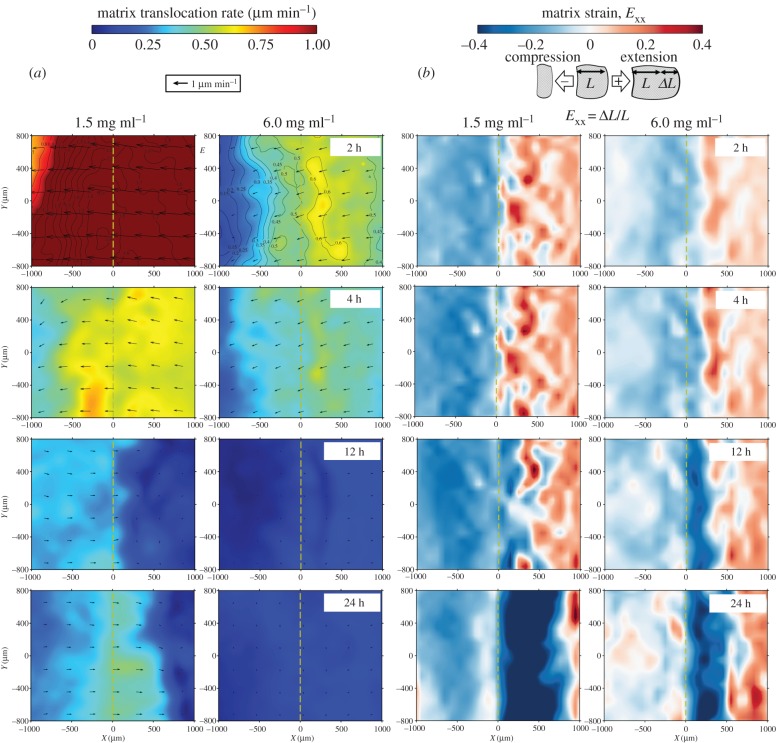
Figure 9 compares the translocation rates and strain of collagen matrices with low (1.5 mg ml−1) and high (6.0 mg ml−1) collagen densities. Within the first several hours, rapid translocation of the matrix was observed, whose magnitude decreased and direction reversed once the migration started (figure 9a). In addition, the seeding region (X < 0) underwent gradual compaction, indicated by the negative values of strain. An expansion whose magnitude increased over time was also observed in the migration region. After the onset of migration, the trend started to reverse, and the matrix within the migration region was compressed. The region of compression increased as the migration front advanced. After 24 h, there was net expansion in the seeding region and net compression in the migration region, particularly in the vicinity of the baseline. The magnitude of compression was greater and the region affected was wider for low collagen density compared with high collagen density (figure 9b; electronic supplementary material, movie S3).
Figure 9.
Fibroblast-induced spatio-temporal matrix translocation and deformation at the hydrogel surface (z = 0 µm). (a) Matrix translocation and (b) deformation maps at different time points. In each case, low and high density collagen matrices are compared. The magnitude of the translocation rate is indicated by colour-coded contours while the direction of instantaneous translocation is indicated by superimposed arrows. (Online version in colour.)
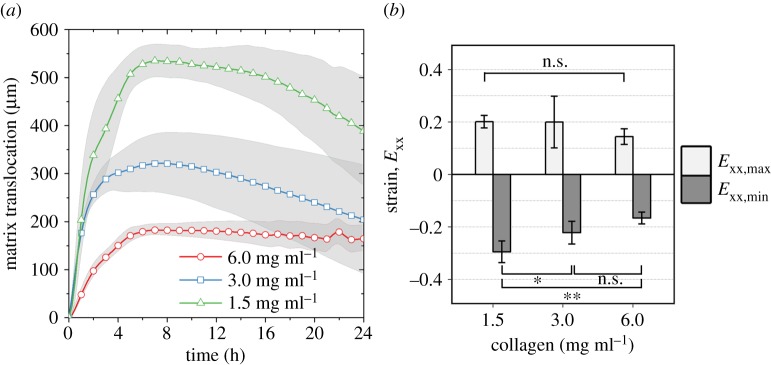
The translocation of the baseline was dependent upon the collagen density, and it decreased significantly with increasing collagen density. The trends in baseline translocation also correlated with the amount of delay in the initiation of migration, as described previously (figure 10a). At the time of the onset of migration, the magnitudes of maximum and minimum strain generally decreased with increasing collagen concentration, and the difference in minimum strain between 1.5 and 6.0 mg ml−1 was statistically significant (figure 10b). The significant spatio-temporal deformation of the matrix and the drastic change in displacement near the migration front imply that the migration occurs on substrates with distinctly different stiffness and porosity from those of the initial collagen matrices.
Figure 10.
Mean deformation metrics. (a) Magnitude of baseline displacement in the x-direction over the course of the time-lapse study. The shaded regions indicate the standard deviation. (b) The effect of collagen concentration on the cell-induced matrix strain observed at the time of onset of migration. Maximum and minimum strains correspond to maximum magnitudes of tensile and compressive strain, respectively. The magnitudes of maximum and minimum strain generally decrease with increasing collagen concentration. The difference in minimum strain between 1.5 and 6.0 mg ml−1 is statistically significant. *p-value < 0.05, **p-value < 0.01. (Online version in colour.)
4. Discussion
Our study shows that traction forces arising from simultaneous action of a group of fibroblasts can result in significant deformation of compliant collagen matrices with stiffnesses between 0.17 kPa and 0.76 kPa. This stiffness range is particularly interesting for the investigation of cell–matrix interactions during tissue regeneration where the early granulation tissue also exhibits a similar level of stiffness (0.01–1 kPa) [36]. By considering the matrix deformation as an indirect quantitative measure of architectural remodelling of collagen, we identified two distinct remodelling phases separated by the onset of migration.
The first remodelling phase lasted for 5–8 h depending on the collagen density, and was marked by the compression of the cell-laden region and expansion of the cell-free region. The main mechanism of force generation during this phase is thought to be spreading and contraction of fibroblasts [37–39]. It is possible that the forces that initiated the compression originated from cell spreading since the compression was observed at as early as 15 min, when cells still showed circular morphology and were not yet fully spread on the hydrogel surface. On the other hand, continuation of compression until the onset of migration is considered to be mainly due to non-migratory contraction of cells where elongated cell bodies gradually shortened without significant translation.
During the second remodelling phase that started with the initiation of migration, the deformation patterns were reversed. The compression within the original seeding region decreased particularly near the baseline while the initially cell-free region that was populated by cells showed a compression wave that propagated with the migration front moving in the +x-direction. We consider the compression wave to be a direct result of contractile traction forces generated by the migrating cells at their leading edge. We make a distinction between the traction forces by migrating cells and the forces that arise from the contractile behaviour of stationary cells within the seeding region. It is not currently clear how exactly these forces within the seeding and migration regions evolve and whether the shifting balance between them causes the relaxation within the seeding region near the baseline. However, it is possible that the relaxation is due to a decrease in the contractile traction exerted by non-migratory cells alone. It is also possible that the migrating cell sheet exerts a pulling force (in the +x-direction) that contributes to the partial recovery of compression within the seeding region. It is interesting to note that, by 24 h into the experiments, the average magnitude of compression underneath the migrating cell sheet had become greater than the compression within the seeding region for both collagen densities illustrated in figure 9. An intriguing question that is raised from this observation is whether cells in locomotion could exert an increased amount of force on the matrix when compared with adjacent quiescent cells. Since the current assay does not provide a direct mean for the estimation of surface traction forces, answering this question will require further research. We believe a detailed analysis of deformation gradients across the hydrogel surface will provide further insight into the relative magnitudes of cellular traction forces during contraction and migration.
The presence of a delay in initiation of migration on collagen matrices with respect to the glass control suggests that architectural remodelling of collagen matrices may be playing a role in the cell motility decision-making process through dynamic alteration of the local matrix microstructure and mechanical properties. The underlying mechanisms of collagen fibril flow, alignment and mechanical tension may help gradually create a mechanical environment that is more favourable for migration than the initial state of the substrate. In particular, fibril flow changes the matrix porosity and the concentration of binding domains available for cell surface receptors. In addition, anisotropic expansion within the cell-free region can result in alignment of collagen fibrils in the direction perpendicular to the baseline, which may have served as a cue for guiding directional migration. There are numerous reports of cells following aligned collagen fibrils during their motion [15,40,41]. Finally, the tension built up within the cell-free region can lead to local strain stiffening and result in an increase in the effective stiffness experienced by cells at cell–matrix adhesions. Moreover, the increase in the effective modulus can be one of the ways the collagen matrix is primed so that it can sustain the traction forces necessary to mobilize cells during migration [42,43].
The idea that the remodelling phase serves a functional role in reinforcing the matrix to sustain traction stresses is also supported by the dependence of both the time of onset of migration and the magnitude of deformation on the initial matrix stiffness. In particular, the duration of the migration delay increased with decreasing collagen density, and the magnitude of deformation was greatest for lowest density collagen at the onset of migration. In other words, the collagen matrix with the lowest initial compressive stiffness and highest porosity also experienced the greatest delay in migration and underwent the greatest degree of remodelling.
Despite its constant occurrence on collagen substrates, whether the remodelling phase was required for initiation of migration on collagen remains an open question. There are differences between the collagen matrices and glass substrates that extend beyond the ability to deform, which were not controlled for in this study. The presence of a porous structure in the collagen matrix as well as inherent differences in binding domain density and substrate stiffness could have an effect on the cell migratory behaviour through mechanisms that do not involve deformation. Our results also lead to an interesting question of whether there was an effective stiffness threshold attained by the matrix during remodelling above which cells were enabled to migrate on collagen matrices. Investigation of this aspect requires further study and will benefit from in situ measurements of local stiffness by atomic force microscopy and/or nano-indentation.
The unidirectional expansion of the fibroblast monolayer represents coordinated or guided movement of individual fibroblasts that took place on all substrates including the glass control. Since fibroblasts do not form persistent cell–cell adhesions, the mass migration of fibroblasts in this context is different from collective migration where cells achieve coordination by the formation and maintenance of cell–cell contacts [17,44]. Instead, the overall persistent movement of fibroblasts away from the seeding region seems to be guided by asymmetric collisions of neighbouring cells that drive them across negative gradients of local cell density [45]. This exclusion effect is separate from either durotaxis or haptotaxis, which may have occurred due to the formation of gradients of ECM stiffness or binding site density by the previously described matrix remodelling. While such gradients within the matrix coincidently develop in the predominant direction of mass migration, it is not certain from the current study whether these forms of mechanotaxis have taken place up to a broad extent within the migration region. However, we have occasionally observed the formation of local clusters across the baseline, particularly on low density collagen. These are hallmark examples of durotaxis occurring in a local context [11,18].
The observed differences in the speed and persistence of the migrating cells between soft and stiff substrates could be explained by the differences in local cell density. It has been reported that the speed of single cells in a monolayer tends to decrease with increasing cell packing density [45]. High cell packing density is also associated with a jamming effect in which contingent blocks of cells that move in a common direction are created [46]. These two effects could provide an explanation for the transition between the fast but tortuous motion of cells on low density collagen to the slow but stream-like motion of cells on a glass substrate. The number of cells migrating on low density collagen after 48 h was lower than that on high density collagen and the glass substrate. These results are in agreement with Pan et al. [15], who found that a decrease in substrate stiffness also resulted in a decrease in the number of fibroblasts migrating from a droplet densely packed with cells onto a hydrogel. The density-dependent delay in the initiation of migration could explain why cells on collagen matrices travelled shorter distances while having higher ‘spontaneous’ velocities than those of cells on glass.
In addition to the local cell density, we anticipate that local gradients in the effective matrix stiffness and density generated by remodelling activities of individual cells also played a role in guidance of migration and could have contributed to the observed differences in dynamic migration metrics between different collagen substrates. In particular, diminished directional persistence with decreased collagen density, as indicated by increased path tortuosity, correlates with an increased level of mean strain and strain anisotropy in our experiments. Interestingly, such a mechanical bias, when applied globally and consistently across a medium, has been recognized to act as a guidance cue that enhances the directional persistence of migrating cells. For instance, in a previous collagen–fibrin wound model, the directional persistence of fibroblast migration increased in the presence of strain anisotropy generated by partial mechanical restraint of the tissue [47]. In contrast, our observation in the present study shows that cells follow more tortuous paths when migrating on softer collagen substrates, while experiencing the greatest level of mean deformation and strain anisotropy. A possible reason for this difference is that individually migrating cells can remodel soft substrates more easily and generate the variations in effective matrix stiffness and density in their vicinity. An earlier report indicates that human mammary fibroblasts can generate a fivefold increase in Young's modulus across a 100 µm distance in front of their leading edge when they are on collagen matrices with approximately 100 Pa nominal stiffness, similar to that of low density collagen matrix used in this study [42]. Apart from the globally persistent stain anisotropy, such local gradients in substrate properties could transiently guide other cells in the vicinity, and contribute to frequent alteration of the migration direction for cells on a soft collagen matrix. In summary, the cell–matrix and cell–cell interactions during mass migration are complex and cannot be fully explained by the mechanobiology of single cell migration on substrates.
Quiescent cells near the baseline aligned in a direction parallel to the hydrogel short axis (y-axis) and perpendicular to the direction of compaction (x-axis) as inferred by nucleus orientation in that region. The alignment may be caused by the restrained matrix configuration where the hydrogel was anchored at four support posts as well as at the boundaries of the rectangular culture chamber to prevent tissue-wide displacements. Under these conditions, restraining forces are expected to develop preferentially along the hydrogel short axis and provide a relatively higher mechanical resistance in that direction. Our observations are consistent with a previous study where fibroblasts responded to matrix anisotropy by alignment along the axis of highest mechanical resistance [48]. It is important to note that global restraining of hydrogel in this manner does not preclude the development of local deformation and stresses within, which was the primary focus of this study.
There are several limitations of this study with respect to the characterization of cell migration and collagen mechanical properties. While there were cells that emerged from the baseline only to return into the seeding region shortly after, the crowding in the vicinity of this region precluded accurate tracking of those cells based on the present QD labelling. As a result, the tracking method selected cells that started in the seeding region and wandered into less densely populated regions so that they remained distinguishable from the neighbouring cells at all time points. Any potential bias in the analysis resulting from exclusion of cells returning to the seeding region would be present for all treatment groups and we consider its effect on quantified cell speed and path tortuosity to be minimal.
In this study, time-resolved deformation fields were obtained that could be used to further estimate the traction forces based on the measured mechanical properties. However, we considered the bulk compressive modulus obtained by DMA only for qualitative comparison and ranking of the collagen substrates with respect to their mechanical rigidity. This is mainly because indirect estimation of the traction stresses within collagen still remains highly challenging due to difficulties in modelling the complex mechanical behaviour of collagen networks [41,49,50]. In particular, collagen matrices exhibit fibril alignment and strain stiffening under tension [51,52], but undergo fibril buckling, and plastic deformation during compression [50], which can result in a higher effective modulus in tension than in compression. Therefore, the bulk compressive modulus estimated by the poroelastic model in the present study could be underestimating the effective modulus, particularly at regions that were under net tension. In addition, collagen matrices exhibit nonlinear, inelastic behaviour under physiologically relevant rates and amounts of deformation [53,54]. Given the deformation in excess of 20% observed under the current experimental settings, the part of the deformation is likely to be plastic [53]. Quantitative assessment of traction forces within collagen will require in situ measurement of the effective matrix stiffness [42] and computational models that take into account the nonlinear, inelastic properties of the matrix [50].
Our main interest in this study has been modulating the collagen matrix mechanical environment by controlling substrate rigidity through variation of collagen density. However, matrix microstructural characteristics are also affected by collagen density. Porosity and pore size are particularly important since these are indicative of the ligand density presented on the matrix surface for cell–matrix adhesion [55]. It is reported that ligand density rather than substrate stiffness can determine fibroblast morphology [56]. We, therefore, also reported preliminary estimates for porosity based on the measured hydraulic conductivity (electronic supplementary material, figure S5). For quantification of other microstructural metrics such as void area fraction and fibre diameter, we refer the reader to our previous studies where we performed morphological assessment of collagen matrices using scanning electron microscopy [19,20,57].
5. Conclusion
In this study, a new in vitro fibroblast–collagen matrix platform was developed that allows simultaneous measurement of cellular movement and matrix deformation. It was found that fibroblasts collectively generate mechanical forces large enough to dramatically deform the collagen matrices and alter their mechanical environments. Cells on soft and stiff collagen substrates migrated at different speeds and showed different directional persistence, whose overall effect was an increased level of matrix infiltration on stiffer collagen matrices. Compliant substrates such as collagen matrices can represent the mechanical aspects of granulation tissue in early-phase wound healing. The findings in this study could be useful in the design of collagen-based biomaterials for regenerative therapy and improved wound healing outcomes.
Supplementary Material
Acknowledgements
We acknowledge Caroline Wilmes for her contributions in carrying out preliminary experiments.
Data accessibility
This article has no additional data.
Authors' contributions
A.O., J.C.D., F.G. and B.H. designed the study. A.O. performed the experiments and data analysis. A.O., J.C.D., F.G. and B.H. discussed the findings. A.O. and B.H. drafted the manuscript. All authors gave final approval for publication.
Competing interests
We have no competing interests.
Funding
This study was funded partially by grant no. R01 EB008388 from the National Institutes of Health/National Institute of Biomedical Imaging and Bioengineering, grant no. CBET-1009465 from the National Science Foundation, and an OVPR Incentive Grant from Purdue University. B.H. was also supported by the B.S.F. Schaefer Award.
References
- 1.Li B, Wang JH-C. 2011. Fibroblasts and myofibroblasts in wound healing: force generation and measurement. J. Tissue Viability 20, 108–120. ( 10.1016/j.jtv.2009.11.004) [DOI] [PMC free article] [PubMed] [Google Scholar]
- 2.Gaggioli C, Hooper S, Hidalgo-Carcedo C, Grosse R, Marshall JF, Harrington K, Sahai E. 2007. Fibroblast-led collective invasion of carcinoma cells with differing roles for RhoGTPases in leading and following cells. Nat. Cell Biol. 9, 1392–U1392 ( 10.1038/ncb1658) [DOI] [PubMed] [Google Scholar]
- 3.Karagiannis GS, Poutahidis T, Erdman SE, Kirsch R, Riddell RH, Diamandis EP. 2012. Cancer-associated fibroblasts drive the progression of metastasis through both paracrine and mechanical pressure on cancer tissue. Mol. Cancer Res. 10, 1403–1418. ( 10.1158/1541-7786.MCR-12-0307) [DOI] [PMC free article] [PubMed] [Google Scholar]
- 4.Tomasek JJ, Gabbiani G, Hinz B, Chaponnier C, Brown RA. 2002. Myofibroblasts and mechano-regulation of connective tissue remodelling. Nat. Rev. Mol. Cell Biol. 3, 349–363. ( 10.1038/nrm809) [DOI] [PubMed] [Google Scholar]
- 5.Broussard KC, Powers JG. 2013. Wound dressings: selecting the most appropriate type. Am. J. Clin. Dermatol. 14, 449–459. ( 10.1007/s40257-013-0046-4) [DOI] [PubMed] [Google Scholar]
- 6.Abou Neel EA, Bozec L, Knowles JC, Syed O, Mudera V, Day R, Hyun JK. 2013. Collagen—emerging collagen based therapies hit the patient. Adv. Drug Deliv. Rev. 65, 429–456. ( 10.1016/j.addr.2012.08.010) [DOI] [PubMed] [Google Scholar]
- 7.Singer AJ, Clark RAF. 1999. Cutaneous wound healing. N. Engl. J. Med. 341, 738–746. ( 10.1056/NEJM199909023411006) [DOI] [PubMed] [Google Scholar]
- 8.Discher DE, Janmey P, Wang YL. 2005. Tissue cells feel and respond to the stiffness of their substrate. Science 310, 1139–1143. ( 10.1126/science.1116995) [DOI] [PubMed] [Google Scholar]
- 9.Wiegand C, White R. 2013. Microdeformation in wound healing. Wound Repair Regen. 21, 793–799. ( 10.1111/wrr.12111) [DOI] [PubMed] [Google Scholar]
- 10.Hadjipanayi E, Mudera V, Brown RA. 2009. Guiding cell migration in 3D: a collagen matrix with graded directional stiffness. Cell Motil. Cytoskeleton 66, 121–128. ( 10.1002/cm.20331) [DOI] [PubMed] [Google Scholar]
- 11.Lo CM, Wang HB, Dembo M, Wang YL. 2000. Cell movement is guided by the rigidity of the substrate. Biophys. J. 79, 144–152. ( 10.1016/S0006-3495(00)76279-5) [DOI] [PMC free article] [PubMed] [Google Scholar]
- 12.Guo WH, Frey MT, Burnham NA, Wang YL. 2006. Substrate rigidity regulates the formation and maintenance of tissues. Biophys. J. 90, 2213–2220. ( 10.1529/biophysj.105.070144) [DOI] [PMC free article] [PubMed] [Google Scholar]
- 13.Kuboki T, Chen W, Kidoaki S. 2014. Time-dependent migratory behaviors in the long-term studies of fibroblast durotaxis on a hydrogel substrate fabricated with a soft band. Langmuir 30, 6187–6196. ( 10.1021/la501058j) [DOI] [PMC free article] [PubMed] [Google Scholar]
- 14.McClain SA, Simon M, Jones E, Nandi A, Gailit JO, Tonnesen MG, Newman D, Clark RAF. 1996. Mesenchymal cell activation is the rate-limiting step of granulation tissue induction. Am. J. Pathol. 149, 1257–1270. [PMC free article] [PubMed] [Google Scholar]
- 15.Pan Z, Ghosh K, Hung V, Macri LK, Einhorn J, Bhatnagar D, Simon M, Clark RAF, Rafailovich MH. 2013. Deformation gradients imprint the direction and speed of en masse fibroblast migration for fast healing. J. Invest. Dermatol. 133, 2471–2479. ( 10.1038/jid.2013.184) [DOI] [PMC free article] [PubMed] [Google Scholar]
- 16.Rorth P. 2009. Collective cell migration. Annu. Rev. Cell Dev. Biol. 25, 407–429. ( 10.1146/annurev.cellbio.042308.113231) [DOI] [PubMed] [Google Scholar]
- 17.Sunyer R, et al. 2016. Collective cell durotaxis emerges from long-range intercellular force transmission. Science 353, 1157–1161. ( 10.1126/science.aaf7119) [DOI] [PubMed] [Google Scholar]
- 18.Rhee S, Ho C-H, Grinnell F. 2010. Promigratory and procontractile growth factor environments differentially regulate cell morphogenesis. Exp. Cell Res. 316, 232–244. ( 10.1016/j.yexcr.2009.09.021) [DOI] [PMC free article] [PubMed] [Google Scholar]
- 19.Ozcelikkale A, Han B. 2016. Thermal destabilization of collagen matrix hierarchical structure by freeze/thaw. PLoS ONE 11, e0146660 ( 10.1371/journal.pone.0146660) [DOI] [PMC free article] [PubMed] [Google Scholar]
- 20.Han B, Miller JD, Jung JK. 2009. Freezing-induced fluid-matrix interaction in poroelastic material. J. Biomech. Eng. 131, 21002 ( 10.1115/1.3005170) [DOI] [PMC free article] [PubMed] [Google Scholar]
- 21.Bower AF. 2009. Applied mechanics of solids. Boca Raton, FL: CRC Press. [Google Scholar]
- 22.Truskey GA, Yuan F, Katz DF. 2009. Transport phenomena in biological systems, 2nd edn Upper Saddle River, NJ: Pearson Prentice Hall. [Google Scholar]
- 23.Biot MA. 1972. Theory of finite deformations of porous solids. Indiana Univ. Math. J. 21, 597–620. ( 10.1512/iumj.1972.21.21048) [DOI] [Google Scholar]
- 24.Armstrong CG, Lai WM, Mow VC. 1984. An analysis of the unconfined compression of articular cartilage. J. Biomech. Eng. 106, 165–173. ( 10.1115/1.3138475) [DOI] [PubMed] [Google Scholar]
- 25.Currie J, Wilson DI. 2012. OPTI: lowering the barrier between open source optimizers and the industrial MATLAB user. In Proc. of FOCAPO 2012 Foundations of computer-aided process operations, Savannah, GA, 8–13 January 2012 (eds N Sahinidis, J Pinto), p. 32 See http://focapo.cheme.cmu.edu/2012/proceedings/data/start.htm.
- 26.Willert CE, Gharib M. 1991. Digital particle image velocimetry. Exp. Fluids 10, 181–193. ( 10.1007/BF00190388) [DOI] [Google Scholar]
- 27.Scarano F. 2002. Iterative image deformation methods in PIV. Meas. Sci. Technol. 13, R1–R19. ( 10.1088/0957-0233/13/1/201) [DOI] [Google Scholar]
- 28.Roeder BA, Kokini K, Voytik-Harbin SL.. 2009. Fibril microstructure affects strain transmission within collagen extracellular matrices. J. Biomech. Eng. 131, 031004 ( 10.1115/1.3005331) [DOI] [PubMed] [Google Scholar]
- 29.Roeder BA, Kokini K, Robinson JP, Voytik-Harbin SL. 2004. Local, three-dimensional strain measurements within largely deformed extracellular matrix constructs. J. Biomech. Eng. 126, 699–708. ( 10.1115/1.1824127) [DOI] [PubMed] [Google Scholar]
- 30.Hu ZX, Luo HY, Young W, Lu HB. 2013. Incremental digital volume correlation for large deformation measurement of PMI foam in compression, pp. 721–726. New York, NY: Asme. [Google Scholar]
- 31.Jaqaman K, Loerke D, Mettlen M, Kuwata H, Grinstein S, Schmid SL, Danuser G. 2008. Robust single-particle tracking in live-cell time-lapse sequences. Nat. Methods 5, 695–702. ( 10.1038/nmeth.1237) [DOI] [PMC free article] [PubMed] [Google Scholar]
- 32.Schindelin J, et al. 2012. Fiji: an open-source platform for biological-image analysis. Nat. Methods 9, 676–682. ( 10.1038/nmeth.2019) [DOI] [PMC free article] [PubMed] [Google Scholar]
- 33.Rothman KJ. 1990. No adjustments are needed for multiple comparisons. Epidemiology 1, 43–46. ( 10.1097/00001648-199001000-00010) [DOI] [PubMed] [Google Scholar]
- 34.Perneger TV. 1998. What's wrong with Bonferroni adjustments. Br. Med. J. 316, 1236–1238. ( 10.1136/bmj.316.7139.1236) [DOI] [PMC free article] [PubMed] [Google Scholar]
- 35.Bender R, Lange S. 2001. Adjusting for multiple testing—when and how? J. Clin. Epidemiol. 54, 343–349. ( 10.1016/S0895-4356(00)00314-0) [DOI] [PubMed] [Google Scholar]
- 36.Hinz B, Darby IA, Gabbiani G, Desmouliere A.2011. The role of the myofibroblast in fibrosis and cancer progression. Dordrecht, The Netherlands: Springer.
- 37.Dubin-Thaler BJ, et al. 2008. Quantification of cell edge velocities and traction forces reveals distinct motility modules during cell spreading. PLoS ONE 3, e3735 ( 10.1371/journal.pone.0003735) [DOI] [PMC free article] [PubMed] [Google Scholar]
- 38.Grinnell F, Ho CH, Lin YC, Skuta G. 1999. Differences in the regulation of fibroblast contraction of floating versus stressed collagen matrices. J. Biol. Chem. 274, 918–923. ( 10.1074/jbc.274.2.918) [DOI] [PubMed] [Google Scholar]
- 39.Fernandez P, Bausch AR. 2009. The compaction of gels by cells: a case of collective mechanical activity. Integr. Biol. 1, 252–259. ( 10.1039/b822897c) [DOI] [PubMed] [Google Scholar]
- 40.Sawhney RK, Howard J. 2002. Slow local movements of collagen fibers by fibroblasts drive the rapid global self-organization of collagen gels. J. Cell Biol. 157, 1083 ( 10.1083/jcb.200203069) [DOI] [PMC free article] [PubMed] [Google Scholar]
- 41.Gjorevski NS, Piotrowski A, Varner VD, Nelson CM. 2015. Dynamic tensile forces drive collective cell migration through three-dimensional extracellular matrices. Sci. Rep. 5, 11458 ( 10.1038/srep11458) [DOI] [PMC free article] [PubMed] [Google Scholar]
- 42.van Helvert S, Friedl P. 2016. Strain stiffening of fibrillar collagen during individual and collective cell migration identified by AFM nanoindentation. ACS Appl. Mater. Interfaces 8, 21 946–21 955. ( 10.1021/acsami.6b01755) [DOI] [PubMed] [Google Scholar]
- 43.Miron-Mendoza M, Seemann J, Grinnell F. 2008. Collagen fibril flow and tissue translocation coupled to fibroblast migration in 3D collagen matrices. Mol. Biol. Cell 19, 2051–2058. ( 10.1091/mbc.E07-09-0930) [DOI] [PMC free article] [PubMed] [Google Scholar]
- 44.Tambe DT, et al. 2011. Collective cell guidance by cooperative intercellular forces. Nat. Mater. 10, 469–475. ( 10.1038/nmat3025) [DOI] [PMC free article] [PubMed] [Google Scholar]
- 45.Vedel SR, Tay S, Johnston DM, Bruus H, Quake SR. 2013. Migration of cells in a social context. Proc. Natl Acad. Sci. USA 110, 129–134. ( 10.1073/pnas.1204291110) [DOI] [PMC free article] [PubMed] [Google Scholar]
- 46.Sadati M, Taheri Qazvini N, Krishnan R, Park CY, Fredberg JJ. 2013. Collective migration and cell jamming. Differentiation 86, 121–125. ( 10.1016/j.diff.2013.02.005) [DOI] [PMC free article] [PubMed] [Google Scholar]
- 47.Rouillard AD, Holmes JW. 2014. Mechanical boundary conditions bias fibroblast invasion in a collagen-fibrin wound model. Biophys. J. 106, 932–943. ( 10.1016/j.bpj.2013.12.002) [DOI] [PMC free article] [PubMed] [Google Scholar]
- 48.Karamichos D, Lakshman N, Petroll WM. 2007. Regulation of corneal fibroblast morphology and collagen reorganization by extracellular matrix mechanical properties. Invest. Ophthalmol. Vis. Sci. 48, 5030–5037. ( 10.1167/iovs.07-0443) [DOI] [PMC free article] [PubMed] [Google Scholar]
- 49.Stout DA, Bar-Kochba E, Estrada JB, Toyjanova J, Kesari H, Reichner JS, Franck C. 2016. Mean deformation metrics for quantifying 3D cell–matrix interactions without requiring information about matrix material properties. Proc. Natl Acad. Sci. USA 113, 2898–2903. ( 10.1073/pnas.1510935113) [DOI] [PMC free article] [PubMed] [Google Scholar]
- 50.Steinwachs J, Metzner C, Skodzek K, Lang N, Thievessen I, Mark C, Münster S, Aifantis KE, Fabry B. 2016. Three-dimensional force microscopy of cells in biopolymer networks. Nat. Methods 13, 171–176. ( 10.1038/nmeth.3685) [DOI] [PubMed] [Google Scholar]
- 51.Motte S, Kaufman LJ. 2013. Strain stiffening in collagen I networks. Biopolymers 99, 35–46. ( 10.1002/bip.22133) [DOI] [PubMed] [Google Scholar]
- 52.Vader D, Kabla A, Weitz D, Mahadevan L.. 2009. Strain-induced alignment in collagen gels. PLoS ONE 4, e5902 ( 10.1371/journal.pone.0005902) [DOI] [PMC free article] [PubMed] [Google Scholar]
- 53.Mohammadi H, Arora PD, Simmons CA, Janmey PA, McCulloch CA. 2015. Inelastic behaviour of collagen networks in cell–matrix interactions and mechanosensation. J. R. Soc. Interface 12, 20141074 ( 10.1098/rsif.2014.1074) [DOI] [PMC free article] [PubMed] [Google Scholar]
- 54.Wen Q, Janmey PA. 2013. Effects of non-linearity on cell–ECM interactions. Exp. Cell Res. 319, 2481–2489. ( 10.1016/j.yexcr.2013.05.017) [DOI] [PMC free article] [PubMed] [Google Scholar]
- 55.Moreno-Arotzena O, Meier JG, del Amo C, García-Aznar JM. 2015. Characterization of fibrin and collagen gels for engineering wound healing models. Materials (Basel) 8, 1636–1651. ( 10.3390/ma8041636) [DOI] [PMC free article] [PubMed] [Google Scholar]
- 56.Miron-Mendoza M, Seemann J, Grinnell F. 2010. The differential regulation of cell motile activity through matrix stiffness and porosity in three dimensional collagen matrices. Biomaterials 31, 6425–6435. ( 10.1016/j.biomaterials.2010.04.064) [DOI] [PMC free article] [PubMed] [Google Scholar]
- 57.Xu Z, Ozcelikkale A, Kim YL, Han B. 2013. Spatiotemporal characterization of extracellular matrix microstructures in engineered tissue: a whole-field spectroscopic imaging approach. J. Nanotechnol. Eng. Med. 4, 110 051–110 059. ( 10.1115/1.4024130) [DOI] [PMC free article] [PubMed] [Google Scholar]
Associated Data
This section collects any data citations, data availability statements, or supplementary materials included in this article.
Supplementary Materials
Data Availability Statement
This article has no additional data.


