Abstract
Objectives:
The basis for over-representation of colorectal cancer (CRC) in African-American (AA) populations compared with Caucasians are multifactorial and complex. Understanding the mechanisms for this racial disparity is critical for delivery of better care. Several studies have investigated sporadic CRC for differences in somatic mutations between AAs and Caucasians, but owing to small study sizes and conflicting results to date, no definitive conclusions have been reached.
Methods:
Here, we present the first systematic literature review and meta-analysis investigating the mutational differences in sporadic CRC between AAs and Caucasians focused on frequent driver mutations (APC,TP53, KRAS,PI3CA, FBXW7,SMAD4, and BRAF). Publication inclusion criteria comprised sporadic CRC, human subjects, English language, information on ethnicity (AA, Caucasian, or both), total subject number >20, and information on mutation frequencies.
Results:
We identified 6,234 publications. Meta-analysis for APC, TP54, FBXW7, or SMAD4 was not possible owing to paucity of data. KRAS mutations were statistically less frequent in non-Hispanic Whites when compared with AAs (odds ratio, 0.640; 95% confidence interval (CI): 0.5342–0.7666; P=0.0001), while the mutational differences observed in BRAF and PI3CA did not reach statistical significance.
Conclusions:
Here, we report the mutational patterns for KRAS, BRAF, and PI3CA in sporadic CRC of AAs and Caucasians in a systematic meta-analysis of previously published data. We identified an increase in KRAS mutations in sporadic CRC in AAs, which may contribute to worse prognosis and increased mortality of CRC in AAs. Future studies investigating health-care disparities in CRC in AAs should control for KRAS mutational frequency.
Introduction
Colorectal cancer (CRC) is the third most common cause of cancer-related death in the United States and is expected to result in ~49 000 deaths in 2016.1 African Americans (AAs) have higher incidence of CRC and increased CRC mortality rates compared with Caucasians.1 In addition, AAs have more right-sided cancers,2 are diagnosed with CRC at earlier ages,3 and have a higher percentage of late-stage disease compared with Caucasians at the time of diagnosis.4 The basis for this are most likely multifactorial and complex. Possible underlying factors include differences in diet,5 gut microbiome,6 and inflammatory conditions such as obesity,7 as well as variances in disease-specific gene mutations that may be playing important roles in sporadic CRC development. In addition to genetics and environmental factors, reduced health-care literacy and lower socioeconomic status are also thought to contribute to health-care disparities with regards to CRC.
Lower socioeconomic status was repeatedly shown to have an impact on CRC prognosis;8, 9 however, certain minorities that are as strongly connected to a lower socioeconomic status as AAs, such as Indigenous populations on Hawaii or Hispanics, have equal or even lower CRC incidence and mortality when compared with Caucasians.10, 11 This strongly suggests that there are other specific causes for the health-care disparities seen in AAs with regards to CRC. One of the reasons why overall CRC incidence declined over the last decades is most certainly due to increased screening efforts.12 A decline in CRC incidence and mortality was also noted in AAs, however, especially older AAs who had less education and income had lower screening compared with Caucasians. This significantly contributed to persistent disparities among these groups,13 but is unlikely to be the only cause.
Even though the development of CRC is widely accepted to be driven by the sequential acquisition of somatic mutations,14 it is not yet understood whether the acquisition process is different in AAs and Caucasians. A difference in the frequency of sporadic somatic mutations in AAs and Caucasian CRC patients has been proposed before.15 However, most studies have limited study sizes or only partly controlled for additional confounders. While some investigations in this matter did not yield definitive results,16 other studies reported on differences that have not yet17 been reproduced. A recent report by Yoon et al.18 demonstrated different mutational frequencies in AAs, Caucasians, and Asians, but was limited to UICC stage III CRCs. These discrepancies in study results could be due to variations in study sizes, differences in study populations, and perhaps due to the substantial heterogeneity in the genetics and lifestyles of individuals self-identifying as AAs or Caucasians. Recently, a meta-analysis investigating the frequency of microsatellite instability, a characteristic of less aggressive and hypermutated CRCs, found no statistically significant difference between AAs and non-Hispanic Whites (NHWs), albeit microsatellite instability frequency trended to be lower in AAs.19 Even though statistical significance was not reached, this study hints toward biologically different CRC in AAs and Caucasians.
To better characterize the differences in high-frequency mutations in AA and Caucasian CRCs, we performed the first systematic literature review and meta-analysis to obtain a larger data set to overcome above limitations. An improved understanding of the underlying causes of CRC health-care disparities would benefit both AA communities through more effective prevention and treatment options, and all CRC patients through a deeper understanding of the complex pathophysiology of CRC development.
Methods
Identification of high-frequency driver mutations
The algorithm published by Lopez-Bigas et al.20 was used to identify the seven most common driver mutations in The Cancer Genome Atlas colorectal data set.21 To increase the likelihood of reaching statistical significance, we focused on high-frequency mutations.
Literature search
The search query that was used to identify studies was ("Colorectal Neoplasms"[Mesh] OR "Rectal Neoplasms"[Mesh] OR "Colonic Neoplasms"[Mesh] OR colorectal cancer OR colon cancer OR rectal cancer) AND ("Mutation"[Mesh] OR mutation OR mutated) AND (APC OR "Genes, APC"[Mesh] OR "Adenomatous Polyposis Coli Protein"[Mesh] OR PI3CA OR "Phosphatidylinositol 3-Kinases"[Mesh] OR "PIK3CA protein, human" [Supplementary Concept] OR TP53 OR "Genes, p53"[Mesh] OR "Tumor Suppressor Protein p53"[Mesh] OR KRAS OR "Genes, ras"[Mesh] OR "KRAS protein, human" [Supplementary Concept] OR SMAD4 OR DPC4 OR MADH4 OR "Smad4 Protein"[Mesh] OR BRAF OR "BRAF protein, human" [Supplementary Concept] OR "Proto-Oncogene Proteins B-raf"[Mesh] OR FBXW7 OR "FBXW7 protein, human" [Supplementary Concept]). Both protein and gene names plus Mesh terms were used to include all studies possibly reporting on any of our target mutations in CRC.
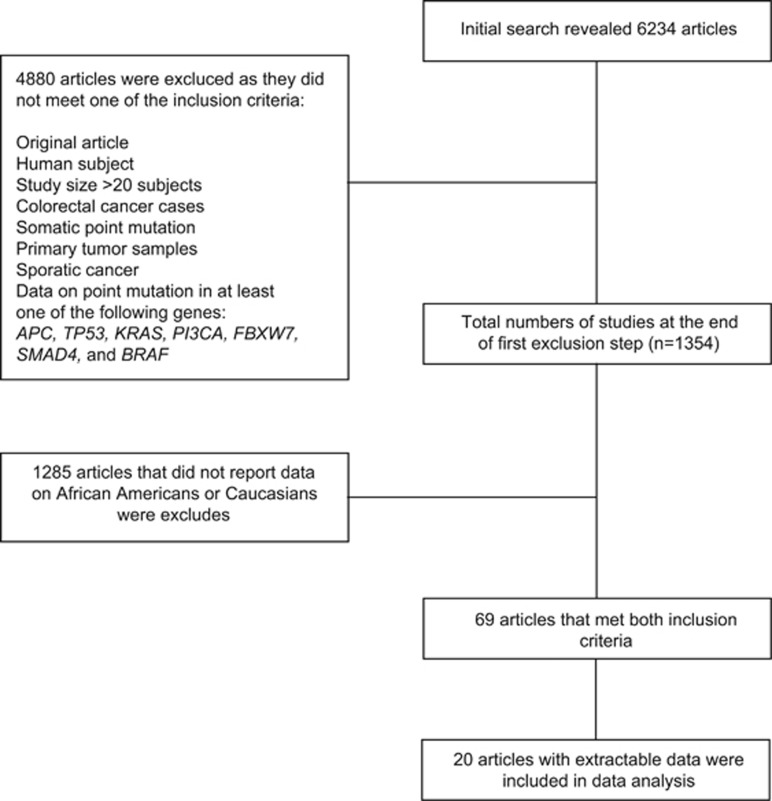
We searched the MEDLINE database. Each hit was screened by two individual investigators, using a two-step inclusion process. In the first step, inclusion criteria were original article, English language, human subjects, subject number >20, CRC, somatic point mutations identified in primary tumor sample, sporadic cancer, and data on point mutation in at least one of the following genes: APC, TP53, KRAS,PI3CA,FBXW7,SMAD4, and BRAF. No time period was defined to include the maximum possible number of studies. In a second step, we included only case–control studies reporting on at least one of the target mutations and information on both AAs and Caucasians (Figure 1). For our study, White and Caucasian as well as Black and AA were used synonymously. We will use the terms Caucasian and AA for the remaining sections of this manuscript for the sake of readability, but are aware of the shortcomings of the binary racial paradigm.22
Figure 1.
Flow diagram of study selection process. Initial PubMed search resulted in identification of 6,234 articles. After the application of fist exclusion step, 1,354 studies remained. Following exclusion of studies that did not report data on race or did not report data in extractable fashion, 20 studies were available for final meta-analysis.
Data extraction
Data on first author, year of publication, sequencing method, number of AAs and Caucasians, mutational frequency of the target gene, stage, tumor location (distal vs. proximal), gender, and median age were extracted if data on these parameters was available. First authors of studies that reported data on mutational frequency and race in a non-extractable manner were contacted by email to collect the additional data set. Of the 49 authors contacted by email, 11 authors replied. Nine of the replies were negative; one author sent the data for confounders;16 and one author sent the data set for analysis.23
Statistical analysis
For each mutation, the meta-analysis was conducted to estimate the effect sizes between Caucasians and AAs defined by the risk ratio, the risk difference, and the odds ratio (OR), respectively. For each reported effect sizes, both fixed and random models were used. The final chosen effect size was based on test of heterogeneity of these two races. The results were consistent either using risk ratio, risk difference or OR. The effect sizes from OR were reported in our study. The forest plots were also conducted, and presented based on OR. χ2 power analysis were run using the observed effect sizes for BRAF and PI3CA using an α-level of 0.05.
We assessed study quality of studies reporting on KRAS mutations using the Newcastle–Ottowa scale.24 Statistical analysis was repeated exclusively using excellent quality studies (scores of 8/9 or 9/9). The meta-regression analyses were also performed to adjust four covariate effects including age, gender, tumor stage. and tumor site. Finally, the residual funnel plots were conducted. All of the statistical analyses were performed using R 3.3.2 version.
Results
Identification of driver mutations in CRC
First, the seven most common driver mutations in CRC were searched using an in silico approach. APC, TP53, KRAS, PI3CA, FBXW7, SMAD4, and BRAF were identified as most commonly mutated driver genes in CRC in the The Cancer Genome Atlas data set21 and where used for the literature search.
Inclusion of studies
Following initial PubMed search, 6,234 studies were identified. Using the inclusion criteria mentioned above (Figure 1), studies that reported data on target mutations in both AAs and Caucasians were identified. Of these studies, 1 reported on APC mutations,25 2 on TP53,25, 26 11 on KRAS,15, 16, 23, 25, 27, 28, 29, 30, 31, 32, 33, 34 3 on PI3CA,15, 25, 35 none on FBXW7 or SMAD4, and 6 on BRAF.15, 16, 25, 31, 32, 33 Therefore, there was not enough data to complete the meta-analysis for following targets; APC, TP54, FBXW7, and SMAD4. We proceeded with statistical analysis exclusively for KRAS, BRAF, and PI3CA with remaining total 13 studies.15, 16, 23, 25, 27, 28, 29, 30, 31, 32, 33, 34, 35
Mutational frequencies and sequencing types
Overall, all studies included in this meta- analysis used either Sanger or Pyrosequencing. For KRAS mutations, all studies reported on exon 12 and exon 13 mutations, with a subset of distinguishing between the two. For our meta-analysis, a sample with either KRAS exon 12 or KRAS exon 13 mutation was considered KRAS mutated. No study reported on other point mutations in the KRAS gene. A total of 4,648 subjects (881 AAs and 3,767 NHWs) were included for our analysis of KRAS mutations. All studies investigating BRAF mutations reported on the BRAF V600E mutation, and had a combined 2,063 subjects (924 AAs and 1,139 NHWs). In the case of PI3CA, all studies reported on mutations in exons 9 and 20, without distinguishing between the two, with a total of 662 subjects (205 AAs and 457 NHWs) included in the analysis.
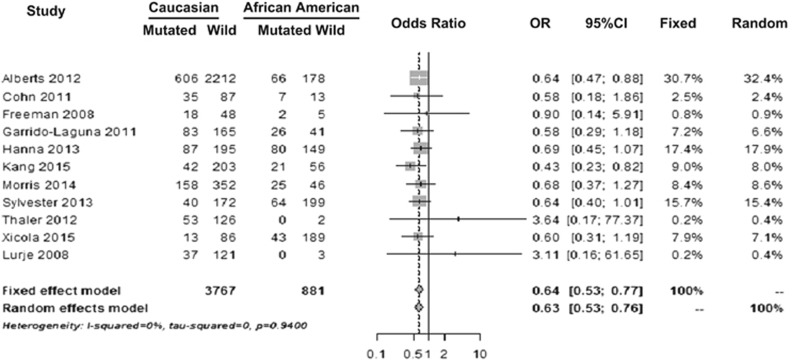
Figure 2 shows the forest plot of studies that reported KRAS mutational frequencies in Caucasians and AAs. For KRAS mutation, OR for fixed-effect model was 0.640 with 95% confidence interval (CI) (0.5342–0.7666; P<0.0001) and for random-effect model OR was 0.635 with 95% CI (0.5296–0.7608; P<0.0001). This result showed that Caucasians were 36% less likely to have mutations in the KRAS gene when compared with AAs. When repeating analysis exclusively including studies with excellent study quality as scored by the Ottowa–Newcastle scale15, 16, 27, 28, 30, 32 effect size did not substantially change the results, which remained statistically significant. Eight of 11 studies that reported KRAS mutational differences also had data available on age, gender, stage, and cancer site. Meta-regression analysis that adjusted for these covariates revealed similar distribution of these possible confounders. Mutational differences between Caucasians and AAs remained significantly different after covariate adjustment.
Figure 2.
Forest plot showing KRAS mutational frequencies in studies that reported data on Caucasians and African Americans. Odds ratio (OR) for fixed-effect model shows that Caucasians were less likely to have mutations in the KRAS gene when compared with AAs (P<0.0001).
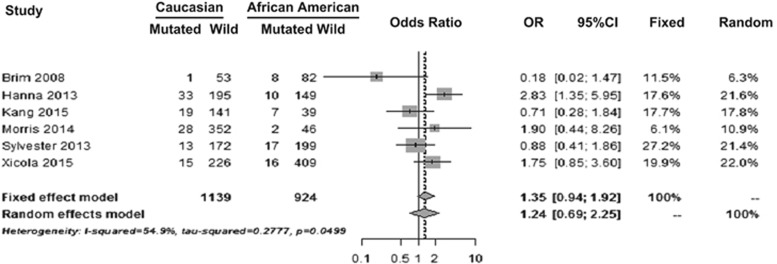
The forest plot of studies that reported mutational frequencies in BRAF in Caucasians and AAs are shown in Figure 3. For BRAF mutation, OR for fixed-effect model was 1.35 with 95% CI (0.9442–1.9177; P=0.1005) and for random-effect model OR was 1.24 with 95% CI (0.6889–2.2488; P=0.4683). Although Caucasians were 35% more likely to have BRAF mutation compared with AAs this did not reach statistical significance.
Figure 3.
Forest plot showing BRAF mutational frequencies in studies that reported data on Caucasians and African Americans (AAs). Odds ratio (OR) for fixed-effect model shows that Caucasians were more likely to have mutations in the BRAF gene when compared with AAs. However, this difference did not reach statistical significance (P=0.4683).
Figure 4 shows the forest plot of studies that reported PI3CA mutational frequencies in Caucasians and AAs. For PI3CA mutation, OR for fixed-effect model was 0.875 with 95% CI (0.5606–1.3662; P=0.5574) and for random-effect model OR was 0.870 with 95% CI (0.5587–1.3561; P=0.7735). Results indicated that Caucasians were 12.5% less likely to have PI3CA mutation compared with AAs. However, this difference was not statistically significant.
Figure 4.
Forest plot showing PI3CA mutational frequencies in studies that reported data on Caucasians and African Americans (AAs). Odds ratio (OR) for fixed-effect model shows that Caucasians were less likely to have mutations in the PI3CA gene compared with AAs. However, this difference was not statistically significant (P=0.5574).
To discern whether our results with regards to PI3CA and BRAF mutations were true negatives, we performed power analysis using the observed effect sizes and an α-level of 0.05. Power to identify in mutational frequencies for PI3CA and BRAF was 55% and 29%, respectively.
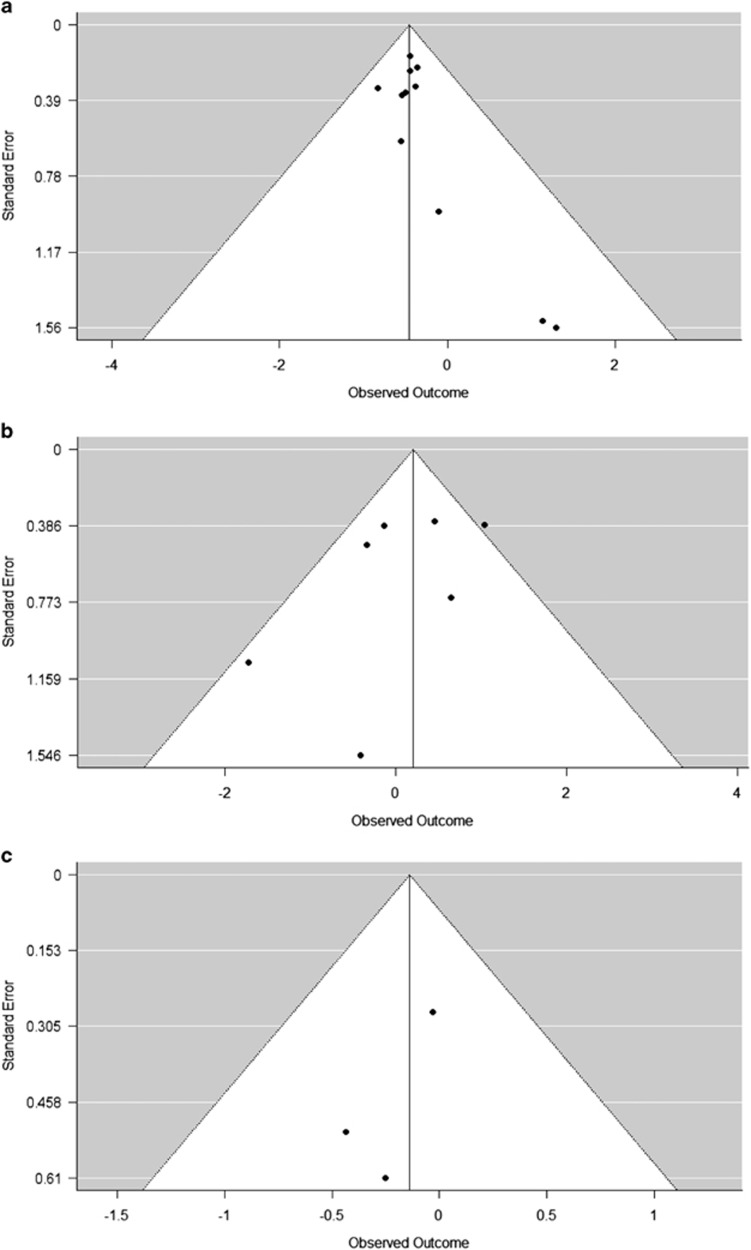
To investigate the possibility of publication bias, test of heterogeneity was run and funnel plots were created for studies that reported data on mutational differences in KRAS, BRAF, and PI3CA (Figure 5). No significant differences in regards to publication bias were found among studies that reported mutational differences on KRAS and PI3CA at α=0.05 significance level (Figure 5a, P-values 0.94 and 0.77, respectively). Funnel plot for BRAF revealed significant differences between studies (Figure 5b, P-values 0.049) at α=0.05 significance level.
Figure 5.
Funnel plots of studies that reported data on mutational frequencies in (a) KRAS, (b) BRAF, and (c) PI3CA. There were no significant differences with respect to publication bias among studies that reported mutational differences on KRAS (P=0.94) and PI3CA (P=0.77) at α=0.05 significance level. However, Funnel plot for BRAF revealed significant differences between studies (P=0.049).
Discussion
This is the first systematic literature review and meta-analysis of high-frequency somatic driver mutations in sporadic CRC in AAs and Caucasians. Our results revealed higher frequencies of KRAS mutations in AAs compared with Caucasians, with no statistically significant differences in BRAF and PI3CA mutations. As our study was underpowered with regards to BRAF and PI3CA mutations, our results do not exclude the possibility of differences in the mutational frequency of these genes between AAs and Caucasians, but underline the importance of further studies.
As activating KRAS mutations are strongly correlated with worse prognosis in sporadic CRC,36 the increased frequency of KRAS mutations in AAs may contribute to the higher mortality observed in AA CRC patients. Importantly, our results remained significant after controlling for possible confounders such as age, gender, stage, or cancer site. Therefore, the difference in KRAS mutation status is most likely a contributory factor to health-care disparities in CRC at least in AAs. KRAS mutation status should be considered as an important variable to include in future studies, especially for those studying the health-care disparities between AAs and Caucasians in CRC. Controlling for KRAS mutational status in study cohorts can perhaps improve the accuracy of final conclusion, especially if investigations focus on CRC racial health-care disparities.
KRAS mutational status also has major implications on EGFR-inhibit-based treatment, as EGFR inhibitors have been repeatedly found to be non-beneficial in patients expressing an activating KRAS mutation. Our results showed increased frequency of KRAS mutation in sporadic CRC in AAs and this finding should encourage further testing of KRAS mutational status when a diagnosis of CRC is made especially in AAs. This result indicates that EGFR inhibition is less often a therapeutic option in AAs compared with Caucasians, which translates into less treatment options for AA CRC patients underscoring the need to further study tumor biology and racial disparities.
Our study has several limitations. First, the number of studies reporting on the frequency of somatic mutations in sporadic CRC in AAs and Caucasians in an extractable manner was relatively small. This is partly due to the fact that authors do not always perform subgroup analysis or report on these mutations even if data on race is theoretically available. Detailed reporting of these mutational frequencies at least in the supplementary section of articles should be strongly encouraged. Second, in this study we used AA and Black, as well as Caucasian and White synonymously to increase the detection of reported mutational differences. Even though the utilization of binary racial categories is the standard in the field, it does not accurately reflect the complexity of genetic background in individuals self-identifying as AA.37 The haziness in the definition of racial groups may lead to the inclusion of heterogeneous groups into our analysis, thereby masking or enhancing real differences. Third, the majority of studies did not report important confounders such as age, gender, and socioeconomic status; therefore, we were not able to control for these possible confounders during BRAF and PI3CA analysis. Hopefully with adequate reporting of these covariates in future, upcoming studies can investigate the differences in somatic mutations in AAs and Caucasians while controlling for possible confounders. Fourth, we could not investigate the differences in somatic mutations in APC, TP53,FBXW7 and SMAD4 due to the paucity of studies which reported data on these targets.
In summary, sporadic somatic KRAS mutations occur more often in CRC of AAs when compared with Caucasians. This opens the field to further studies investigating what drives somatic gene mutation and how these can be distinct in frequency in different racial and ethnic groups. Large-scale clinical studies are needed to confirm this finding and also to further investigate the possibility of similar differences in other target somatic mutations.
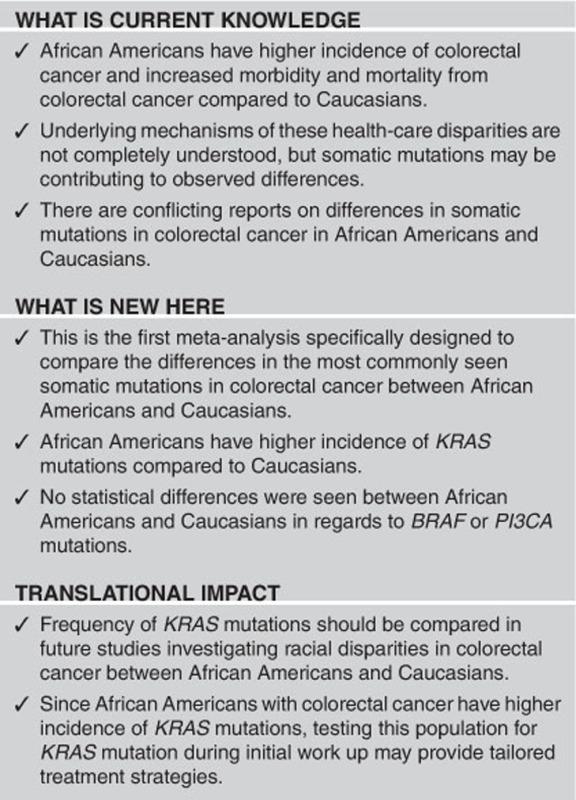
Study Highlights
Acknowledgments
This study was supported by NIH Grant R01 CA141057 (to B.J.) and the German Research Foundation stipend STA1458/1-1 (to J.J.S).
Footnotes
Guarantor of the article: Barbara Jung, MD.
Specific author contributions: J.J.S. and B.J. conceived the study; J.J.S. created the decision tree for article inclusion, organized the data retrieval; J.J.S. and C.Y. preformed initial statistical analyses and cowrote the article; J.J.S., C.Y., V.B., J.Z., A.K., and N.K. all contributed to database search and article retrieval; Y.X. performed statistical analyses and provided figures; N.K., J.J.S., and B.J. provided editorial input.
Financial support: This study was supported by NIH Grant R01 CA141057 (to B.J.) and the German Research Foundation stipend STA1458/1-1 (to J.J.S.).
Potential competing interests: None.
References
- American Cancer SocietyCancer Facts & Figures 2017. American Cancer Society: Atlanta, GA, 2017. [Google Scholar]
- Troisi RJ, Freedman AN, Devesa SS. Incidence of colorectal carcinoma in the US: an update of trends by gender, race, age, subsite, and stage, 1975–1994. Cancer 1999; 85: 1670–1676. [PubMed] [Google Scholar]
- Karami S, Young HA, Henson DE. Earlier age at diagnosis: another dimension in cancer disparity? Cancer Detect Prev 200; 31: 29–34. [DOI] [PubMed] [Google Scholar]
- Robbins AS, Siegel RL, Jemal A. Racial disparities in stage-specific colorectal cancer mortality rates from 1985 to 2008. J Clin Oncol 2012; 30: 401–405. [DOI] [PubMed] [Google Scholar]
- Satia JA, Tseng M, Galanko JA et al. Dietary patterns and colon cancer risk in Whites and African Americans in the North Carolina Colon Cancer Study. Nutr Cancer 2009; 61: 179–193. [DOI] [PMC free article] [PubMed] [Google Scholar]
- Yazici C, Wolf PG, Kim H et al. Race-dependent association of sulfidogenic bacteria with colorectal cancer. Gut 2017. [DOI] [PMC free article] [PubMed]
- Ashktorab H, Paydar M, Yazdi S et al. BMI and the risk of colorectal adenoma in African-Americans. Obesity (Silver Spring, MD) 2014; 22: 1387–1391. [DOI] [PMC free article] [PubMed] [Google Scholar]
- Aarts MJ, Lemmens VE, Louwman MW et al. Socioeconomic status and changing inequalities in colorectal cancer? A review of the associations with risk, treatment and outcome. Eur J Cancer 2010; 46: 2681–2695. [DOI] [PubMed] [Google Scholar]
- Ward E, Jemal A, Cokkinides V et al. Cancer disparities by race/ethnicity and socioeconomic status. CA Cancer J Clin 2004; 54: 78–93. [DOI] [PubMed] [Google Scholar]
- Dachs GU, Currie MJ, McKenzie F et al. Cancer disparities in indigenous Polynesian populations: Maori, Native Hawaiians, and Pacific people. Lancet Oncol 2008; 9: 473–484. [DOI] [PubMed] [Google Scholar]
- Siegel R, Desantis C, Jemal A. Colorectal cancer statistics, 2014. CA Cancer J Clin 2014; 64: 104–117. [DOI] [PubMed] [Google Scholar]
- Holme O, Bretthauer M, Fretheim A et al. Flexible sigmoidoscopy versus faecal occult blood testing for colorectal cancer screening in asymptomatic individuals. Cochrane Database Syst Rev 2013; 9: CD009259. [DOI] [PMC free article] [PubMed] [Google Scholar]
- Hoffman-Goetz L, Breen NL, Meissner H. The impact of social class on the use of cancer screening within three racial/ethnic groups in the United States. Ethn Dis 1998; 8: 43–51. [PubMed] [Google Scholar]
- Cho KR, Vogelstein B. Genetic alterations in the adenoma–carcinoma sequence. Cancer 1992; 70: 1727–1731. [DOI] [PubMed] [Google Scholar]
- Kang M, Shen XJ, Kim S et al. Somatic gene mutations in African Americans may predict worse outcomes in colorectal cancer. Cancer Biomark 2013; 13: 359–366. [DOI] [PMC free article] [PubMed] [Google Scholar]
- Xicola RM, Gagnon M, Clark JR et al. Excess of proximal microsatellite-stable colorectal cancer in African Americans from a multiethnic study. Clin Cancer Res 2014; 20: 4962–4970. [DOI] [PMC free article] [PubMed] [Google Scholar]
- Guda K, Veigl ML, Varadan V et al. Novel recurrently mutated genes in African American colon cancers. Proc Natl Acad Sci USA 2015; 112: 1149–1154. [DOI] [PMC free article] [PubMed] [Google Scholar]
- Yoon HH, Shi Q, Alberts SR et al. Racial differences in BRAF/KRAS mutation rates and survival in stage III colon cancer patients. J Natl Cancer Inst 2015; 107: 1–10. [DOI] [PMC free article] [PubMed] [Google Scholar]
- Ashktorab H, Ahuja S, Kannan L et al. A meta-analysis of MSI frequency and race in colorectal cancer. Oncotarget 2016; 7: 34546–34557. [DOI] [PMC free article] [PubMed] [Google Scholar]
- Tamborero D, Gonzalez-Perez A, Perez-Llamas C et al. Comprehensive identification of mutational cancer driver genes across 12 tumor types. Sci Rep 2013; 3: 2650. [DOI] [PMC free article] [PubMed] [Google Scholar]
- Cancer Genome Atlas N.. Comprehensive molecular characterization of human colon and rectal cancer. Nature 2012; 487: 330–337. [DOI] [PMC free article] [PubMed] [Google Scholar]
- Perea JF. The Black/White binary paradigm of race: the "normal science" of American racial thought. Calif Law Rev 1997; 85: 1213–1258. [Google Scholar]
- Lurje G, Nagashima F, Zhang W et al. Polymorphisms in cyclooxygenase-2 and epidermal growth factor receptor are associated with progression-free survival independent of K-ras in metastatic colorectal cancer patients treated with single-agent cetuximab. Clin Cancer Res 2008; 14: 7884–7895. [DOI] [PubMed] [Google Scholar]
- Wells GA, Shea B, O'Connell D et al.. The Newcastle–Ottawa scale (NOS) for assessing the quality of non-randomised studies in meta-analyseshttp://www.ohri.ca/programs/clinical_epidemiology/oxford.asp.
- Hanna MC, Go C, Roden C et al. Colorectal cancers from distinct ancestral populations show variations in BRAF mutation frequency. PLoS ONE 2013; 8: e74950. [DOI] [PMC free article] [PubMed] [Google Scholar]
- Katkoori VR, Jia X, Shanmugam C et al. Prognostic significance of p53 codon 72 polymorphism differs with race in colorectal adenocarcinoma. Clin Cancer Res 2009; 15: 2406–2416. [DOI] [PMC free article] [PubMed] [Google Scholar]
- Alberts SR, Sargent DJ, Nair S et al. Effect of oxaliplatin, fluorouracil, and leucovorin with or without cetuximab on survival among patients with resected stage III colon cancer: a randomized trial. JAMA 2012; 307: 1383–1393. [DOI] [PMC free article] [PubMed] [Google Scholar]
- Cohn AL, Shumaker GC, Khandelwal P et al. An open-label, single-arm, phase 2 trial of panitumumab plus FOLFIRI as second-line therapy in patients with metastatic colorectal cancer. Clin Colorectal Cancer 2011; 10: 171–177. [DOI] [PubMed] [Google Scholar]
- Freeman DJ, Juan T, Reiner M et al. Association of K-ras mutational status and clinical outcomes in patients with metastatic colorectal cancer receiving panitumumab alone. Clin Colorectal Cancer 2008; 7: 184–190. [DOI] [PubMed] [Google Scholar]
- Garrido-Laguna I, Hong DS, Janku F et al. KRASness and PIK3CAness in patients with advanced colorectal cancer: outcome after treatment with early-phase trials with targeted pathway inhibitors. PLoS ONE 2012; 7: e38033. [DOI] [PMC free article] [PubMed] [Google Scholar]
- Morris VK, Lucas FA, Overman MJ et al. Clinicopathologic characteristics and gene expression analyses of non-KRAS 12/13, RAS-mutated metastatic colorectal cancer. Ann Oncol 2014; 25: 2008–2014. [DOI] [PMC free article] [PubMed] [Google Scholar]
- Sylvester BE, Huo D, Khramtsov A et al. Molecular analysis of colorectal tumors within a diverse patient cohort at a single institution. Clin Cancer Res 2012; 18: 350–359. [DOI] [PMC free article] [PubMed] [Google Scholar]
- Brim H, Mokarram P, Naghibalhossaini F et al. Impact of BRAF, MLH1 on the incidence of microsatellite instability high colorectal cancer in populations based study. Mol Cancer 2008; 7: 68. [DOI] [PMC free article] [PubMed] [Google Scholar]
- Thaler J, Karthaus M, Mineur L et al. Skin toxicity and quality of life in patients with metastatic colorectal cancer during first-line panitumumab plus FOLFIRI treatment in a single-arm phase II study. BMC Cancer 2012; 12: 438. [DOI] [PMC free article] [PubMed] [Google Scholar]
- Ganesan P, Janku F, Naing A et al. Target-based therapeutic matching in early-phase clinical trials in patients with advanced colorectal cancer and PIK3CA mutations. Mol Cancer Ther 2013; 12: 2857–2863. [DOI] [PMC free article] [PubMed] [Google Scholar]
- Lievre A, Bachet JB, Boige V et al. KRAS mutations as an independent prognostic factor in patients with advanced colorectal cancer treated with cetuximab. J Clin Oncol 2008; 26: 374–379. [DOI] [PubMed] [Google Scholar]
- Bryc K, Durand EY, Macpherson JM et al. The genetic ancestry of African Americans, Latinos, and European Americans across the United States. Am J Hum Genet 2015; 96: 37–53. [DOI] [PMC free article] [PubMed] [Google Scholar]


