

Abstract
In malaria, CD4 Th1 and T follicular helper (TFH) cells are important for controlling parasite growth, but Th1 cells also contribute to immunopathology. Moreover, various regulatory CD4 T‐cell subsets are critical to hamper pathology. Yet the antigen‐presenting cells controlling Th functionality, as well as the antigens recognized by CD4 T cells, are largely unknown. Here, we characterize the MHC II immunopeptidome presented by DC during blood‐stage malaria in mice. We establish the immunodominance hierarchy of 14 MHC II ligands derived from conserved parasite proteins. Immunodominance is shaped differently whether blood stage is preceded or not by liver stage, but the same ETRAMP‐specific dominant response develops in both contexts. In naïve mice and at the onset of cerebral malaria, CD8α+ dendritic cells (cDC1) are superior to other DC subsets for MHC II presentation of the ETRAMP epitope. Using in vivo depletion of cDC1, we show that cDC1 promote parasite‐specific Th1 cells and inhibit the development of IL‐10+ CD4 T cells. This work profiles the P. berghei blood‐stage MHC II immunopeptidome, highlights the potency of cDC1 to present malaria antigens on MHC II, and reveals a major role for cDC1 in regulating malaria‐specific CD4 T‐cell responses.
Keywords: CD4 T cell, dendritic cell, malaria, MHC II presentation, Plasmodium berghei
Subject Categories: Immunology; Microbiology, Virology & Host Pathogen Interaction
Introduction
Malaria is caused by parasites of the Plasmodium genus. This disease continues to threaten nearly half of the world's population and to kill more than 400,000 people yearly. Malaria infection leads to a broad spectrum of diseases with varying severity. While some asymptomatic parasite carriers show no clinical signs, individuals with uncomplicated malaria present mild symptoms, like fever and/or myalgia, and severe malaria patients face deadly manifestations, such as anemia or cerebral malaria. The diversity of human malaria pathophysiology can be recapitulated in part using different combinations of mouse backgrounds and rodent‐adapted Plasmodium species. Altogether, rodent studies have revealed the complex and dual roles of T cells, which seem to be involved both in protection and in pathogenesis (Freitas do Rosario & Langhorne, 2012; Howland et al, 2015a).
CD8 T cells are essential to contain parasite development during the initial liver stages (Frevert & Krzych, 2015; Radtke et al, 2015b). During blood stage, when parasites reside exclusively within erythrocytes, CD8 T cells may target MHC I‐positive parasitized erythroblasts (Imai et al, 2013) and be involved in parasite clearance (Safeukui et al, 2015). Besides these protective functions, CD8 T cells play a well‐established deleterious role in the vascular pathology associated with experimental cerebral malaria (ECM). A hallmark of ECM is the cross‐presentation of parasite antigens by endothelial cells of cerebral microcapillaries to CD8 T cells (Howland et al, 2015b; Swanson et al, 2016). Combined to a restriction in venous blood efflux due to cell sequestration (Nacer et al, 2014), the CD8‐mediated processes are considered pivotal in the vascular breakdown and fatal condition.
Being major producers of inflammatory and regulatory cytokines, CD4 T cells are critical fine‐tuners of the balance between protection and pathology. On the one hand, CD4 T cells contribute to parasite control. Effector memory Th1 CD4 T cells confer partial protection in the self‐resolutive Plasmodium chabaudi chabaudi (Pcc) model (Stephens & Langhorne, 2010), and loss of T‐bet, a master regulator of Th1 differentiation, impairs control of parasitemia in the Plasmodium berghei ANKA (PbA) model (Oakley et al, 2013). Moreover, a subset of CD4 T cells, called T follicular helper (TFH) cells, releases the B‐cell‐helping IL‐21 cytokine (Perez‐Mazliah et al, 2015) and is key to promote effective germinal center formation and anti‐parasite humoral immunity (Sebina et al, 2016; Zander et al, 2016).
On the other hand, CD4 T cells also contribute to malaria‐associated pathology. By secreting IFNγ in the first days of infection (Belnoue et al, 2002; Villegas‐Mendez et al, 2012), CD4 T cells promote CXCL9‐ and CXCL10‐dependent CXCR3‐mediated accumulation of CD8 T cells in the brain (Campanella et al, 2008; Van den Steen et al, 2008). Accordingly, T‐bet‐deficient (Oakley et al, 2013) and IL‐12Rbeta2‐deficient (Fauconnier et al, 2012) mice are less susceptible to ECM development. In addition, production of regulatory cytokines, such as IL‐10 (Couper et al, 2008; Freitas do Rosario et al, 2012; Villegas‐Mendez et al, 2016; Claser et al, 2017) and IL‐27 (Kimura et al, 2016), by CD4 T cells is instrumental for tilting the balance away from pathology. Yet despite the central role of CD4 T cells in regulating protective versus deleterious immunity during malaria, their cognate antigens, as well as the antigen‐presenting cells (APC) controlling their differentiation, are poorly characterized.
Chief among these APC are the dendritic cells (DC). DC concomitantly act as innate sensors of pathogen motifs, activators of innate immune cells, and initiators of the adaptive T‐cell‐mediated immunity. DC comprise two major branches: the plasmacytoid DC (pDC) and the conventional DC (cDC), which, based on ontogeny, can be further subdivided into cDC1 and cDC2 (Guilliams et al, 2014). Schematically, pDC are viewed as specialized to respond to viral infection by producing type I IFN, and cDC are considered as the most potent T‐cell‐activating cells (Durai & Murphy, 2016), even though depending on the context, tissue, or species analyzed, these functions may be completely or partially shared.
Early evidence suggested a functional dichotomy in antigen presentation among cDC, with cDC1 being best‐equipped for cross‐priming CD8 T cells and cDC2 preferentially activating CD4 T cells. This specialization was proposed after specifically targeting the same antigen to each subset (Dudziak et al, 2007). Since then, the specific requirement for cDC1 in cross‐priming CD8 T cells has been confirmed in viral (Hildner et al, 2008; Helft et al, 2012), bacterial (Yamazaki et al, 2013), and parasite (Mashayekhi et al, 2011; Piva et al, 2012; Lau et al, 2014; Radtke et al, 2015a) infections. Furthermore, cDC1 are instrumental to reactivate memory CD8 T cells in response to Listeria or virus assaults (Alexandre et al, 2016). With respect to CD4 T‐cell activation, the respective performances of cDC1 and cDC2 seem to vary according to the context and source of antigen. For yeast‐associated antigens, cDC2 perform better than cDC1 (Backer et al, 2008) while for cell‐associated antigens, cDC1 are more potent than cDC2 (Schnorrer et al, 2006). The bacterial antigen presentation capacity of cDC1 and cDC2 appears equivalent when incubated with fixed bacteria (Schnorrer et al, 2006). In vivo, some studies showed only a limited role for cDC1 in priming CD4 T cells against a soluble antigen (Yamazaki et al, 2013) or the West Nile Virus (Hildner et al, 2008). In agreement, cDC2 but not cDC1 are necessary for proper TFH differentiation after immunization with allogeneic red blood cell (RBC) (Calabro et al, 2016). In contrast, in other contexts such as during Leishmania major (Ashok et al, 2014; Martinez‐Lopez et al, 2015) and Toxoplasma gondii (Mashayekhi et al, 2011) parasite infections, cDC1 are critical to drive Th1 responses. Of note, it has been shown in the course of a viral infection that by interacting with pre‐activated CD4 T cells, cDC1 constitute a platform for delivery of CD4 T cell help to CD8 T cells (Eickhoff et al, 2015; Hor et al, 2015).
In malaria, the respective contributions of DC subsets in controlling CD4 T‐cell activation are ill‐defined. In the self‐resolutive Pcc model, cDC2 are more potent than cDC1 for MHC II presentation of two MSP1 epitopes until day 11 post‐infection, but for reasons that were not elucidated, the trend is reversed a few days later (Sponaas et al, 2006). In this model, a more recent study identified a role for inflammatory monocytes in promoting Th1 responses (Lonnberg et al, 2017). During PbA infection, MHC II presentation by splenic cDC1 at day 3 was found to be more efficient compared to cDC2 in one study (Lundie et al, 2010) but roughly similar to cDC2 in another (Lundie et al, 2008). Importantly, this was evaluated in BALB/c mice, which are more resistant to neuroinflammation than C57BL/6 (B6) mice (Hafalla et al, 2012), and with a model antigen. In conclusion, the implication of DC subsets in controlling endogenous CD4 T‐cell responses during severe malaria remains unsettled.
Here, we profiled the MHC II immunopeptidome presented by DC to CD4 T cells during Pb infection and we engineered reporter CD4 T‐cell hybridomas specific for the most prominent ETRAMP10.2 epitope. We report that in naïve and malaria‐infected mice, cDC1 are more potent than cDC2 for presenting Plasmodium antigens and that selective in vivo ablation of cDC1 blunts the development of parasite‐specific Th1 responses.
Results
Profiling the Plasmodium berghei‐derived MHC II immunopeptidome
Characterizing MHC II ligands and creating parasite‐specific reporter T cells are critical steps to understand the modalities of antigen presentation and CD4 T‐cell polarization during blood‐stage malaria.
We used mass spectrometry to globally characterize Pb antigenic peptides presented by MHC II on the surface of DC (Fig 1A). We immunoprecipitated the MHC II molecules from a splenic DC tumor cell line called MutuDC (Fuertes Marraco et al, 2012), incubated with Pb‐parasitized RBC (pRBC). Peptide‐loaded MHC II are trimers of I‐Abα chain, I‐Abβ chain, and antigenic peptide, which, depending on the affinity of the loaded peptide, can remain stable in SDS without prior boiling (Natarajan et al, 1999). To ensure that our protocol allowed the pull‐down of peptide‐MHC II trimers and not just of single I‐Abβ chain, we compared the migration of eluates with and without prior boiling, confirming that the immunoprecipitated material was SDS‐stable (Fig 1B). Although genetically very close to PbA (Otto et al, 2014), several variants of Pb causing different pathophysiological outcomes have been described (de Souza et al, 2010). Pb K173 (PbK) being the most “distant” from PbA (although SNPs were found only in 469 of > 15,000 genes; Otto et al, 2014), we decided to perform this analysis both with PbA and PbK pRBC. This led to the identification of a total of 372 unique I‐Ab‐eluted peptides, comprising 330 mouse sequences and 42 Pb sequences (Fig 1C, Dataset EV1), derived from 13 putative Pb antigenic proteins (Dataset EV2). In line with the modest level of polymorphisms between PbA and PbK, none of those source antigens was polymorphic. Remarkably, for seven antigens, we recovered multiple peptides containing a core of 11–16 amino acids (aa) and various N‐ or C‐terminal extensions (Dataset EV2). This feature is a typical property of MHC II ligands (Bozzacco et al, 2011; Sofron et al, 2016). For each set of nested peptides, we further analyzed the longest spanning sequence comprising all recovered sequences, for example, NALYNYSIPRPNVTSNL for ETRAMP10.2 (PBANKA_0517000) or LHASPYVAPAAAIIEMAE for LDH (PBANKA_1340100), resulting in a consolidated list of 14 peptides (Table 1). We evaluated the I‐Ab binding affinity of these 14 peptides by quantifying their ability to inhibit binding of a high‐affinity radiolabeled peptide (Sidney et al, 2013). Ten peptides were found to be good I‐Ab binders (IC50 < 1,000 nM), three moderate binders (IC50 < 5,000 nM), and one low binder (IC50 > 5,000 nM; Table 1).
Figure 1. MS/MS profiling of Pb‐derived MHC II immunopeptidome during blood‐stage malaria.

- Experimental protocol used to immunoprecipitate MHC II molecules from PbK or PbA pRBC‐loaded MutuDC and to elute MHC II‐bound peptides before proteomic analysis.
- Western blot revealed with anti‐I‐Abβ JV2 antibody. WCL: whole‐cell lysate of MutuDC + pRBC; S0: supernatant following incubation with protein‐G beads; S1: 1st wash of protein‐G beads; IP MHC II: eluates from Y‐3P‐immunoprecipitated MHC II, boiled or not. Representative of two independent experiments.
- Venn diagram of unique peptides from P. berghei (left) and Mus musculus (right) identified in the experiments performed with PbK pRBC (blue) and PbA pRBC (orange).
Table 1.
List of synthetic peptides tested in this study and their binding affinity to I‐Ab
| Gene ID | Gene description | Synthetic spanning peptide | Location in the protein | Short peptide name | I‐Ab binding IC50 (nM) |
|---|---|---|---|---|---|
| PBANKA_0915000 | Apical membrane antigen 1 precursor | INDRNFIATTALSSTEE | 365–381 | AMA1 | 818 |
| PBANKA_0621900 | Mitochondrial import inner membrane translocase subunit TIM14 | GGSTYIAAKVNEAKD | 96–110 | TIM14 | 302 |
| PBANKA_1214300 | Enolase | TTLGIFRAAVPSGASTG | 28–44 | ENO | 115 |
| PBANKA_1326400 | Glyceraldehyde 3‐phosphate dehydrogenase | GINHEKYNSSQTIVSNAS | 135–152 | GAPDH.1 | 2,420 |
| PBANKA_1145900 | Membrane‐associated histidine‐rich protein 1b | TEVPSLVPPTTNTSHAAPAH | 249–268 | MAHRP | 872 |
| PBANKA_1133300 | Elongation factor 1‐alpha | SGKVVEENPKAIKSGDS | 369–385 | EF1a | 2,701 |
| PBANKA_1410300 | m1‐family aminopeptidase | LSEVVIHPETNYALTG | 266–281 | M1 | 15,941 |
| PBANKA_0831000 | Merozoite surface protein‐1 | APSEQTTTPEAATAASN | 984–1,000 | MSP1 | 1,346 |
| PBANKA_1340100 | L‐lactate dehydrogenase | LHASPYVAPAAAIIEMAE | 231–248 | LDH | 110 |
| PBANKA_0517000 | Early transcribed membrane protein (ETRAMP10.2) | NALYNYSIPRPNVTSNL | 272–288 | ETRAMP | 87 |
| PBANKA_1450300 | ATP Synthase subunit beta mitochondrial | DNEYDFSGKAALVYGQ | 261–277 | ATPSYN | 104 |
| PBANKA_0505600 | Endomembrane prot 70 | KILYNSAKPNSDLH | 172–185 | END70 | 478 |
| PBANKA_0702800 | Protein disulfide isomerase | LIPEYNEAAIMLSEKK | 65–80 | PDI | 166 |
| PBANKA_1326400 | Glyceraldehyde‐3‐phosphate dehydrogenase | LMTTVHASTANQLVV | 175–189 | GAPDH.2 | 980 |
In the last column, IC50 values lower than 1,000 nM (corresponding to good I‐Ab binders) are shown in bold.
In summary, our analysis of the I‐Ab immunopeptidome in DC identifies a panel of 14 MHC II ligands derived from 13 non‐polymorphic antigenic proteins expressed by PbA and PbK.
In vivo relevance of the peptide panel during blood‐stage malaria
In order to validate this panel in vivo, we measured the frequency of CD4 T cells responding to each peptide during PbA pRBC infection (Fig 2A). Splenic T cells were restimulated with DC loaded with an irrelevant peptide (OVA) or uninfected RBC as negative controls, and with PbA pRBC as positive control. The latter condition allowed estimating the abundance of total parasite‐specific CD4 T cells in the spleen, regardless of their peptide specificity. We chose a 10:1 ratio of pRBC to DC (Fig EV1A), and we focused on day 6 post‐infection (corresponding to ECM onset) since the parasite‐specific CD4 T‐cell response was maximal at this time point and the mice succumbed beyond this day (Fig EV1B and C). In accordance with earlier studies (Villegas‐Mendez et al, 2012), we observed a substantial “spontaneous” release of IFNγ by activated CD4 T cells (CD4+ CD11a+ CD49d+) regardless of ex vivo re‐exposure to antigen (Fig 2B). In order to improve the specificity of detection of genuine parasite‐specific CD4 T cells, we focused on double IFNγ/TNF‐producing cells. Thirteen of 14 peptides elicited a higher IFNγ/TNF production than the OVA peptide, with eight showing statistical significance. The three most dominant peptides originated from ETRAMP10.2 (NALYNYSIPRPNVTSNL, NL17), GAPDH (GINHEKYNSSQTIVSNAS, GS18), and EF1α (SGKVVEENPKAIKSGDS, SS17) proteins (Fig 2C). In total, CD4 T cells specific for those three peptides comprised more than one‐third of the entire PbA‐specific response (Fig 2D). In line with the inability of PbK pRBC to induce ECM at a 106 pRBC inoculum (data not shown), the proportion of IFNγ/TNF‐producing CD4 T cells in PbK‐infected mice was lower. Yet the three most dominant responses were conserved overall (Fig EV2A). This peptide panel was also relevant in two other malaria models, in which protection strongly relies on humoral responses. In the self‐resolutive Pcc model, six of 10 peptides tested elicited IFNγ/TNF‐producing CD4 responses at day 6 post‐infection (Fig EV2B). Note that the identified ETRAMP and MSP1 peptides are not expressed by Pcc due to sequence polymorphisms, hence the absence of reactivity. Another model of interest is the genetically attenuated parasite (GAP) P. berghei NK65 which lacks the histamine‐releasing factor (Pb NK65 ΔHRF). This vaccine strain, in which the sequences of all identified peptides are conserved (Otto et al, 2014), causes self‐resolving blood‐stage infection and results in long‐lasting cross‐stage and cross‐species immunity (Demarta‐Gatsi et al, 2016). Three weeks post‐challenge with Pb NK65 ΔHRF, we could detect CD4 T cells reactive against 11 of the identified peptides (Fig EV2C).
Figure 2. Immunodominance of PbA‐derived MHC II peptides during blood‐stage malaria induced after pRBC infection.

- Experimental scheme to analyze splenic CD4 T‐cell responses at day 6 following inoculation of PbA pRBC.
- Gating strategy to calculate the proportion of CD11a+ CD49d+‐activated CD4 T cells that produce IFNγ and TNF in response to MutuDC loaded with RBC, PbA pRBC, OVA peptide (IR17), or ETRAMP10.2 peptide (NL17).
- Percentage of IFNγ/TNF‐double‐producing cells among activated CD4 T cells for each peptide. Basal level with MutuDC alone was subtracted.
- Hierarchy of immunodominance, depicted as the percentage of each peptide‐specific response with respect to the total parasite‐specific response obtained with PbA pRBC‐loaded MutuDC.
Figure EV1. PbA‐specific CD4 T‐cell responses are maximal at day 6 post‐pRBC infection.

- Proportion of CD11a+ CD49d+ CD4 T cells (mean ± SEM) that produce IFNγ and TNF in response to MutuDC loaded with increasing ratio of PbA pRBC, analyzed at day 6 post‐infection with PbA pRBC. N = 3 mice.
- Proportion of CD11a+ CD49d+ CD4 T cells (mean ± SEM) that produce IFNγ and TNF in response to MutuDC loaded with PbA pRBC (ratio 10:1, black bars) or uninfected RBC (white bars), after infection with PbA pRBC. N = 4 mice per group. Asterisks show significant differences. Day 4, P = 0.024; Day 5, *P = 0.003; Day 6, *P = 2.5 × 10⁻⁵ by multiple unpaired t‐tests without assuming consistent SD.
- Blood parasitemia (mean ± SEM) during infection with PbA pRBC (black circles, N = 5 mice) or PbA.GFP spz (gray squares, N = 15 mice). Asterisks show significant differences between the two groups. Day 4, P = 0.14; Day 6, *P = 0.011; Day 7, *P = 0.0007 by multiple unpaired t‐tests without assuming consistent SD.
Figure EV2. Peptide‐specific CD4 responses after challenge with PbK, Pcc, or Pb NK65 ΔHRF .

- IFNγ/TNF‐double‐producing cells among activated CD4 T cells at day 6 post‐infection with PbK (mean ± SEM). N = 6 mice. Basal level with MutuDC alone was subtracted. Asterisks show statistical significance assessed by paired nonparametric Wilcoxon tests in comparison with OVA peptide. GAPDH.1, *P = 0.031; PbK pRBC, *P = 0.031. Responses to ATPSYN, END70, PDI, and GAPDH.2 were not determined (nd). Experiments performed once.
- IFNγ/TNF‐double‐producing cells among activated CD4 T cells at day 6 post‐infection with Pcc (mean ± SEM). N = 4 mice. Basal level with MutuDC alone was subtracted. Responses to ATPSYN, END70, PDI, and GAPDH.2 were not determined (nd). Experiments performed once.
- IFNγ/TNF‐double‐producing cells among CD4 T cells at day 21 post‐challenge with genetically attenuated Pb NK65 ΔHRF (mean ± SEM). N = 4 mice. Basal level with MutuDC alone was subtracted. Dotted line indicates the response to OVA peptide. Experiments performed once.
While injection of pRBC is a widely used model to induce blood‐stage malaria, natural infection normally starts with the inoculation of mosquito‐derived sporozoites (spz) followed by pre‐erythrocytic stages. To investigate the relevance of the peptide panel in blood‐stage responses developing after pre‐erythrocytic stages, we infected mice with PbA spz. Since liver stages last ~48 h in rodents, we analyzed the CD4 responses at day 8 pi (Fig 3A), which is also the time of ECM onset in this model (Fig EV1C). We first noticed that the amplitude of the total parasite‐specific CD4 response (as indicated by the pRBC‐loaded DC condition, Fig 3B) was ~fourfold lower than at day 6 post‐infection with pRBC (see Fig 2C). Furthermore, the immunodominance hierarchy slightly differed and this time, the immunodominant response was targeted to the GS18 peptide from GAPDH (Fig 3B), which was the 2nd dominant peptide after pRBC challenge. Immunodominance can be driven by different parameters, but antigen abundance usually plays a major role. Given that RNA‐seq analysis at blood stage showed a similar and relatively high mRNA expression for ETRAMP10.2, GAPDH, and EF1α (>4,000 RPKM summed on all blood stages; Otto et al, 2014), we assumed that the different immunodominance profile may be caused by an earlier onset of GAPDH and EF1α expression during pre‐erythrocytic stages. We also hypothesized that the ETRAMP‐specific response might inflate later during blood stage developing after spz infection. To test this possibility, we treated spz‐infected mice at days 6 and 7 with chloroquine (CQ) in order to prevent ECM mortality but without totally blunting blood‐stage development (Fig 3A and C). We could then analyze the CD4 responses at day 14 pi, when parasitemia had reached a similar level as day 8 without CQ (Fig 3C). In these conditions, the ETRAMP peptide was immunodominant (Fig 3D).
Figure 3. Immunodominance of PbA‐derived MHC II peptides during blood‐stage malaria induced after spz infection.

- Experimental protocol used to analyze the ex vivo T‐cell responses in the spleen at day 8 and 14 following spz inoculation, with or without chloroquine (CQ) treatment as indicated.
- IFNγ/TNF‐double‐producing cells among activated CD4 T cells, after subtracting the basal level with MutuDC alone (mean ± SEM). Asterisks show statistical significance assessed by paired nonparametric Wilcoxon tests in comparison with OVA peptide. AMA1, *P = 0.027; TIM14, P = 0.84; ENO, P = 0.84; GAPDH.1, *P = 0.002; MAHRP, P = 0.71; EF1α, *P = 0.001; M1, *P = 0.032; MSP1, P = 0.23; *LDH, P = 0.016; ETRAMP, P = 0.064; ATPSYN, P = 0.77; END70, P = 0.097; PDI, *P = 0.0052; GAPDH.2, P = 0.19; pRBC, *P = 0.001. N = 15 mice pooled from three replicates.
- Blood parasitemia (mean ± SEM) monitored by flow cytometry after inoculation of 5 × 10⁴ PbA.GFP spz in B6 mice, treated (open squares) or not (black squares) with CQ at day 6 and 7 pi, in order to avoid ECM without blunting infection. Day 6, P = 0.29; Day 7, *P = 0.0013 by multiple unpaired t‐tests.
- IFNγ/TNF‐double‐producing cells among activated CD4 T cells, at day 14 pi following CQ treatment (mean ± SEM). Basal level with MutuDC alone was subtracted. GAPDH.1, P = 0.99; EF1α, P = 0.062; ETRAMP, *P = 0.031; pRBC, *P = 0.031 by paired nonparametric Wilcoxon tests in comparison with OVA peptide.
In summary, our results indicate (i) that CD4 immunodominance hierarchy during blood stage is dictated in part by the route of challenge and by the duration of blood‐stage infection and (ii) that ETRAMP ultimately establishes as a prominent blood‐stage peptide after both spz and pRBC infections.
cDC1 are superior to cDC2 for I‐Ab presentation of malaria antigens
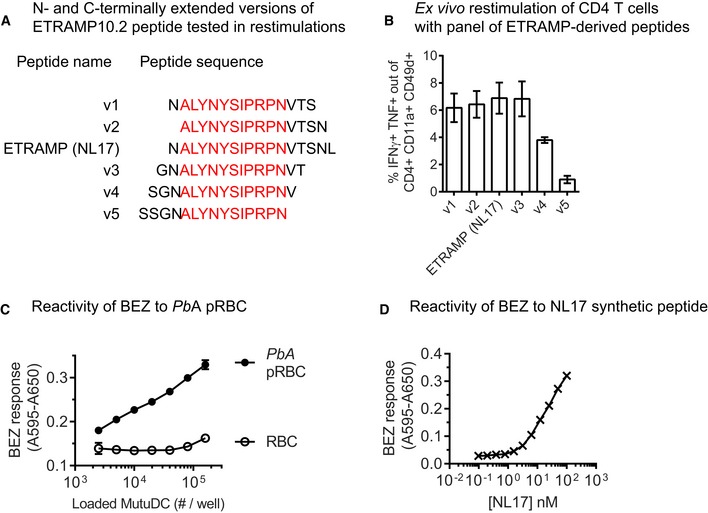
Next, we wanted to address which APC subset(s) control the generation of parasite‐specific CD4 T cells by presenting malaria antigens on MHC II. We set out to generate reporter CD4 T‐cell hybridomas recognizing the dominant ETRAMP10.2 peptide, but as mentioned, MHC II ligands can be diverse in size (12–25 aa) and contain various N‐ and C‐terminal extensions. To choose the optimal ETRAMP‐derived peptide for raising the hybridomas, we assessed the ability of CD4 T cells from PbA‐infected mice to recognize N‐ and C‐terminally extended versions of the NL17 peptide (Fig EV3A). As NL17 was among the most stimulatory peptides (Fig EV3B), we proceeded to generate NL17‐specific T‐cell hybridomas, that we named B6‐derived CD4 T‐cell hybrids reactive to ETRAMP and producing LacZ (BEZ). We confirmed that BEZ hybridomas reacted to PbA pRBC‐ but not to uninfected RBC‐loaded DC (Fig EV3C), and we observed that BEZ detected down to 2 nM of NL17 synthetic peptide (Fig EV3D).
Figure EV3. ETRAMP10.2 NL17 peptide is optimal for restimulating CD4 T cells from PbA‐infected mice and is stimulatory to BEZ hybridomas.
-
AN‐ and C‐terminally extended versions of the ETRAMP10.2 peptide used to restimulate CD4 T cells from infected mice ex vivo.
-
BIFNγ/TNF‐double‐producing cells among activated CD4 T cells (mean ± SEM) responding to MutuDC pulsed with the indicated peptide variants, evaluated at day 6 post‐infection with PbA pRBC. N = 3 mice.
-
C,DResponsiveness of BEZ hybridomas: B6‐derived hybrids reactive to ETRAMP10.2 peptide and producing LacZ. β‐galactosidase production by BEZ after stimulation with MutuDC loaded with RBC or PbA pRBC (C) or with MutuDC incubated with serially diluted ETRAMP10.2 NL17 peptide (D). Representative of two replicates.
To define the APC subset(s) presenting the ETRAMP10.2 peptide, we FACS‐sorted three splenic DC subsets (cDC1, cDC2, pDC) and a 4th mixed population containing macrophages and monocyte‐derived DC (moDC) from day 6‐infected mice (Fig 4A) and used them in a BEZ antigen presentation assay. cDC1 were the most potent APC and were as stimulatory as PbA pRBC‐loaded MutuDC (Fig 4B). cDC2 were able to present the ETRAMP peptide albeit at much lower levels. We could not detect any presentation by pDC or by the macrophage/moDC mixed population (Fig 4B). The lower performance of cDC2 cannot be explained by impaired I‐Ab expression since I‐Ab was slightly more abundant on cDC2 in day 6‐infected mice (Fig 4C). Furthermore, when cDC1 and cDC2 were exogenously loaded with AS15, an I‐Ab peptide from T. gondii (Grover et al, 2012), there was no difference in hybridoma stimulation at high peptide concentration (Fig 4D). The difference between cDC1 and cDC2 in Fig 4B is likely due to other factors, potentially including a different phagocytosis capacity and/or a different processing efficiency. Following incubation with heat‐killed T. gondii (Fig 4E) and OVA‐expressing E. coli bacteria (Fig 4F), cDC1 were indeed more potent for processing and presenting these exogenous antigens on MHC II. To evaluate the phagocytosis potential of these two DC subsets, we infected mice with PbA.GFP and measured the proportion of GFP+ cells among cDC1. This proportion was about twice as high as that among cDC2, suggesting that cDC1 possess a better pRBC uptake capacity in vivo (Fig 4G). To analyze whether the selective cDC1 superiority was specifically related to severe malaria, we isolated cDC1 and cDC2 from naïve mice and exposed them to PbA pRBC (Fig 4H) and to OVA‐expressing E. coli (Fig 4I). In both contexts, cDC1 performed better than cDC2, and again, this was not due to a reduced MHC II surface expression (Fig 4J).
Figure 4. cDC1 are superior to other spleen antigen‐presenting cells for MHC II presentation of PbA and non‐PbA antigens.

-
AGating strategy for FACS‐sorting pDC (Lin− CD11clo B220+ Ly6C+), cDC1 (Lin− CD11c+ CD8α+), cDC2 (Lin− CD11c+ CD8α−), and a mix of macrophages and moDC (Lin− CD11c− CD11b+ Ly6C+) from spleens of mice infected for 6 days with PbA pRBC.
-
BI‐Ab presentation of ETRAMP10.2 peptide by the indicated APC, measured with BEZ hybridomas. PbA pRBC‐loaded MutuDC were used as controls. Representative of two experiments with four infected mice pooled per replicate.
-
CFold‐change surface expression of I‐Ab in cDC2 over cDC1 in day 6‐infected mice (mean ± SEM of five experiments). Difference is not significant based on unpaired t‐test with Welch's correction.
-
D–FI‐Ab presentation of non‐PbA antigens by cDC isolated from day 6 PbA‐infected mice. (D) I‐Ab‐AS15 presentation after exogenous addition of AS15 peptide at the indicated concentrations, assessed with the BTg01Z hybridomas. (E) I‐Ab‐AS15 presentation by DC incubated with heat‐killed T. gondii at the indicated ratio, assessed with the BTg01Z hybridomas. (F) I‐Ab‐IR17 presentation by DC incubated with OVA‐expressing E. coli at the indicated ratio, assessed with the OTIIZ hybridomas. PbA pRBC‐loaded MutuDC were used as controls. Representative of two experiments with four infected mice pooled per replicate. Dotted line shows the basal response of the hybridomas in the absence of antigen.
-
GIn vivo pRBC uptake by cDC1 (XCR1+ CD172a−) and cDC2 (XCR1− CD172a+) analyzed at 6 days post‐infection with PbA.GFP. Gates were positioned based on the auto‐fluorescence of the cDC subset in day 6 PbA‐infected mice. As GFP+ events are rare, 107 events were acquired for each mouse. Symbols show the mean percentage ± SEM (N = 4 mice per group) of GFP+ cells in each DC subset. *P = 0.0005 by unpaired t‐test without assuming consistent SD.
-
H, II‐Ab presentation by cDC isolated from naïve mice. (H) I‐Ab‐NL17 presentation by DC incubated with PbA pRBC at a ratio of 5:1, assessed with the BEZ hybridomas. (I) I‐Ab‐IR17 presentation by DC incubated with OVA‐expressing E. coli at a ratio of 20:1, assessed with the OTIIZ hybridomas. Representative of two independent experiments with 20 naïve mice pooled per experiment. Dotted line shows the basal response of the hybridomas in the absence of antigen.
-
JFold‐change surface expression of I‐Ab in cDC2 over cDC1 in naïve mice (mean ± SEM of four experiments). Difference is not significant based on unpaired t‐test with Welch's correction.
Altogether, these data show that both in naïve mice and during severe PbA malaria, cDC2 are selectively impeded in MHC II processing and presentation of pRBC‐derived antigens as compared to cDC1, most likely leading to cDC1 playing prominent MHC II‐related functions in vivo.
cDC1 regulate CD4 T‐cell functionality during severe malaria
To decipher the in vivo implication of cDC1 in activating CD4 T cells, we took advantage of Karma mice that allow conditional depletion of cDC1 upon injection of DT (Alexandre et al, 2016). We first verified that DT treatment had no adverse effect on the development of parasitemia and on parasite‐specific Th1 responses (data not shown). We started the DT treatment prior to infection and maintained the depletion throughout blood‐stage development using repeated DT injections (Fig 5A). At day 6 pi, a clear reduction in CD8α+ DC was observed (Fig 5B and C) even though it appeared less pronounced than what is achieved at steady state (Alexandre et al, 2016). Regardless of the cause for this partial depletion (e.g. influence of infection on cDC1 survival and/or differentiation), we confirmed a previous study reporting that cDC1 promote the development of PbA‐specific CD8 responses (Piva et al, 2012). The numbers of CD8 T cells responding to PbA pRBC‐loaded MutuDC, as well as to the F4 (Lau et al, 2011) and GAP50 (Howland et al, 2013) MHC I epitopes, were indeed substantially lower in DT‐treated Karma mice (Fig EV4A). Most remarkably, cDC1 ablation resulted in dramatically impaired proportions (Fig 5D and E) and numbers (Fig 5F) of CD4 T cells co‐producing IFNγ and TNF in response to PbA pRBC‐loaded or peptide‐pulsed MutuDC. The same was true at day 4 post‐infection (Fig EV4B) indicating that cDC1 are not only important for maintenance of IFNγ+ TNF+ Th1 cells but also for their priming. The effect of cDC1 depletion on the development of Th1 CD4 responses was not the mere consequence of altered parasite growth as blood parasitemia was comparable with and without DT treatment (Fig 5G). The reduced differentiation into IFNγ+ TNF+ CD4 T cells was also accompanied by further changes in the functionality of parasite‐specific CD4 T cells. Multifunctional analysis of IFNγ, TNF, IL‐10 single, double, and triple producers performed on CD4 T cells responding to pRBC‐loaded MutuDC (Fig 5H) showed an increased proportion of single IL‐10+ CD4 T cells in DT‐treated mice (Fig 5I). Restimulation with the three most dominant peptides also led to higher proportions of IL‐10+ Tr1 cells in DT‐treated mice (Fig 5J).
Figure 5. cDC1 are required for the development of parasite‐specific IFNγ+ TNF + Th1 responses during PbA blood‐stage malaria.

- Experimental protocol to analyze T‐cell responses in Karma mice at day 6 post‐infection with PbA pRBC. Mice were injected with DT prior to infection and repeatedly every 60 h thereafter.
- Gating strategy to assess efficiency of cDC1 depletion.
- Percentage (mean ± SEM) of CD8α+ out of Lin− B220− CD11c+ MHC IIhi cells. *P = 0.0043 by Mann–Whitney test. No DT group, N = 5 mice; + DT group, N = 6 mice. Representative of three independent experiments.
- FACS plots showing the proportion of CD11a+ CD49d+ CD4 T cells that produce IFNγ and TNF in response to MutuDC loaded with RBC, PbA pRBC, or ETRAMP10.2 peptide.
- Proportion of CD11a+ CD49d+ CD4 T cells that co‐produce IFNγ and TNF (mean ± SEM) in response to MutuDC loaded with the indicated antigen, isolated from Karma mice treated (open circles) or not (black circles) with DT. Asterisks show significant differences between no DT and + DT group by multiple unpaired t‐tests without assuming consistent SD. RBC, P = 0.18; GAPDH.1, *P = 0.019; EF1a, *P = 0.039; ETRAMP, *P = 0.00054; OVA, P = 0.25; pRBC, *P = 0.015. No DT group, N = 5 mice; + DT group, N = 6 mice. Representative of three independent experiments.
- Absolute numbers of IFNγ+ TNF+ CD11a+ CD49d+ CD4+ T cells responding to the indicated stimuli (mean ± SEM). GAPDH.1, *P = 0.0047; EF1a, *P = 0.00039; ETRAMP, *P = 0.00022; pRBC, *P = 0.00019 by multiple unpaired t‐tests without assuming consistent SD. No DT group, N = 5 mice; + DT group, N = 6 mice. Representative of three independent experiments.
- Blood parasitemia (mean ± SEM) at day 4 and 6 pi in Karma mice treated (open circles) or not (black circles) with DT. Day 4, *P = 0.022; Day 6, P = 0.77 by multiple unpaired t‐tests without assuming consistent SD. No DT group, N = 5 mice; + DT group, N = 6 mice. Representative of three independent experiments.
- Absolute numbers of CD4+ T cells producing IFNγ, TNF, or IL‐10, either individually or in combination, following restimulation with MutuDC+PbA pRBC (mean ± SEM). These cells are called cytokine+ in the next panels. *P = 0.0023 by unpaired t‐test without assuming consistent SD. N = 3 mice per group.
- Multifunctionality analysis (IFNγ, TNF, IL‐10) of cytokine+ T cells responding to MutuDC loaded with PbA pRBC. N = 3 mice per group.
- Proportion of IL‐10+ IFNγ− TNF− among cytokine+ T cells, in response to MutuDC loaded with the indicated antigen (mean ± SEM). GAPDH.1, P = 0.32; EF1a, P = 0.16; ETRAMP, **P = 8.5 × 10⁻⁵; OVA, P = 0.11; **pRBC, P = 0.0015 by multiple unpaired t‐tests without assuming consistent SD. N = 3 mice per group.
Figure EV4. cDC1 are required for the generation of parasite‐specific CD8 T cells and the priming of CD4 Th1 cells during PbA blood‐stage malaria.

- Absolute numbers of IFNγ+ TNF+ CD11a+ CD49d+ CD8+ responding to MutuDC loaded with the indicated antigens, from Karma mice treated (open circles) or not (black circles) with DT, analyzed at day 6 post‐infection (mean ± SEM). “No DT” group: N = 5 mice, “+ DT” group: N = 6 mice. GAP50, P = 0.10; F4, P = 0.14; pRBC, *P = 6.45 × 10⁻⁶ by multiple unpaired t‐tests without assuming consistent SD.
- Proportion of CD11a+ CD49d+ CD4 T cells that co‐produce IFNγ and TNF in response to MutuDC loaded with the indicated antigens, from Karma mice treated (open circles) or not (black circles) with DT, analyzed at day 4 post‐infection (mean ± SEM). “No DT” group: N = 3 mice, “+ DT” group: N = 4 mice. Asterisks show significant differences by multiple unpaired t‐tests without assuming consistent SD. RBC, *P = 0.033; GAPDH.1, P = 0.36; EF1a, P = 0.14; ETRAMP, *P = 0.01; OVA, P = 0.18; pRBC, *P = 0.017.
In conclusion, our data demonstrate that in the context of severe blood‐stage malaria, cDC1 promote the differentiation of parasite‐specific IFNγ+ TNF+ Th1 cells, to the expense of more regulatory IL‐10+ CD4 T cells.
Discussion
In malaria‐endemic areas, a nagging issue is the failure of naturally exposed individuals to develop sterile long‐lasting protective immunity. This may be due to several factors including the stage specificity of parasite antigen expression, the antigenic variability among field parasites, and the profound immune dysregulation caused by pre‐erythrocytic and erythrocytic stages (Renia & Goh, 2016; Scholzen & Sauerwein, 2016; Van Braeckel‐Budimir et al, 2016). These factors could also contribute to explain why despite tremendous investments and years of research, progress on the vaccination front has been only modest. Clinical efficacy of the most advanced subunit vaccine candidate against P. falciparum (RTS,S) is limited and quickly wanes over time (Olotu et al, 2016). Hopes are emerging from whole attenuated sporozoite vaccination strategies (Sissoko et al, 2017), but the disappointing RTS,S results combined with the fact that vaccine research on P. vivax is only beginning (Tham et al, 2017) suggest the need to broaden our search for new subunit vaccine candidates and to dramatically improve the candidate down‐selection process.
Mouse models of malaria are not faithful in every aspect to human malaria pathology, but they represent useful tools to establish proofs‐of‐concept, for example, related to immunomics approaches. Using P. berghei infection in B6 mice, our study shows a selective superiority of cDC1 in MHC II presentation of pRBC‐associated antigens at ECM onset, that is, day 6 post‐infection. DC functions are known to be impeded during blood‐stage malaria (Cockburn & Zavala, 2016), and one can imagine that malaria may more strongly impact cDC2. However, our finding that cDC1 from naïve mice also present pRBC‐derived antigens better than cDC2 suggests that this difference is not, or at least not solely, dictated by infection. Using a CD4 T‐cell hybridoma that recognizes a currently undefined Plasmodium epitope, a Biorxiv‐posted study (Fernandez‐Ruiz et al, 2017) reports that cDC1 are more stimulatory than CD4+ DC and double‐negative DC, both in naïve mice and at 3 days post‐infection. Although the sensitivity of our hybridomas did not allow us to evaluate the ETRAMP10.2 MHC II presentation at such an early time point (data not shown), our data are consistent with this work. What mechanism(s) could account for such a difference in MHC II presentation? One possibility is that cDC1 are equipped with a better pRBC uptake capability, which is supported by our evaluation of pRBC uptake in day 6‐infected mice. In line with this idea, the phagocytic potential of cDC2 is specifically suppressed by type I IFN signaling during PbA infection (Haque et al, 2014). Another non‐mutually exclusive hypothesis is a difference in the efficiency of the MHC II processing pathway. Phagolysosome maturation and/or hydrolase activity in MHC II processing compartments could be selectively enhanced in cDC1 and/or dysfunctional in cDC2. Alternatively, antioxidant pathways involving heme oxygenase‐1, which are known to affect antigen presentation by DC (Riquelme et al, 2015), may be differentially elicited in cDC1 vs cDC2. Dissecting how malaria antigens are processed differentially for MHC II presentation in DC subsets, and how severe malaria regulates this process, represents exciting avenues of future research.
A second substantial finding is that during severe malaria, cDC1 are critical for priming and promoting parasite‐specific Th1 CD4 T cells. This is consistent with the results of a study using a CD4 TCR‐transgenic mouse specific for a Plasmodium epitope (Fernandez‐Ruiz et al, 2017). More generally, these data are in line with the established propensity of cDC1 to secrete IL‐12 during infection by intracellular pathogens (Mashayekhi et al, 2011; Alexandre et al, 2016) and the implication of cDC1 in Th1 polarization during other parasitic infections such as leishmaniasis (Ashok et al, 2014; Martinez‐Lopez et al, 2015) and toxoplasmosis (Mashayekhi et al, 2011). Perhaps most importantly, we find that cDC1 depletion, possibly by “forcing” MHC II presentation by the remaining cDC2 subset, skews cytokine production of parasite‐specific CD4 T cells toward a more regulatory profile, associated with a higher proportion of single IL‐10‐producing CD4 T cells. This supports the emerging and prominent concept that functional polarization of CD4 Th cells is in part dictated by the subset(s) of cDC activating the CD4 T cells (Dutertre et al, 2014; Vu Manh et al, 2015). For instance, while IRF4 deficiency (resulting in impaired migration of cDC2) abrogates Th17 responses upon fungal challenge, Batf3 deficiency (resulting in lack of cDC1) skews CD4 responses toward Tregs and Th2, ultimately perturbing Leishmania parasite control (Ashok et al, 2014). In a non‐infectious context, a mouse model of type I diabetes, targeting of a pancreatic cell antigen to cDC2 favors tolerogenic properties by autoreactive CD4 T cells as compared to cDC1 targeting (Price et al, 2015). Given the major regulatory role of IL‐10 produced by CD4 Th cells during Pcc infection (Freitas do Rosario & Langhorne, 2012), one could speculate that the sustained antigen presentation by cDC2 in this setting (Sponaas et al, 2006) is involved in preventing immunopathology. In turn, one could hypothesize that addition of cDC2 or restoration of cDC2 MHC II presentation during PbA infection may mirror cDC1 depletion and enhance the differentiation of regulatory Tr1 cells, which could ultimately alleviate ECM immunopathology. Harnessing DC subsets for immunotherapy of rheumatoid diseases (Pozsgay et al, 2017) and autoimmune pathologies (Liu & Cao, 2015; Audiger et al, 2017) is already a major research area. Modulating cDC1 to curtail excessive Th1 responses in human severe malaria could represent a valuable translational approach.
So far at least eight MHC I epitopes were characterized in B6 mice infected with PbA (Lau et al, 2011, 2014; Howland et al, 2013; Poh et al, 2014), but no CD4 T‐cell epitope was known. By characterizing the MHC II immunopeptidome by MS/MS, our study identifies a panel of MHC II ligands able to restimulate CD4 T cells isolated from PbA‐infected mice. PbA infection is suited to evaluate the role of DC on T‐cell polarization and pathogenicity during cerebral malaria, but this acute model is not well adapted to study the effects of CD4‐dependent antibody responses on parasitemia. As previously reported (Piva et al, 2012), we observed no major effect of cDC1 depletion on parasite growth. Pcc and Pb NK65 ΔHRF are likely to be better models to evaluate the relevance of the identified peptides on parasitemia and antibody‐mediated protection. While our study does not analyze these aspects, we found that some peptides were recognized by CD4 T cells isolated from Pcc‐infected mice and mice immunized with the Pb NK65 ΔHRF GAP, thus setting the stage to assess (i) whether the conserved peptides will elicit protection after challenge with Pcc and (ii) whether the protective antibody responses generated by the Pb NK65 ΔHRF vaccine GAP target the same MHC II antigens. Among the unraveled antigen panel, two of them may be particularly relevant to further analyze: ETRAMP10.2 and GAPDH. ETRAMP10.2 belongs to a family of proteins present in mouse and human Plasmodium that is secreted and anchored at the parasitophorous vacuole membrane (Spielmann et al, 2003; Pasini et al, 2013). Interestingly, ETRAMP10.2 and other members (ETRAMP2, 4 and 10.1) are recognized by immunoglobulins from individuals living in a high‐endemicity malaria region of Papua New Guinea (Spielmann et al, 2003) and ETRAMP11.2 is recognized by sera from > 80% of P. vivax‐exposed individuals (Chen et al, 2015), showing that ETRAMPs are relevant B‐cell antigens in humans. GAPDH is primarily involved in glycolysis, but this enzyme also functions in processes ranging from DNA repair to membrane trafficking, iron transport, and cell signaling (Perez‐Casal & Potter, 2016). Akin to other housekeeping proteins, it had long been assumed that GAPDH was present exclusively in the cytoplasm, but accumulating evidence suggests that it is also present at the surface of pathogens such as Schistosoma mansoni helminths (Argiro et al, 2000) and Streptococcus bacteria, where it could modulate virulence (Jin et al, 2011). Interestingly, resistance to S. mansoni reinfection was found to correlate with serum reactivity toward a GAPDH epitope (Argiro et al, 2000). In this context, GAPDH has been proposed as a vaccine candidate in several infectious settings and animal models (Perez‐Casal & Potter, 2016). During malaria, GAPDH is expressed during asexual blood stage at the apical end of merozoites where it may be involved in membrane trafficking and vesicular transport (Daubenberger et al, 2003). Analysis of the surface‐exposed spz proteome (Swearingen et al, 2016) and immunofluorescence assays (Cha et al, 2016) revealed that GAPDH is expressed on the surface of P. falciparum and of P. berghei spz. Notably, surface GAPDH interacts with CD68 expressed on Kupffer cells and is involved in liver invasion (Cha et al, 2016). Furthermore, immunization of Swiss‐Webster mice with KLH‐coupled GAPDH conferred protection after spz challenge (Cha et al, 2016). Knowing that the GAPDH GS18 epitope is conserved in PbA, PbK173, PbNK65, Py17XNL, and Pcc, it seems relevant to further investigate the value of GAPDH as a multistage invasion‐blocking vaccine candidate in pre‐clinical mouse models. Our data also suggest analyzing whether natural antibody responses targeting Plasmodium GAPDH in humans are associated with a certain degree of immunity and/or clinical protection.
At last, our work provides a proof‐of‐concept supporting the relevance of profiling the HLA class II immunopeptidome for blood‐stage P. falciparum. The biological and mass spectrometry techniques to analyze immunopeptidomes are rapidly evolving (Caron et al, 2015) and methods to characterize HLA DR‐bound immunopeptidomes with relatively low numbers of cells have been optimized (Heyder et al, 2016), supporting the feasibility of this approach in human malaria. We expect this to lead to the identification of naturally processed epitopes recognized by CD4 T cells, including TFH, in infected humans. CD4 T cell help to CD8 T cells is needed to generate robust memory CD8 T cells (Janssen et al, 2005), and the ability to generate fully functional TFH is critical for maintenance of effective long‐term humoral immunity against malaria (Hansen et al, 2017). Thus, applying this approach in human malaria may both uncover new vaccine targets and help us down‐select vaccine candidates that are more likely to drive robust antibody responses through TFH restimulation and long‐lasting CD8 T‐cell memory differentiation through DC‐integrated CD4 help.
Materials and Methods
Ethics statement
Animal care and use protocols were carried out under the control of the National Veterinary Services and in accordance with the European regulations (EEC Council Directive, 2010/63/EU, September 2010). The protocol (CE no. 2015‐03) was approved by the local Ethical Committee for Animal Experimentation (registered by the “Comité National de Réflexion Ethique sur l'Expérimentation Animale” under no. CEEA122).
Mice, parasites, and experimental infections
C57BL/6J (B6) were purchased from Janvier (France), and Karma mice (a530099j19rik‐ tm1Ciphe; Alexandre et al, 2016) were imported from CIPHE, Marseille, France. All mice were males between 7 and 16 weeks old. They were housed under specific pathogen‐free conditions at UMS006‐CREFRE, Toulouse. Plasmodium berghei ANKA (PbA) and P. berghei Kyberg 173 (PbK) parasites were propagated in B6. To prepare pRBC stocks, mice were bled in heparin and the proportion of pRBC was evaluated by blood smear. pRBC concentration was adjusted to 107 pRBC/ml in Grau solution (Alsever's solution with 10% glycerin), and 1 ml aliquots were stored at −80°C. All pRBC infections were done by intravenous inoculation of 106 pRBC, unless otherwise indicated. Sporozoites were obtained from salivary glands of Anopheles stephensi mosquitoes infected with PbA expressing GFP under the HSP70 promoter, as described (Manzoni et al, 2014). In brief, A. stephensi mosquitoes were reared at 26°C and 80% humidity, and fed on 10% sucrose solution. Adult mosquitoes from 3 to 7 days were fed on anesthetized PbA‐infected mice and further kept at 21°C. Salivary glands of PbA‐infected mosquitoes were removed by hand dissection 21–28 days post‐feeding and crushed in Leibovitz's L‐15 medium to release sporozoites. Parasites were counted and kept at 4°C until use. Mice were infected i.v. with 5 × 10⁴ spz.
Parasitemia was measured by blood smear or flow cytometry with similar results. For flow cytometry, 3 μl of blood tail was collected using a microvette. With PbA.GFP, the percentage of pRBC was determined by gating on GFP+ out of total RBC on non‐fixed blood. With non‐fluorescent parasites, the blood was labeled with Ter119‐FITC (1/30, Miltenyi Biotec), CD71‐PE (C2, 1/300, BD Pharmingen) and CD41‐PE‐Cy7 (MWReg30, 1/100, Biolegend), fixed and permeabilized in 4% PFA and 0.6% saponin followed by DAPI staining. The percentage of pRBC was determined by gating on DAPI+ out of Ter119+ CD41− cells.
MutuDC loading, I‐Ab immunoprecipitation, and peptide elution
pRBC from freshly harvested blood were enriched using Percoll in order to obtain > 70% parasitemia. 108 MutuDC were incubated overnight with 109 PbA or PbK pRBC at 37°C. Loaded DC were lysed using CHAPS buffer during 45 min at 4°C, as previously described (Bozzacco & Yu, 2013). The lysate was cleared by centrifugation at 14,000 g for 15 min, and MHC II molecules were immunoprecipitated from the cleared lysate using 50 μg of Y‐3P antibody (BioXCell) bound to protein‐G beads overnight at 4°C. Beads were washed 3 times, and peptides were eluted with 10% acetic acid at 70°C for 10 min.
Western blot
Immunoprecipitation eluates were reduced in β‐mercaptoethanol and boiled or not in Laemmli buffer. Lysates corresponding to 7.5 × 10⁵ DC equivalents were separated by electrophoresis on 10% polyacrylamide gels and transferred to nitrocellulose membranes. Immunologic detection was achieved using primary rabbit anti‐mouse I‐Ab (JV2, 1/1,000) followed by horseradish peroxidase‐conjugated mouse anti‐rabbit antibodies (Promega). Detection of peroxidase activity was achieved using a ChemiDoc system (Bio‐Rad).
Nano‐LC‐MS/MS analysis
Prior to analysis, peptides were separated from protein using a Vivaspin concentrator with 10‐kDa MW cutoff. Peptides were subjected to solid‐phase extraction using a C18 Sep‐Pak cartridge and finally concentrated using a rotating evaporator. Nano‐LC‐MS/MS analysis was performed on an UltiMate 3000 RSLCnano System (Thermo Fisher Scientific) coupled to a Q‐Exactive mass spectrometer (Thermo Fisher Scientific). Peptides were automatically fractionated onto a C18 reverse‐phase column (75 μm × 150 mm, 2 μm particle, PepMap100 RSLC column, Thermo Fisher Scientific) at a temperature of 35°C. Trapping was performed during 4 min at 5 μl/min, with solvent A (98% H2O, 2% ACN and 0.1% FA). Elution was performed using two solvents A (0.1% FA in water) and B (0.1% FA in ACN) at a flow rate of 300 nl/min. Gradient separation was 36 min from 2% B to 40% B, 2 min to 90% B, and maintained for 5 min. The column was equilibrated for 13 min with 5% buffer B prior to the next sample analysis. The electrospray voltage was 1.9 kV, and the capillary temperature was 275°C. Full MS scans were acquired over m/z 400–2,000 range with resolution 70,000 (m/z 200). The target value was 106. Ten most intense peaks with charge state between 2 and 7 were fragmented in the HCD collision cell with normalized collision energy of 35%, and tandem mass spectrum was acquired with resolution 35,000 at m/z 200. The target value was 2 × 10⁵. The ion selection threshold was 6.7 × 10⁴ counts, and the maximum allowed ion accumulation times were 250 ms for full MS scans and 150 ms for tandem mass spectrum. Dynamic exclusion was set to 30 s.
Proteomic data analysis
Raw data collected during nano‐LC‐MS/MS analyses were processed and converted into *.mgf peak list format with Proteome Discoverer 1.4 (Thermo Fisher Scientific). MS/MS data were interpreted using search engine Mascot (version 2.4.1, Matrix Science, London, UK) installed on a local server. Searches were performed with a tolerance on mass measurement of 0.02 Da for precursor and 10 ppm for fragment ions, against a composite target decoy database (189,576 total entries) built with Plasmodium berghei UniProt database (TaxID = 5,823, December 3, 2015, 13,853 entries), Mus musculus UniProt database (TaxID = 10,090, December 3, 2015, 78,986 entries) fused with the sequences of recombinant trypsin and a list of classical contaminants (117 entries). Methionine oxidation and protein N‐terminal acetylation were searched as variable modifications, and no enzyme was indicated. For each sample, peptides were filtered out according to the cutoff set for proteins hits with 1 or more peptides taller than nine residues and ion score > 19, allowing a false‐positive identification rate of 2.5% for protein and 0.4% for peptides.
MHC purification and binding assays
Purification of I‐Ab MHC II molecules by affinity chromatography and the assay based on the inhibition of binding of a high‐affinity radiolabeled peptide to quantitatively measure peptide binding were described elsewhere (Sidney et al, 2013). Briefly, the mouse B‐cell lymphoma LB27.4 was used as a source of MHC molecules. A high‐affinity radiolabeled peptide (0.1–1 nM; peptide ROIV, sequence YAHAAHAAHAAHAAHAA) was co‐incubated at room temperature with purified MHC in the presence of a cocktail of protease inhibitors and an inhibitor peptide. Following a 2‐day incubation, MHC‐bound radioactivity was determined by capturing MHC/peptide complexes on mAb (Y3JP)‐coated Lumitrac 600 plates (Greiner Bio‐one), and measuring bound cpm using the TopCount (Packard Instrument Co) microscintillation counter. The concentration of peptide yielding 50% inhibition of the binding of the radiolabeled peptide was calculated. Under the conditions utilized, where [label] < [MHC] and IC50 ≥ [MHC], the measured IC50 values are reasonable approximations of the true Kd values. Each competitor peptide was tested at six different concentrations covering a 100,000‐fold range. The “cold” probe was used as a positive control in each experiment.
Generation of reporter CD4 T‐cell hybridomas
Mice were infected with PbA pRBC and treated with intraperitoneal injections of 0.4 mg of chloroquine (CQ) at days 3, 4, 5, and 6 pi. Spleens were harvested at day 7 pi, and 6 × 10⁶ splenocytes were seeded per well into a P24 in complete RPMI medium supplemented with 1 μM of ETRAMP NL17 peptide. After 2 days, 50 U/ml of recombinant human IL2 (rhIL2, BD Biosciences) was added. After 1 week, cells were separated by Ficoll and CD4 T cells were enriched using magnetic sorting (Miltenyi). CD4 T cells were tested for reactivity and put back in culture with 35 Gray‐irradiated MutuDC, 1 μM of NL17, 50 U/ml rhIL2, and 5% of T‐stim solution. Three days after, T‐cell cultures were subjected to Ficoll separation and fused with the TCRαβ‐negative lacZ‐inducible BWZ fusion partner, as previously described (Feliu et al, 2013). Hybridomas were selected and subcloned at least 3 times. The reactivity was tested by mixing 105 hybridomas with 5 × 10⁴ MutuDC or BMDC, previously loaded with varying ratios of pRBC or RBC extracts overnight, or incubated with serially diluted NL17 peptide. RBC extracts were obtained by three freeze/thaw cycles (liquid nitrogen/37°C).
TCR‐triggered stimulation of the hybridomas was quantified using a chromogenic substrate: chlorophenol red‐β‐D‐galactopyranoside (CPRG, Roche). Cleavage of CPRG by β‐galactosidase releases a purple product, which absorbance was read at 595 nm with a reference at 650 nm.
Ex vivo spleen T‐cell restimulations
Spleens from infected mice were collected, mashed on a 70‐μm cell strainer in RPMI supplemented with 10% of FBS and treated with RBC lysis buffer (ACK: 100 μM EDTA, 160 mM NH4Cl, and 10 mM NaHCO3). 106 spleen cells were incubated for 5 h at 37°C in the presence of brefeldin A with 105 DC with or without 5 μM of peptide, or with pRBC‐loaded DC. Intracellular IFNγ (IFNγ‐APC, XMG1.2 1/500 BD Pharmingen), TNF (TNF‐AF700, MP6‐XT22 1/300 BD Pharmingen), and IL‐10 (IL10‐BV650, JES5‐16E3 1/300 BD Horizon) were detected with Cytofix/Cytoperm kit (BD Pharmingen) or Intracellular Fixation and Permeabilization Buffer Set (eBioscience). In addition to the newly identified PbA peptides, we used the following control peptides: OVA/IR17 (ISQAVHAAHAEINEAGR) and T. gondii AS15 (AVEIHRPVPGTAPPS) restricted by I‐Ab, F4 (EIYIFTNI; Lau et al, 2011), and GAP50 (SQLLNAKYL; Howland et al, 2013) restricted by Kb and Db, respectively.
Analysis and ex vivo isolation of spleen APC subsets
Spleens were perfused with collagenase D (1 mg/ml) and DNAse I (0.1 mg/ml), cut into small pieces and incubated at 37°C for 45 min. Cell preparations were filtered using 100‐μM cell strainers, and APC populations were enriched using magnetic depletion of B, NK, and T cells (Miltenyi). For experiments that focused only on cDC, cDC were enriched using CD11c‐positive selection (Miltenyi). Cell suspensions were labeled with the following antibodies: CD3‐APC (145‐2C11, 1/300 eBioscience), CD19‐APC (ID3, 1/300 Biolegend), NK1.1‐APC (PK136, 1/300 BD Pharmingen), B220‐BV510 (RA3‐6B2, 1/500, BD Horizon), CD11b PE‐CF594 (M1/70, 1/3000 BD Horizon), CD11c PE‐Cy7 (HL3, 1/400 BD Pharmingen), Ly6C‐PerCP‐Cy5.5 (AL‐21, 1/1000 BD Pharmingen), CD64 BV421 (X54‐5/7.1, 1/300 Biolegend), CD8α APC‐Cy7 (53‐6.7, 1/200 BD Pharmingen), or XCR1‐PE (REA707, 1/100 Miltenyi). Cells were sorted on a BD AriaSorp (BD Biosciences) with purity routinely higher than 95%. Expression of MHC II was assessed in a separate mix since the anti‐I‐Ab AF700 (M5/114, 1/500 BD Pharmingen) is a blocking antibody. For experiments with Karma mice in which cDC1 are Tomato+, CD11b‐PerCP‐Cy5 (M1/70, 1/200 BD Pharmingen) was used. All flow cytometry samples were run on a Fortessa (BD Biosciences) and analyzed using FlowJo software.
Ex vivo antigen presentation assays
FACS‐sorted APC were serially diluted into 96‐W round‐bottom plates and mixed with 105 T‐cell hybrids/well. For non‐PbA antigens, 5 × 10⁴ FACS‐sorted DC per well were seeded in a 96‐W round‐bottom plate and treated as follows. To readout presentation of heat‐killed T. gondii, RH tachyzoites were treated for 15 min at 56°C in PBS and incubated with DC for 3 h before adding BTg01Z hybrids (Grover et al, 2012). To readout presentation of OVA‐expressing E. coli, an overnight pre‐culture of DH5α transformed with pGEX.4T1.OVA was transferred to 7 ml of LB medium containing 100 μg/ml ampicillin and grown for 1 h. IPTG was added, and bacteria were grown for 4 more hours at 30°C. Bacteria were counted, washed, suspended in antibiotic‐free serum‐free RPMI, and incubated with DC at the indicated MOI for 40 min. After washing, gentamycin (100 μg/ml) was added for 3 h followed by incubation with 105 OTIIZ/well (Sahara & Shastri, 2003). For exogenous peptide loading, the T. gondii I‐Ab peptide (AS15) was added to the DC simultaneously with the BTg01Z hybrids.
Statistical analyses
The Prism software (GraphPad) was used for statistical analyses. To compare each peptide to the OVA peptide in ex vivo restimulation assays, nonparametric paired t‐tests (Wilcoxon) were used. For other comparisons, unpaired t‐tests without assuming consistent SD (Welch's correction) were used.
Data deposition
The mass spectrometry proteomics data have been deposited to the ProteomeXchange Consortium via the PRIDE partner repository with the dataset identifier PXD007628.
Author contributions
Conceived and designed the experiments: MDr, MFW, J‐MS, TDA, ST, JS, ASe, AB, OS, NB. Performed the experiments: MDr, MFW, J‐MS, TDA, AH, ASa, JS. Provided Karma mice and helped design the related experiments: KC, MDa. Provided mice immunized with Pb NK65 ΔHRF: CD‐G. Wrote the manuscript: NB with help of coauthors.
Conflict of interest
The authors declare that they have no conflict of interest.
The paper explained.
Problem
Malaria is a parasitic disease causing life‐threatening complications like cerebral malaria. Natural protective immunity takes years to develop, and the efficacy of currently developed vaccines is limited. During malaria, the immune cross talk between dendritic cells (DC) and T cells prompts CD4 T cells to differentiate into functionally distinct subsets, which control the fate of memory CD8 T cell and antibody responses and ultimately determine the balance between parasite control and immunopathology. A major aim is to improve protective immunity without exacerbating immunopathology. To do this, one needs to elucidate how DC control the functionality of parasite‐specific CD4 T cells.
Results
We work with a mouse malaria model induced by Plasmodium berghei. We use proteomics to identify parasite MHC class II antigens that elicit CD4 T cells in infected mice, as well as in long‐term protected mice vaccinated with an attenuated parasite. We find that a peculiar DC subset, named cDC1, is superior for MHC II presentation of Plasmodium‐derived antigens. We further show that cDC1 promote the differentiation of a type of parasite‐specific CD4 T cells that play a pathogenic role in cerebral malaria (Th1) and that they inhibit the development of regulatory IL‐10+ CD4 T cells.
Impact
Our work sets the stage for MHC II immunopeptidome profiling in blood‐stage human malaria. This should help uncover new vaccine targets and down‐select vaccine candidates. Our study also supports the idea of harnessing DC functions to curtail excessive Th1 responses in human severe malaria.
Supporting information
Expanded View Figures PDF
Dataset EV1
Dataset EV2
Review Process File
Acknowledgements
F. L'Faqihi‐Olive, V. Duplan‐Eche, A.‐L. Iscache, and P. Menut for technical assistance at the CPTP‐INSERM U1043 flow cytometry facility, R. Balouzat and the zootechnicians at INSERM UMS006‐CREFRE mouse facility, J.F. Franetich, M. Tefit, and T. Houpert for mosquito breeding, E. Bassot and F. de Giorgi for technical help, the Blanchard team for helpful discussions, H. Acha‐Orbea for the MutuDC, M. Rescigno for the E. coli‐OVA, A.‐M. Lennon‐Duménil and D. Lankar for the JV2 antibody. This work was supported by Human Frontier Science Program Organization (CDA00047/2011 to NB), PIA PARAFRAP Consortium (ANR‐11‐LABX0024 to NB and OS), PIA ANINFIMIP equipment (ANR‐11‐EQPX‐0003 to NB), Région Occitanie PhD co‐funding (MD), “Ministère de l'Education Nationale, de la Recherche et de la Technologie” (AH), Idex Toulouse “Attractivity Chair” Program (NB).
EMBO Mol Med (2017) 9: 1605–1621
References
- Alexandre YO, Ghilas S, Sanchez C, Le Bon A, Crozat K, Dalod M (2016) XCR1+ dendritic cells promote memory CD8+ T cell recall upon secondary infections with Listeria monocytogenes or certain viruses. J Exp Med 213: 75–92 [DOI] [PMC free article] [PubMed] [Google Scholar]
- Argiro LL, Kohlstadt SS, Henri SS, Dessein HH, Matabiau VV, Paris PP, Bourgois AA, Dessein AJ (2000) Identification of a candidate vaccine peptide on the 37 kDa Schistosoma mansoni GAPDH. Vaccine 18: 2039–2048 [DOI] [PubMed] [Google Scholar]
- Ashok D, Schuster S, Ronet C, Rosa M, Mack V, Lavanchy C, Marraco SF, Fasel N, Murphy KM, Tacchini‐Cottier F et al (2014) Cross‐presenting dendritic cells are required for control of Leishmania major infection. Eur J Immunol 44: 1422–1432 [DOI] [PubMed] [Google Scholar]
- Audiger C, Rahman MJ, Yun TJ, Tarbell KV, Lesage S (2017) The importance of dendritic cells in maintaining immune tolerance. J Immunol 198: 2223–2231 [DOI] [PMC free article] [PubMed] [Google Scholar]
- Backer R, van Leeuwen F, Kraal G, den Haan JM (2008) CD8‐ dendritic cells preferentially cross‐present Saccharomyces cerevisiae antigens. Eur J Immunol 38: 370–380 [DOI] [PubMed] [Google Scholar]
- Belnoue E, Kayibanda M, Vigario AM, Deschemin JC, van Rooijen N, Viguier M, Snounou G, Renia L (2002) On the pathogenic role of brain‐sequestered alphabeta CD8+ T cells in experimental cerebral malaria. J Immunol 169: 6369–6375 [DOI] [PubMed] [Google Scholar]
- Bozzacco L, Yu H, Zebroski HA, Dengjel J, Deng H, Mojsov S, Steinman RM (2011) Mass spectrometry analysis and quantitation of peptides presented on the MHC II molecules of mouse spleen dendritic cells. J Proteome Res 10: 5016–5030 [DOI] [PMC free article] [PubMed] [Google Scholar]
- Bozzacco L, Yu H (2013) Identification and quantitation of MHC class II‐bound peptides from mouse spleen dendritic cells by immunoprecipitation and mass spectrometry analysis. Methods Mol Biol 1061: 231–243 [DOI] [PMC free article] [PubMed] [Google Scholar]
- Calabro S, Gallman A, Gowthaman U, Liu D, Chen P, Liu J, Krishnaswamy JK, Nascimento MS, Xu L, Patel SR et al (2016) Bridging channel dendritic cells induce immunity to transfused red blood cells. J Exp Med 213: 887–896 [DOI] [PMC free article] [PubMed] [Google Scholar]
- Campanella GS, Tager AM, El Khoury JK, Thomas SY, Abrazinski TA, Manice LA, Colvin RA, Luster AD (2008) Chemokine receptor CXCR3 and its ligands CXCL9 and CXCL10 are required for the development of murine cerebral malaria. Proc Natl Acad Sci USA 105: 4814–4819 [DOI] [PMC free article] [PubMed] [Google Scholar]
- Caron E, Kowalewski DJ, Chiek Koh C, Sturm T, Schuster H, Aebersold R (2015) Analysis of major histocompatibility complex (MHC) immunopeptidomes using mass spectrometry. Mol Cell Proteomics 14: 3105–3117 [DOI] [PMC free article] [PubMed] [Google Scholar]
- Cha SJ, Kim MS, Pandey A, Jacobs‐Lorena M (2016) Identification of GAPDH on the surface of Plasmodium sporozoites as a new candidate for targeting malaria liver invasion. J Exp Med 213: 2099–2112 [DOI] [PMC free article] [PubMed] [Google Scholar]
- Chen JH, Chen SB, Wang Y, Ju C, Zhang T, Xu B, Shen HM, Mo XJ, Molina DM, Eng M et al (2015) An immunomics approach for the analysis of natural antibody responses to Plasmodium vivax infection. Mol BioSyst 11: 2354–2363 [DOI] [PubMed] [Google Scholar]
- Claser C, De Souza JB, Thorburn SG, Grau GE, Riley EM, Renia L, Hafalla JCR (2017) Host resistance to plasmodium‐induced acute immune pathology is regulated by interleukin‐10 receptor signaling. Infect Immun 85: e00941‐16 [DOI] [PMC free article] [PubMed] [Google Scholar]
- Cockburn IA, Zavala F (2016) Dendritic cell function and antigen presentation in malaria. Curr Opin Immunol 40: 1–6 [DOI] [PubMed] [Google Scholar]
- Couper KN, Blount DG, Wilson MS, Hafalla JC, Belkaid Y, Kamanaka M, Flavell RA, de Souza JB, Riley EM (2008) IL‐10 from CD4CD25Foxp3CD127 adaptive regulatory T cells modulates parasite clearance and pathology during malaria infection. PLoS Pathog 4: e1000004 [DOI] [PMC free article] [PubMed] [Google Scholar]
- Daubenberger CA, Tisdale EJ, Curcic M, Diaz D, Silvie O, Mazier D, Eling W, Bohrmann B, Matile H, Pluschke G (2003) The N’‐terminal domain of glyceraldehyde‐3‐phosphate dehydrogenase of the apicomplexan Plasmodium falciparum mediates GTPase Rab2‐dependent recruitment to membranes. Biol Chem 384: 1227–1237 [DOI] [PubMed] [Google Scholar]
- Demarta‐Gatsi C, Smith L, Thiberge S, Peronet R, Commere PH, Matondo M, Apetoh L, Bruhns P, Menard R, Mecheri S (2016) Protection against malaria in mice is induced by blood stage‐arresting histamine‐releasing factor (HRF)‐deficient parasites. J Exp Med 213: 1419–1428 [DOI] [PMC free article] [PubMed] [Google Scholar]
- Dudziak D, Kamphorst AO, Heidkamp GF, Buchholz VR, Trumpfheller C, Yamazaki S, Cheong C, Liu K, Lee HW, Park CG et al (2007) Differential antigen processing by dendritic cell subsets in vivo . Science 315: 107–111 [DOI] [PubMed] [Google Scholar]
- Durai V, Murphy KM (2016) Functions of murine dendritic cells. Immunity 45: 719–736 [DOI] [PMC free article] [PubMed] [Google Scholar]
- Dutertre CA, Wang LF, Ginhoux F (2014) Aligning bona fide dendritic cell populations across species. Cell Immunol 291: 3–10 [DOI] [PubMed] [Google Scholar]
- Eickhoff S, Brewitz A, Gerner MY, Klauschen F, Komander K, Hemmi H, Garbi N, Kaisho T, Germain RN, Kastenmuller W (2015) Robust anti‐viral immunity requires multiple distinct T cell‐dendritic cell interactions. Cell 162: 1322–1337 [DOI] [PMC free article] [PubMed] [Google Scholar]
- Fauconnier M, Palomo J, Bourigault ML, Meme S, Szeremeta F, Beloeil JC, Danneels A, Charron S, Rihet P, Ryffel B et al (2012) IL‐12Rbeta2 is essential for the development of experimental cerebral malaria. J Immunol 188: 1905–1914 [DOI] [PubMed] [Google Scholar]
- Feliu V, Vasseur V, Grover HS, Chu HH, Brown MJ, Wang J, Boyle JP, Robey EA, Shastri N, Blanchard N (2013) Location of the CD8 T cell epitope within the antigenic precursor determines immunogenicity and protection against the Toxoplasma gondii parasite. PLoS Pathog 9: e1003449 [DOI] [PMC free article] [PubMed] [Google Scholar]
- Fernandez‐Ruiz D, Lau LS, Ghazanfari N, Jones CM, Ng WY, Davey GM, Berthold D, Holz L, Kato Y, Bayarsaikhan G et al (2017) Development of a novel CD4+ TCR transgenic line that reveals a dominant role for CD8+ DC and CD40‐signaling in the generation of helper and CTL responses to blood stage malaria. bioRxiv https://doi.org/10.1101/113837 [DOI] [PMC free article] [PubMed] [Google Scholar]
- Freitas do Rosario AP, Lamb T, Spence P, Stephens R, Lang A, Roers A, Muller W, O'Garra A, Langhorne J (2012) IL‐27 promotes IL‐10 production by effector Th1 CD4+ T cells: a critical mechanism for protection from severe immunopathology during malaria infection. J Immunol 188: 1178–1190. [DOI] [PMC free article] [PubMed] [Google Scholar]
- Freitas do Rosario AP, Langhorne J (2012) T cell‐derived IL‐10 and its impact on the regulation of host responses during malaria. Int J Parasitol 42: 549–555. [DOI] [PubMed] [Google Scholar]
- Frevert U, Krzych U (2015) Plasmodium cellular effector mechanisms and the hepatic microenvironment. Front Microbiol 6: 482 [DOI] [PMC free article] [PubMed] [Google Scholar]
- Fuertes Marraco SA, Grosjean F, Duval A, Rosa M, Lavanchy C, Ashok D, Haller S, Otten LA, Steiner QG, Descombes P et al (2012) Novel murine dendritic cell lines: a powerful auxiliary tool for dendritic cell research. Front Immunol 3: 331 [DOI] [PMC free article] [PubMed] [Google Scholar]
- Grover HS, Blanchard N, Gonzalez F, Chan S, Robey EA, Shastri N (2012) The Toxoplasma gondii peptide AS15 elicits CD4 T cells that can control parasite burden. Infect Immun 80: 3279–3288 [DOI] [PMC free article] [PubMed] [Google Scholar]
- Guilliams M, Ginhoux F, Jakubzick C, Naik SH, Onai N, Schraml BU, Segura E, Tussiwand R, Yona S (2014) Dendritic cells, monocytes and macrophages: a unified nomenclature based on ontogeny. Nat Rev Immunol 14: 571–578 [DOI] [PMC free article] [PubMed] [Google Scholar]
- Hafalla JC, Claser C, Couper KN, Grau GE, Renia L, de Souza JB, Riley EM (2012) The CTLA‐4 and PD‐1/PD‐L1 inhibitory pathways independently regulate host resistance to plasmodium‐induced acute immune pathology. PLoS Pathog 8: e1002504 [DOI] [PMC free article] [PubMed] [Google Scholar]
- Hansen DS, Obeng‐Adjei N, Ly A, Ioannidis LJ, Crompton PD (2017) Emerging concepts in T follicular helper cell responses to malaria. Int J Parasitol 47: 105–110 [DOI] [PubMed] [Google Scholar]
- Haque A, Best SE, Montes de Oca M, James KR, Ammerdorffer A, Edwards CL, de Labastida Rivera F, Amante FH, Bunn PT, Sheel M et al (2014) Type I IFN signaling in CD8‐ DCs impairs Th1‐dependent malaria immunity. J Clin Invest 124: 2483–2496 [DOI] [PMC free article] [PubMed] [Google Scholar]
- Helft J, Manicassamy B, Guermonprez P, Hashimoto D, Silvin A, Agudo J, Brown BD, Schmolke M, Miller JC, Leboeuf M et al (2012) Cross‐presenting CD103+ dendritic cells are protected from influenza virus infection. J Clin Invest 122: 4037–4047 [DOI] [PMC free article] [PubMed] [Google Scholar]
- Heyder T, Kohler M, Tarasova NK, Haag S, Rutishauser D, Rivera NV, Sandin C, Mia S, Malmstrom V, Wheelock AM et al (2016) Approach for identifying human leukocyte antigen (HLA)‐DR bound peptides from scarce clinical samples. Mol Cell Proteomics 15: 3017–3029 [DOI] [PMC free article] [PubMed] [Google Scholar]
- Hildner K, Edelson BT, Purtha WE, Diamond M, Matsushita H, Kohyama M, Calderon B, Schraml BU, Unanue ER, Diamond MS et al (2008) Batf3 deficiency reveals a critical role for CD8alpha+ dendritic cells in cytotoxic T cell immunity. Science 322: 1097–1100 [DOI] [PMC free article] [PubMed] [Google Scholar]
- Hor JL, Whitney PG, Zaid A, Brooks AG, Heath WR, Mueller SN (2015) Spatiotemporally distinct interactions with dendritic cell subsets facilitates CD4+ and CD8+ T cell activation to localized viral infection. Immunity 43: 554–565 [DOI] [PubMed] [Google Scholar]
- Howland SW, Poh CM, Gun SY, Claser C, Malleret B, Shastri N, Ginhoux F, Grotenbreg GM, Renia L (2013) Brain microvessel cross‐presentation is a hallmark of experimental cerebral malaria. EMBO Mol Med 5: 984–999 [DOI] [PMC free article] [PubMed] [Google Scholar]
- Howland SW, Claser C, Poh CM, Gun SY, Renia L (2015a) Pathogenic CD8+ T cells in experimental cerebral malaria. Semin Immunopathol 37: 221–231 [DOI] [PubMed] [Google Scholar]
- Howland SW, Poh CM, Renia L (2015b) Activated brain endothelial cells cross‐present malaria antigen. PLoS Pathog 11: e1004963 [DOI] [PMC free article] [PubMed] [Google Scholar]
- Imai T, Ishida H, Suzue K, Hirai M, Taniguchi T, Okada H, Suzuki T, Shimokawa C, Hisaeda H (2013) CD8(+) T cell activation by murine erythroblasts infected with malaria parasites. Sci Rep 3: 1572 [DOI] [PMC free article] [PubMed] [Google Scholar]
- Janssen EM, Droin NM, Lemmens EE, Pinkoski MJ, Bensinger SJ, Ehst BD, Griffith TS, Green DR, Schoenberger SP (2005) CD4+ T‐cell help controls CD8+ T‐cell memory via TRAIL‐mediated activation‐induced cell death. Nature 434: 88–93 [DOI] [PubMed] [Google Scholar]
- Jin H, Agarwal S, Pancholi V (2011) Surface export of GAPDH/SDH, a glycolytic enzyme, is essential for Streptococcus pyogenes virulence. MBio 2: e00068‐00011 [DOI] [PMC free article] [PubMed] [Google Scholar]
- Kimura D, Miyakoda M, Kimura K, Honma K, Hara H, Yoshida H, Yui K (2016) Interleukin‐27‐producing CD4(+) T cells regulate protective immunity during malaria parasite infection. Immunity 44: 672–682 [DOI] [PubMed] [Google Scholar]
- Lau LS, Fernandez Ruiz D, Davey GM, de Koning‐Ward TF, Papenfuss AT, Carbone FR, Brooks AG, Crabb BS, Heath WR (2011) Blood‐stage Plasmodium berghei infection generates a potent, specific CD8+ T‐Cell response despite residence largely in cells lacking MHC I processing machinery. J Infect Dis 204: 1989–1996 [DOI] [PubMed] [Google Scholar]
- Lau LS, Fernandez‐Ruiz D, Mollard V, Sturm A, Neller MA, Cozijnsen A, Gregory JL, Davey GM, Jones CM, Lin YH et al (2014) CD8+ T cells from a Novel T cell receptor transgenic mouse induce liver‐stage immunity that can be boosted by blood‐stage infection in rodent malaria. PLoS Pathog 10: e1004135 [DOI] [PMC free article] [PubMed] [Google Scholar]
- Liu J, Cao X (2015) Regulatory dendritic cells in autoimmunity: a comprehensive review. J Autoimmun 63: 1–12 [DOI] [PubMed] [Google Scholar]
- Lonnberg T, Svensson V, James KR, Fernandez‐Ruiz D, Sebina I, Montandon R, Soon MS, Fogg LG, Nair AS, Liligeto U et al (2017) Single‐cell RNA‐seq and computational analysis using temporal mixture modelling resolves Th1/Tfh fate bifurcation in malaria. Sci Immunol 2: eaal2192 [DOI] [PMC free article] [PubMed] [Google Scholar]
- Lundie RJ, de Koning‐Ward TF, Davey GM, Nie CQ, Hansen DS, Lau LS, Mintern JD, Belz GT, Schofield L, Carbone FR et al (2008) Blood‐stage Plasmodium infection induces CD8+ T lymphocytes to parasite‐expressed antigens, largely regulated by CD8alpha+ dendritic cells. PNAS 105: 14509–14514 [DOI] [PMC free article] [PubMed] [Google Scholar]
- Lundie RJ, Young LJ, Davey GM, Villadangos JA, Carbone FR, Heath WR, Crabb BS (2010) Blood‐stage Plasmodium berghei infection leads to short‐lived parasite‐associated antigen presentation by dendritic cells. Eur J Immunol 40: 1674–1681 [DOI] [PubMed] [Google Scholar]
- Manzoni G, Briquet S, Risco‐Castillo V, Gaultier C, Topcu S, Ivanescu ML, Franetich JF, Hoareau‐Coudert B, Mazier D, Silvie O (2014) A rapid and robust selection procedure for generating drug‐selectable marker‐free recombinant malaria parasites. Sci Rep 4: 4760 [DOI] [PMC free article] [PubMed] [Google Scholar]
- Martinez‐Lopez M, Iborra S, Conde‐Garrosa R, Sancho D (2015) Batf3‐dependent CD103+ dendritic cells are major producers of IL‐12 that drive local Th1 immunity against Leishmania major infection in mice. Eur J Immunol 45: 119–129 [DOI] [PMC free article] [PubMed] [Google Scholar]
- Mashayekhi M, Sandau MM, Dunay IR, Frickel EM, Khan A, Goldszmid RS, Sher A, Ploegh HL, Murphy TL, Sibley LD et al (2011) CD8alpha(+) dendritic cells are the critical source of interleukin‐12 that controls acute infection by Toxoplasma gondii tachyzoites. Immunity 35: 249–259 [DOI] [PMC free article] [PubMed] [Google Scholar]
- Nacer A, Movila A, Sohet F, Girgis NM, Gundra UM, Loke P, Daneman R, Frevert U (2014) Experimental cerebral malaria pathogenesis‐hemodynamics at the blood brain barrier. PLoS Pathog 10: e1004528 [DOI] [PMC free article] [PubMed] [Google Scholar]
- Natarajan SK, Stern LJ, Sadegh‐Nasseri S (1999) Sodium dodecyl sulfate stability of HLA‐DR1 complexes correlates with burial of hydrophobic residues in pocket 1. J Immunol 162: 3463–3470 [PubMed] [Google Scholar]
- Oakley MS, Sahu BR, Lotspeich‐Cole L, Solanki NR, Majam V, Pham PT, Banerjee R, Kozakai Y, Derrick SC, Kumar S et al (2013) The transcription factor T‐bet regulates parasitemia and promotes pathogenesis during Plasmodium berghei ANKA Murine Malaria. J Immunol 191: 4699–4708 [DOI] [PubMed] [Google Scholar]
- Olotu A, Fegan G, Wambua J, Nyangweso G, Leach A, Lievens M, Kaslow DC, Njuguna P, Marsh K, Bejon P (2016) Seven‐Year efficacy of RTS, S/AS01 malaria vaccine among young African children. N Engl J Med 374: 2519–2529 [DOI] [PMC free article] [PubMed] [Google Scholar]
- Otto TD, Bohme U, Jackson AP, Hunt M, Franke‐Fayard B, Hoeijmakers WA, Religa AA, Robertson L, Sanders M, Ogun SA et al (2014) A comprehensive evaluation of rodent malaria parasite genomes and gene expression. BMC Biol 12: 86 [DOI] [PMC free article] [PubMed] [Google Scholar]
- Pasini EM, Braks JA, Fonager J, Klop O, Aime E, Spaccapelo R, Otto TD, Berriman M, Hiss JA, Thomas AW et al (2013) Proteomic and genetic analyses demonstrate that Plasmodium berghei blood stages export a large and diverse repertoire of proteins. Mol Cell Proteomics 12: 426–448 [DOI] [PMC free article] [PubMed] [Google Scholar]
- Perez‐Casal J, Potter AA (2016) Glyceradehyde‐3‐phosphate dehydrogenase as a suitable vaccine candidate for protection against bacterial and parasitic diseases. Vaccine 34: 1012–1017 [DOI] [PubMed] [Google Scholar]
- Perez‐Mazliah D, Ng DH, Freitas do Rosario AP, McLaughlin S, Mastelic‐Gavillet B, Sodenkamp J, Kushinga G, Langhorne J (2015) Disruption of IL‐21 signaling affects T cell‐B cell interactions and abrogates protective humoral immunity to malaria. PLoS Pathog 11: e1004715 [DOI] [PMC free article] [PubMed] [Google Scholar]
- Piva L, Tetlak P, Claser C, Karjalainen K, Renia L, Ruedl C (2012) Cutting edge: Clec9A+ dendritic cells mediate the development of experimental cerebral malaria. J Immunol 189: 1128–1132 [DOI] [PubMed] [Google Scholar]
- Poh CM, Howland SW, Grotenbreg GM, Renia L (2014) Damage to the blood‐brain barrier during experimental cerebral malaria results from synergistic effects of CD8+ T cells with different specificities. Infect Immun 82: 4854–4864 [DOI] [PMC free article] [PubMed] [Google Scholar]
- Pozsgay J, Szekanecz Z, Sarmay G (2017) Antigen‐specific immunotherapies in rheumatic diseases. Nat Rev Rheumatol 13: 525–537 [DOI] [PubMed] [Google Scholar]
- Price JD, Hotta‐Iwamura C, Zhao Y, Beauchamp NM, Tarbell KV (2015) DCIR2+ cDC2 DCs and Zbtb32 restore CD4+ T‐cell tolerance and inhibit diabetes. Diabetes 64: 3521–3531 [DOI] [PMC free article] [PubMed] [Google Scholar]
- Radtke AJ, Kastenmuller W, Espinosa DA, Gerner MY, Tse SW, Sinnis P, Germain RN, Zavala FP, Cockburn IA (2015a) Lymph‐node resident CD8alpha+ dendritic cells capture antigens from migratory malaria sporozoites and induce CD8+ T cell responses. PLoS Pathog 11: e1004637 [DOI] [PMC free article] [PubMed] [Google Scholar]
- Radtke AJ, Tse SW, Zavala F (2015b) From the draining lymph node to the liver: the induction and effector mechanisms of malaria‐specific CD8+ T cells. Semin Immunopathol 37: 211–220 [DOI] [PMC free article] [PubMed] [Google Scholar]
- Renia L, Goh YS (2016) Malaria parasites: the great escape. Front Immunol 7: 463 [DOI] [PMC free article] [PubMed] [Google Scholar]
- Riquelme SA, Pogu J, Anegon I, Bueno SM, Kalergis AM (2015) Carbon monoxide impairs mitochondria‐dependent endosomal maturation and antigen presentation in dendritic cells. Eur J Immunol 45: 3269–3288 [DOI] [PubMed] [Google Scholar]
- Safeukui I, Gomez ND, Adelani AA, Burte F, Afolabi NK, Akondy R, Velazquez P, Holder A, Tewari R, Buffet P et al (2015) Malaria induces anemia through CD8+ T cell‐dependent parasite clearance and erythrocyte removal in the spleen. MBio 6: e02493‐14 [DOI] [PMC free article] [PubMed] [Google Scholar]
- Sahara H, Shastri N (2003) Second class minors: molecular identification of the autosomal H46 histocompatibility locus as a peptide presented by major histocompatibility complex class II molecules. J Exp Med 197: 375–385 [DOI] [PMC free article] [PubMed] [Google Scholar]
- Schnorrer P, Behrens GM, Wilson NS, Pooley JL, Smith CM, El‐Sukkari D, Davey G, Kupresanin F, Li M, Maraskovsky E et al (2006) The dominant role of CD8+ dendritic cells in cross‐presentation is not dictated by antigen capture. Proc Natl Acad Sci USA 103: 10729–10734 [DOI] [PMC free article] [PubMed] [Google Scholar]
- Scholzen A, Sauerwein RW (2016) Immune activation and induction of memory: lessons learned from controlled human malaria infection with Plasmodium falciparum. Parasitology 143: 224–235 [DOI] [PubMed] [Google Scholar]
- Sebina I, James KR, Soon MS, Fogg LG, Best SE, Labastida Rivera F, Montes de Oca M, Amante FH, Thomas BS, Beattie L et al (2016) IFNAR1‐Signalling Obstructs ICOS‐mediated Humoral Immunity during Non‐lethal Blood‐Stage Plasmodium Infection. PLoS Pathog 12: e1005999 [DOI] [PMC free article] [PubMed] [Google Scholar]
- Sidney J, Southwood S, Moore C, Oseroff C, Pinilla C, Grey HM, Sette A (2013) Measurement of MHC/peptide interactions by gel filtration or monoclonal antibody capture. Curr Protoc Immunol Chapter 18: Unit 18 13 [DOI] [PMC free article] [PubMed] [Google Scholar]
- Sissoko MS, Healy SA, Katile A, Omaswa F, Zaidi I, Gabriel EE, Kamate B, Samake Y, Guindo MA, Dolo A et al (2017) Safety and efficacy of PfSPZ Vaccine against Plasmodium falciparum via direct venous inoculation in healthy malaria‐exposed adults in Mali: a randomised, double‐blind phase 1 trial. Lancet Infect Dis 17: 498–509 [DOI] [PMC free article] [PubMed] [Google Scholar]
- Sofron A, Ritz D, Neri D, Fugmann T (2016) High‐resolution analysis of the murine MHC class II immunopeptidome. Eur J Immunol 46: 319–328 [DOI] [PubMed] [Google Scholar]
- de Souza JB, Hafalla JC, Riley EM, Couper KN (2010) Cerebral malaria: why experimental murine models are required to understand the pathogenesis of disease. Parasitology 137: 755–772 [DOI] [PubMed] [Google Scholar]
- Spielmann T, Fergusen DJ, Beck HP (2003) etramps, a new Plasmodium falciparum gene family coding for developmentally regulated and highly charged membrane proteins located at the parasite‐host cell interface. Mol Biol Cell 14: 1529–1544 [DOI] [PMC free article] [PubMed] [Google Scholar]
- Sponaas AM, Cadman ET, Voisine C, Harrison V, Boonstra A, O'Garra A, Langhorne J (2006) Malaria infection changes the ability of splenic dendritic cell populations to stimulate antigen‐specific T cells. J Exp Med 203: 1427–1433 [DOI] [PMC free article] [PubMed] [Google Scholar]
- Stephens R, Langhorne J (2010) Effector memory Th1 CD4 T cells are maintained in a mouse model of chronic malaria. PLoS Pathog 6: e1001208 [DOI] [PMC free article] [PubMed] [Google Scholar]
- Swanson PA II, Hart GT, Russo MV, Nayak D, Yazew T, Pena M, Khan SM, Janse CJ, Pierce SK, McGavern DB (2016) CD8+ T cells induce fatal brainstem pathology during cerebral malaria via luminal antigen‐specific engagement of brain vasculature. PLoS Pathog 12: e1006022 [DOI] [PMC free article] [PubMed] [Google Scholar]
- Swearingen KE, Lindner SE, Shi L, Shears MJ, Harupa A, Hopp CS, Vaughan AM, Springer TA, Moritz RL, Kappe SH et al (2016) Interrogating the plasmodium sporozoite surface: identification of surface‐exposed proteins and demonstration of glycosylation on CSP and TRAP by mass spectrometry‐based proteomics. PLoS Pathog 12: e1005606 [DOI] [PMC free article] [PubMed] [Google Scholar]
- Tham WH, Beeson JG, Rayner JC (2017) Plasmodium vivax vaccine research – we've only just begun. Int J Parasitol 47: 111–118 [DOI] [PubMed] [Google Scholar]
- Van Braeckel‐Budimir N, Kurup SP, Harty JT (2016) Regulatory issues in immunity to liver and blood‐stage malaria. Curr Opin Immunol 42: 91–97 [DOI] [PubMed] [Google Scholar]
- Van den Steen PE, Deroost K, Van Aelst I, Geurts N, Martens E, Struyf S, Nie CQ, Hansen DS, Matthys P, Van Damme J et al (2008) CXCR3 determines strain susceptibility to murine cerebral malaria by mediating T lymphocyte migration toward IFN‐gamma‐induced chemokines. Eur J Immunol 38: 1082–1095 [DOI] [PubMed] [Google Scholar]
- Villegas‐Mendez A, Greig R, Shaw TN, de Souza JB, Gwyer Findlay E, Stumhofer JS, Hafalla JC, Blount DG, Hunter CA, Riley EM et al (2012) IFN‐gamma‐producing CD4+ T cells promote experimental cerebral malaria by modulating CD8+ T cell accumulation within the brain. J Immunol 189: 968–979 [DOI] [PMC free article] [PubMed] [Google Scholar]
- Villegas‐Mendez A, Inkson CA, Shaw TN, Strangward P, Couper KN (2016) Long‐lived CD4+IFN‐gamma+ T cells rather than short‐lived CD4+IFN‐gamma+IL‐10+ T cells initiate rapid IL‐10 production to suppress anamnestic T cell responses during secondary malaria infection. J Immunol 197: 3152–3164 [DOI] [PMC free article] [PubMed] [Google Scholar]
- Vu Manh TP, Bertho N, Hosmalin A, Schwartz‐Cornil I, Dalod M (2015) Investigating evolutionary conservation of dendritic cell subset identity and functions. Front Immunol 6: 260 [DOI] [PMC free article] [PubMed] [Google Scholar]
- Yamazaki C, Sugiyama M, Ohta T, Hemmi H, Hamada E, Sasaki I, Fukuda Y, Yano T, Nobuoka M, Hirashima T et al (2013) Critical roles of a dendritic cell subset expressing a chemokine receptor, XCR1. J Immunol 190: 6071–6082 [DOI] [PubMed] [Google Scholar]
- Zander RA, Guthmiller JJ, Graham AC, Pope RL, Burke BE, Carr DJ, Butler NS (2016) Type I interferons induce T regulatory 1 responses and restrict humoral immunity during experimental malaria. PLoS Pathog 12: e1005945 [DOI] [PMC free article] [PubMed] [Google Scholar]
Associated Data
This section collects any data citations, data availability statements, or supplementary materials included in this article.
Supplementary Materials
Expanded View Figures PDF
Dataset EV1
Dataset EV2
Review Process File