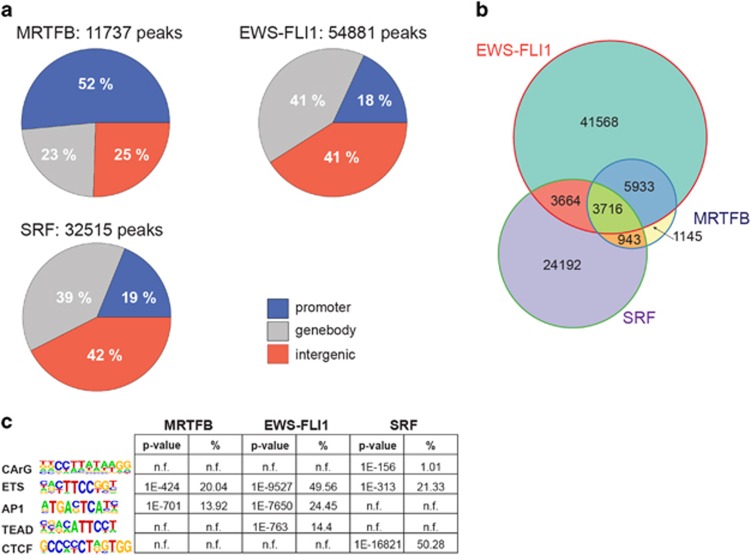
Figure 3.
ChIP-seq of MRTFB and EWS-FLI1 suggests functional interaction on chromatin level. (a) Genome-wide distribution pattern of MRTFB, EWS-FLI1 and SRF ChIP-seq peaks. Peaks were defined as ‘proximal’ (−5 to +1 kb from the TSS), ‘genebody’ or ‘distal’ (all other peaks). (b) Venn diagram showing the genome-wide overlaps of EWS-FLI1, SRF and MRTFB ChIP-seq peaks. (c) Table of most enriched sequence motifs (with P-values and percentage of peaks harboring the motif) found in the MRTFB, EWS-FLI1 and SRF-binding regions (motif analysis was performed by the HOMER software, n.f. indicates that motif was not found in the HOMER analysis). For detailed HOMER motif analysis output see Supplementary Table 4.

