

Abstract
Brassica rapa is a polyploid species with phenotypically diverse cultivated subspecies. Glucosinolates (GSLs) are secondary metabolites that contribute to anticarcinogenic activity and plant defense in Brassicaceae. Previously, complete coding sequences of 13 BrMYB transcription factors (TFs) related to GSL biosynthesis were identified in the B. rapa genome. In the present study, we investigated GSL content and expression levels of these BrMYB TFs in 38 accessions belonging to eight subspecies of B. rapa. Twelve identified GSLs were detected and were classified into three chemical groups based on patterns of GSL content and expression profiles of the BrMYB TFs. GSL content and BrMYB TF expression levels differed among genotypes, including B. rapa subspecies pekinensis, chinensis and rapa. BrMYB28.3, BrMYB51.1 and BrMYB122.2 positively regulated GSL content in 38 accessions. Furthermore, expression levels of BrMYB28s and BrMYB34.3 increased under most abiotic and biotic stress treatments. The three BrMYB51 paralogs also showed drastically increased expression levels after infection with Pectobacterium carotovorum. The results of the present study improve our understanding of the functional diversity of these 13 BrMYB TFs during the evolution of polyploid B. rapa.
Keywords: Brassica rapa subspecies, BrMYB transcription factors, DNA‐binding domain, desulfo, expression profiling, glucosinolate, stress defense mechanism
Abbreviations
- Aa
amino acids
- EST
expressed sequence tag
- GSL
glucosinolate
- TF
transcription factor
Brassica rapa belongs to the Brassicaceae family and has a number of subspecies with wide morphological variations. The subspecies are mainly distinguished by their leaf morphology (e.g. Chinese cabbage, pak choi and turnip types). The agricultural and nutritional properties of Brassica subspecies have resulted in their worldwide cultivation. The subspecies Chinese cabbage and pak choi are important vegetable sources and are also useful as fodder. Turnip rape subspecies are important oil crops in Asia and Europe. Furthermore, the B. rapa subspecies contain numerous nutritional products, including dietary fiber, vitamins and secondary metabolites, such as flavonoids, anthocyanins and glucosinolates (GSLs) 1. In addition to being an agriculturally important resource, B. rapa is also a model dicot plant for studies of polyploidy‐related genome evolution. Brassica and Arabidopsis thaliana diverged from a common ancestor and Brassica has undergone genome triplication recently 2, 3. The recent completion of the sequence of the B. rapa polyploid genome now allows for the identification of various gene families in its genome. In particular, hormone‐related genes (e.g. auxin‐related genes) and secondary metabolite‐related genes (e.g. GSL and anthocyanin) have been identified in the B. rapa genome by comparative genome analysis with A. thaliana 4, 5, 6, 7.
Glucosinolates are secondary metabolites that play an important role in plant defense mechanisms against environmental changes or stress. Recently, some GSLs and their breakdown products have attracted attention as a result of their anticarcinogenic and antioxidative activities in humans 8, 9. GSLs are classified into three groups: (a) aliphatic GSLs derived from the amino acids (aa) Met, Ala, Leu, Ile or Val; (b) indolic GSLs derived from Trp; and (c) aromatic GSLs derived from Phe or Tyr 10. GSLs are derived from aa and sugars via three primary biosynthetic steps: (a) aa chain‐elongation; (b) core GSL biosynthesis; and (c) side chain modification. Many studies on GSL biosynthesis have been performed using molecular biological approaches in A. thaliana 10, 11, 12. These have shown that some R2R3 MYB transcription factors (TFs) are regulators that control GSL biosynthesis. MYB28, MYB29 and MYB76 is a positive regulator of aliphatic GSLs in Arabidopsis, and high transcription levels of MYB28 result in the production of large amounts of aliphatic GSLs 13, 14. Furthermore, MYB34, MYB51 and MYB122 have been shown to regulate indolic GSL biosynthesis 12, 14. However, the identification of the complete regulation mechanism of GSL biosynthesis will require the expression analyses of additional genes and the use of different plant species. Recently, we reported the functional analysis of BrMYB28 TFs using Agrobacterium‐mediated transformation in B. rapa 15. Our results suggested that GSL regulation in B. rapa involves a more complex GSL pathway than in Arabidopsis because of the complexity of the B. rapa genome following polyploid evolution. Therefore, understanding the regulation of GSL biosynthesis in B. rapa will provide useful information for research into secondary metabolites in other crop and plant species with polyploid genomes.
Glucosinolate content is known to vary in response to genetic and environmental factors in Brassica crops 16, 17, 18. Furthermore, GSL content also varies among plant tissues and developmental stage. B. rapa exhibits wide morphological phenotypic variation in features such as leaf and root shape, size and color 19. Therefore, it can be hypothesized that variations in GSL content in B. rapa may reflect a wide range of expression profiles of GSL biosynthesis‐related genes. Studies on GSLs in B. rapa have mostly been focused on variation of GSL content in many cultivars or on expression analyses of some genes related to GSL biosynthesis in B. rapa 20, 21, 22. There is a lack of expression profiles of genes related to GSL biosynthesis and GSL content variation in different B. rapa subspecies with wide morphological variation. A greater understanding of how expression of duplicated genes is involved in GSL content variation in B. rapa will provide greater insights into the evolution of duplicated gene expression and functional changes in this polyploid species.
We performed a comparative genome analysis aiming to identify MYB TFs that regulate GSL biosynthesis in B. rapa and compared their sequences with those of Arabidopsis. We also analyzed the expression levels of 13 BrMYB TFs and GSL content in 38 accessions of eight subspecies of B. rapa. MYB TFs are known to play important roles in the regulation of various biological processes, such as secondary metabolism, plant stress responses and plant development 23, 24. To better understand the functional diversity of MYB TFs related to GSL biosynthesis in B. rapa, we screened a microarray database aiming to identify BrMYB TFs that respond to abiotic and biotic stresses. Together, these results will be useful for understanding the functions of BrMYB TFs in GSL biosynthesis regulation and plant defense mechanisms in B. rapa and related polyploids.
Materials and methods
Plant material
Seeds from 38 accessions of eight B. rapa subspecies were obtained from the National Agrobiodiversity Center (Rural Development Administration, Republic of Korea). Seeds were sown in soil and plants were grown in a greenhouse under a 16‐h photoperiod at 24 °C. Fresh leaves of 6‐week‐old plants were harvested and used for analysis of GSL content and for real‐time PCR.
Identification and analysis of MYB TFs in B. rapa
Genome information on GSL biosynthesis‐related TFs of B. rapa was obtained from the National Center for Biotechnology Information (NCBI, Bethesda, MD, USA) and the Brassica Database (http://brassicadb.org/brad). GSL biosynthesis‐related BrMYB TFs with complete coding sequence were analyzed. The R2R3 binding domain was predicted by smart analysis (http://smart.embl-heidelberg.de) and a multiple sequence alignment of 13 BrMYB TFs was performed using clustalw2 (http://www.ebi.ac.uk/Tools/msa/clustalw2). A phylogenetic tree was obtained using mega6 software (http://megasoftware.net) based on previously published MYB TFs related to the GSL biosynthesis pathway in B. rapa and A. thaliana 15. Expression profiles of BrMYB TFs in leaves of the cultivar Chiifu (B. rapa ssp. pekinensis) subjected to abiotic [cold (4 °C), salt (250 mm NaCl), drought (air‐dry) and ABA (100 μm)] and biotic (Plasmodiophora brassicae and Pectobacterium carotovorum) stress treatments were analyzed using the microarray and unigene database on the B. rapa Genome Project website (http://nabic.rda.go.kr). For additional detail on the abiotic stress experiments, 3‐week‐old plants (after germination and before the abiotic treatment) were used as controls. For the cold treatment, 3‐week‐old plants were placed in a growth chamber at 4 °C under continuous light. In the drought treatment, the plants were removed from pot together with soil and then air dried in a growth chamber. For salt and ABA treatments, the plants transferred to and grown in each of water containing 250 mm NaCl and 100 μm abscisic acid under continuous light. The plants for the abiotic experiments were treated to stress conditions for specific periods: 0.5, 3, 12, 24 and 48 h of treatment under cold, salt and ABA stress and 6, 12, 24 and 48 h of treatment under drought stress. For the biotic stress experiments and the infection of P. brassicae, the club root strains (race4) were homogenized in sterile distilled water in a blender and then the roots of the 1‐week‐old seedlings after germination were immersed into the suspension for 24 h. For the infection of P. carotovorum, the pathogens were grown for 24 h on PSA medium (10 g·L−1 peptone, 10 g·L−1 sucrose, 1 g·L−1 sodium‐glutamate and 15 g·L−1 agar). The bacterial pellets resuspended in sterile distilled water containing 0.9% NaCl (D 600 = 0.2) and then top third upper part from the top of the leaves of 3‐week‐old plants was inoculated with the bacterial suspension. These experiments were performed with two biological replicates. Whole plants at abiotic stress treatments and tissues at biotic stress treatments frozen in liquid nitrogen at each time point and total RNA were isolated from each sample for microarray analysis. Detail experimental information with respect to construction of the microarray and the unigenes database is provided in Lee et al. 25.
HPLC analysis for identification of GSL content
Desulfo (DS)‐GSLs were extracted in accordance with the procedure of Kim et al. 26. Fresh leaves of 6‐week‐old plants were freeze‐dried and 100 mg samples were used for protein extraction by boiling with 1.5 mL of 70% (v/v) methanol in a water bath. As an external standard, we used 0.5 mg of sinigrin (SNG) dissolved in 5 mL of ultrapure water. Crude extracts were loaded on Sephadex A25 columns and desulfated overnight using aryl sulfatase (EC3.1.6.1) prior to HPLC. DS‐GSLs were analyzed using a 1200 series HPLC system (Agilent Technologies, Santa Clara, CA, USA) equipped with an Inertsil ODS‐3 column (150 × 3.0 mm inner diameter, particle size 3 μm; GL Science, Tokyo, Japan). The HPLC analysis was carried out using a flow rate of 0.4 mL·min−1 at a column oven temperature of 35 °C and a wavelength of 227 nm. The individual GSLs were quantified by comparison with the external standard SNG and the values for total GSLs were obtained by summing the values of the identified individual GSLs (Table 1). Data were recorded for individual, total aliphatic, total indolic and total GSL content samples. The experiment was performed as three biological replicates and the data obtained were used to calculate means.
Table 1.
GSLs identified in 38 accessions of Brassica rapa
| Number | Systematic name | Trivial name | Abbreviation |
|---|---|---|---|
| Aliphatic | |||
| 1 | 2‐Hydroxy‐3‐butenyl | Progoitrin | PRO |
| 2 | 4‐Methylsulfinylbutyl | Glucoraphanin | GRA |
| 3 | 2‐Propenyl | Sinigrin | SNG |
| 4 | 5‐Methylsulfinylpentyl | Glucoalyssin | GAL |
| 5 | 2‐Hydroxy‐4‐pentenyl | Gluconapoleiferin | GNL |
| 6 | 3‐Butenyl | Gluconapin | GNA |
| 7 | 1‐Methylpropyl | Glucocochlearin | GCC |
| 8 | 4‐Pentenyl | Glucobrassicanapin | GBN |
| Indolic | |||
| 9 | 3‐Indolylmethyl | Glucobrassicin | GBS |
| 10 | 4‐Methoxy‐3‐indolylmethyl | 4‐Methoxyglucobrassicin | 4‐MOGBS |
| 11 | 1‐Methoxy‐3‐indolylmethyl | Neoglucobrassicin | NGBS |
| Aromatic | |||
| 12 | 2‐Phenylethyl | Gluconasturtiin | GNT |
RNA extraction and real‐time PCR analysis
Total RNA was isolated from whole plant leaves using a Hybrid‐R kit (GeneAll, Seoul, Korea) and treated with RNase‐free DNase I (Takara, Tokyo, Japan) to eliminate contaminating genomic DNA. Approximately 2 μg of total RNA was reverse transcribed into cDNA with oligo‐dT primers using a first‐strand cDNA synthesis kit (Gendepot, Katy, TX, USA). The synthesized cDNAs were diluted ten‐fold in sterilized water and a real‐time PCR was performed using 2 μL of diluted cDNA in 20 μL of SYBR® Green mix (GeneAll). The primers for member‐specific detection of expression of BrMYB TFs were designed for the 3′‐terminal region. The Bractin gene primer was used as a control for all expression analyses. The gene‐specific primers used for real‐time PCR analysis are shown in Table S1. We used the thermal cycler conditions recommended by the manufacturer: 40 cycles of 95 °C for 10 s, 55 °C for 20 s and 72 °C for 30 s. All experiments were performed as three biological and technical replicates and the data obtained were used to calculate means.
Results
Characterization of BrMYB TFs related to GSL biosynthesis
In total, we identified 13 orthologous copies with complete coding sequences corresponding to five MYB TFs, a consequence of genome triplication in B. rapa, by comparative genomic analysis with A. thaliana (Table 2). Three orthologous copies of MYB28 TF were found in the B. rapa genome and all shared more than 80% sequence identify with Arabidopsis. Only one copy of MYB29 TF, BrMYB29, was identified in the B. rapa genome and this showed the lowest identity (76%) to the corresponding Arabidopsis sequence. Four copies of MYB34 were found and all shared more than 80% sequence identity with Arabidopsis. Three BrMYB51 TFs were identified: BrMYB51.1 and BrMYB51.3 showed 78% sequence identity to Arabidopsis; BrMYB51.2 showed 80% sequence identity. Two copies of MYB122 TF were found and showed 81% and 82% sequence identity to Arabidopsis. The 13 BrMYB TFs had variations in orthologous and paralogous gene lengths. Additionally, the 13 BrMYB TFs paralogs were present on different bacterial artificial chromosome clones, indicating variation in chromosomal positions. Amino acid sequence alignments of the 13 BrMYB TFs showed that they were highly conserved at the orthologous and paralogous levels in the R2R3‐MYB domain (Fig. 1). All 13 BrMYB TFs had two typical R2R3 MYB‐DNA‐binding domains (DBDs), were 102 aa in length, and exhibited more than 90% sequence identity to each other. These results indicate variation in gene length (bp) and nonsynonymous aa sequences caused by polymorphisms in the C‐terminal region.
Table 2.
DNA sequence summary of the BrMYB TFs related to GSL biosynthesis in Brassica rapa
| Arabidopsis gene ID | B. rapa gene name | B. rapa gene ID | Length | Chromosome | EST clones | CDS identity to Arabidopsis (%) | ||
|---|---|---|---|---|---|---|---|---|
| Gene (bp) | CDS (bp) | Protein (aa) | ||||||
| AT5G61420 | BrMYB28.1 | Bra012961 | 1349 | 1065 | 354 | A03 | KBLS‐095C01 | 82 |
| BrMYB28.2 | Bra035929 | 1370 | 1074 | 357 | A09 | KBFL‐120H07 | 84 | |
| BrMYB28.3 | Bra029311 | 1617 | 1119 | 372 | A02 | KFFB‐103G11 | 81 | |
| AT5G07690 | BrMYB29.1 | Bra005949 | 1410 | 993 | 330 | A03 | KBCD‐052H08 | 76 |
| AT5G60890 | BrMYB34.1 | Bra035954 | 1148 | 909 | 302 | A09 | KBCG‐059A10 | 84 |
| BrMYB34.2 | Bra013000 | 1390 | 951 | 316 | A03 | KHRT‐17B07 | 82 | |
| BrMYB34.3 | Bra029349 | 1172 | 843 | 280 | A02 | KHCT‐21C09 | 81 | |
| BrMYB34.4 | Bra029350 | 6952 | 930 | 309 | A02 | KBLS‐091A11 | 81 | |
| AT1G18570 | BrMYB51.1 | Bra031035 | 1251 | 963 | 320 | A09 | KHLD‐17B11 | 78 |
| BrMYB51.2 | Bra016553 | 1538 | 1002 | 333 | A08 | KHCT‐02G03 | 80 | |
| BrMYB51.3 | Bra025666 | 1278 | 1026 | 341 | A06 | KHRT‐27H04 | 78 | |
| AT1G74080 | BrMYB122.1 | Bra015939 | 1455 | 981 | 319 | A07 | – | 81 |
| BrMYB122.2 | Bra008131 | 1929 | 1005 | 334 | A02 | – | 82 | |
Figure 1.
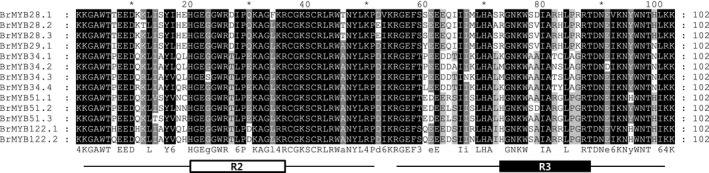
ClustalW aa sequence alignment of the R2R3‐MYB domain in GSL biosynthetic TFs of 13 Brassica rapa accessions. The shading of the alignment represents different degrees of conservation among sequences. The R2 and R3 binding domains are boxed in white and black, respectively.
Profile of GSL content in 38 B. rapa accessions
We examined the regulation of GSL biosynthesis in 38 accessions of eight subspecies of B. rapa that exhibited morphological variation in leaf shape (Fig. 2). Lou et al. 27 performed an analysis of quantitative trait loci that controlled various phenotypic characteristics, including leaf morphology, in B. rapa subspecies; they devised a classification system for leaf edge shape comprising: (a) entire; (b) slightly serrated; (c) intermediately serrated; and (d) very serrated. We used this system to classify the eight subspecies analyzed: (a) parachinensis, chinensis, narinosa were entire; (b) pekinensis was slightly serrated; (c) rapa was intermediately serrated; and (d) dichotoma and trilocularis were very serrated. The B. rapa ssp. nipponsinica IT100406 characteristically had elongated leaves within the non‐serrated category.
Figure 2.
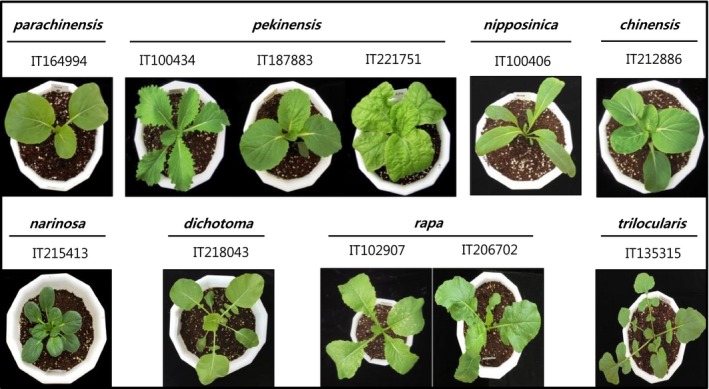
Phenotypes of eight subspecies of Brassica rapa used in the present study. Subspecies of each accession were extracted from the passport data of RDA Genebank. Genotypes for subspecies follow the nomenclature of Zhao et al. 45. Genotypes for subspecies were confirmed by a field test in 2011.
Twelve GSLs belonging to the aliphatic, indolic, and aromatic classes were detected in the 38 accessions (Table 1). The GSL contents of leaves of all 38 accessions were analyzed by HPLC (Table 3). Total GSL content ranged from 4.42 (pak choi, ssp. narinosa) to 59.56 μmol·g−1 dw (ssp. trilocularis). B. rapa ssp. rapa turnip types had intermediately serrated leaf edges and B. rapa ssp. dichotoma and trilocularis belonging to the oil types showed very serrated leaf shapes and were found to exhibit the highest mean total GSLs (ranging from 20.35 to 53.51 μmol·g−1 dw). By contrast, the lowest mean total GSLs (9.38 and 4.42 μmol·g−1 dw) were found in B. rapa ssp. chinensis and narinosa pak choi type that had an entire leaf edge phenotype. The 19 accessions of B. rapa ssp. pekinensis belonging to the Chinese cabbage type showed mean total GSLs of 12.75 μmol·g−1 dw, ranging from 5.41 to 48.17 μmol·g−1 dw. In the present study, we focused on the three main groups that distinguish morphotypes, such as B. rapa ssp. pekinensis (19) for Chinese cabbage type; B. rapa ssp. chinensis (five) for pak choi type; and B. rapa ssp. rapa (six) for turnip type (Fig. 3). A higher total GSL content (34.98 μmol·g−1 dw) and a higher aliphatic GSL content were found in B. rapa ssp. rapa compared to the other two subspecies (Fig. 3A). Aliphatic GSLs were found in high ratios in all three subspecies; in particular, B. rapa ssp. rapa exhibited a high aliphatic GSL ratio and a low ratio of indolic and aromatic GSLs compared to the other two subspecies (Fig. 3B). With regard to individual GSL ratios, gluconapin (GNA; aliphatic GSL) and glucobrassicin (GBS; indolic GSL) were detected at the highest levels in all three subspecies (Fig. 3C,D).
Table 3.
Total and individual GSL level (μmol·g‐−1 dw) in leaves of 38 accessions belonging to eight subspeices of Brassica rapa
| Genotype (subspecies) | Accession number | Aliphatic | Indolic | Aromatic | Total GSLs | |||||||||
|---|---|---|---|---|---|---|---|---|---|---|---|---|---|---|
| PRO | GRA | SNG | GAL | GNL | GNA | GCC | GBN | GBS | 4‐MOGBS | NGBS | GNT | |||
| Caixin (ssp. parachinensis) | ||||||||||||||
| Mean | 2 | 2.01 | 0.07 | 0.03 | 0.74 | 0.16 | 5.16 | 2.84 | 2.67 | 0.50 | 0.20 | 0.21 | 0.20 | 14.80 |
| Range | 1.10–2.93 | 0.02–0.13 | 0.01–0.05 | 0.58–0.89 | 0.11–0.17 | 1.56–8.77 | 0.00–5.67 | 1.48–3.86 | 0.50–0.51 | 0.13–0.28 | 0.13–0.29 | 0.15–0.25 | 5.99–23.6 | |
| Chinese cabbage (ssp. pekinensis) | ||||||||||||||
| Mean | 19 | 0.87 | 0.07 | 0.03 | 0.60 | 0.16 | 2.89 | 0.36 | 2.41 | 2.40 | 1.54 | 0.94 | 0.44 | 12.75 |
| Range | 0.13–2.59 | 0.00–0.33 | 0.00–0.10 | 0.00–2.45 | 0.00–0.63 | 0.02–28.02 | 0.00–2.27 | 0.12–11.28 | 0.50–4.08 | 0.60–3.36 | 0.07–2.47 | 0.02–1.30 | 5.41–48.17 | |
| Mizuna (ssp. nipposinica) | ||||||||||||||
| Mean | 1 | 0.20 | 0.69 | 0.03 | 0.58 | 0.00 | 25.56 | 0.46 | 2.39 | 2.34 | 0.51 | 0.47 | 0.15 | 33.38 |
| Pak choi (ssp. chinensis) | ||||||||||||||
| Mean | 5 | 0.37 | 0.03 | 0.04 | 0.23 | 0.04 | 3.21 | 0.14 | 1.93 | 1.02 | 0.55 | 0.28 | 0.35 | 9.38 |
| Range | 0.07–1.02 | 0.00–0.07 | 0.00–0.15 | 0.04–0.44 | 0.00–0.19 | 0.84–5.08 | 0.00–0.33 | 0.83–2.9 | 0.58–1.67 | 0.41–0.88 | 0.08–0.64 | 0.2–0.49 | 4.93–11.5 | |
| Pak choi (ssp. narinosa) | ||||||||||||||
| Mean | 1 | 0.37 | 0.00 | 0.00 | 0.11 | 0.12 | 0.89 | 0.00 | 0.89 | 0.77 | 0.43 | 0.52 | 0.25 | 4.42 |
| Summer oil (ssp. dichotoma) | ||||||||||||||
| Mean | 2 | 0.19 | 0.02 | 0.01 | 0.06 | 0.25 | 16.83 | 0.29 | 1.73 | 0.17 | 0.37 | 0.12 | 0.31 | 20.35 |
| Range | 0.05–0.34 | 0.00–0.03 | 0.00–0.02 | 0.04–0.07 | 0.00–0.49 | 0.33–33.34 | 0.13–0.45 | 1.09–2.37 | 0.10–0.24 | 0.23–0.51 | 0.09–0.15 | 0.26–0.37 | 4.72–35.98 | |
| Turnip (ssp. rapa) | ||||||||||||||
| Mean | 6 | 1.17 | 0.27 | 0.02 | 0.56 | 0.07 | 20.07 | 2.69 | 7.08 | 1.77 | 0.40 | 0.37 | 0.50 | 34.98 |
| Range | 0.20–2.36 | 0.00–0.65 | 0.00–0.03 | 0.15–1.47 | 0.00–0.2 | 5.83–35.05 | 0.00–12.84 | 0.74–14.93 | 1.38–2.02 | 0.32–0.57 | 0.11–0.73 | 0.15–0.68 | 11.20–49.95 | |
| Winter oil (ssp. trilocularis) | ||||||||||||||
| Mean | 2 | 2.65 | 0.00 | 0.06 | 0.00 | 0.00 | 45.68 | 0.01 | 3.24 | 0.56 | 0.30 | 0.45 | 0.56 | 53.51 |
| Range | 0.03–5.28 | 0.00 | 0.08–0.04 | 0.00 | 0.00 | 37.04–54.32 | 0.00–0.03 | 2.66–3.82 | 0.36–0.76 | 0.29–0.31 | 0.31–0.6 | 0.32–0.79 | 47.46–59.56 | |
The means indicate the average of subspecies with the average of triplicate measurements in three independent biological replicates.
The two genotypes of mizuna (ssp. nipposinica) and pak choi (ssp. narinosa) underwent analyses of GSL content in only one accession.
Figure 3.
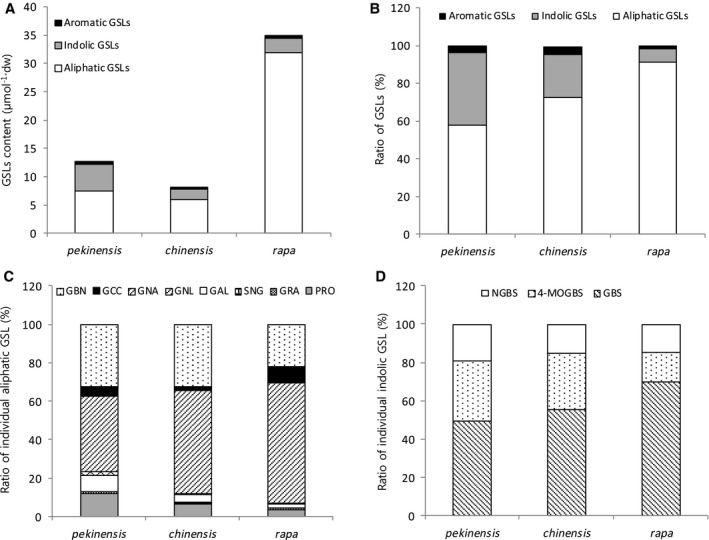
Identification of individual GSL composition in the three subspecies of Brassica rapa. (A) Content of aliphatic, indolic and aromatic GSLs comprising total GSL content for three subspecies. (B) Ratio of aliphatic, indolic and aromatic GSLs in total GSL content of three subspecies. (C) Ratio of individual GSL in aliphatic GSLs of three subspecies. (D) Ratio of individual GSL in indolic GSLs of three subspecies. GRA, glucoraphanin.
Expression profile of BrMYB TFs related to GSL biosynthesis in the 38 accessions
To investigate the regulatory control of GSL biosynthesis in B. rapa, the expression levels of the 13 BrMYB TFs were analyzed by real‐time PCR in all 38 accessions (Fig. 4). The relative expression was calculated as the fold increase relative to B. rapa ssp. narinosa (IT215413), which had the lowest total GSL content. The relative expression level of BrMYB29.1 was high and that of BrMYB122.2 was low in most of the accessions. Relative expression of BrMYB29.1, BrMYB34.3 and BrMYB34.4 was higher in B. rapa ssp. pekinensis, whereas BrMYB28.3 was lower in all but three accessions. In B. rapa ssp. chinensis, which has a low total GSL content, the relative expression of all three paralogs of BrMYB28 was low in all five accessions. In addition, in B. rapa ssp. rapa, which had a high total GSL content, the relative expression of BrMYB34.3 was higher in all six accessions, whereas that of BrMYB34.4 was higher in all accessions except IT102907 and, in addition, BrMYB51.1 was lower in all accessions except IT102907 (Fig. 4).
Figure 4.
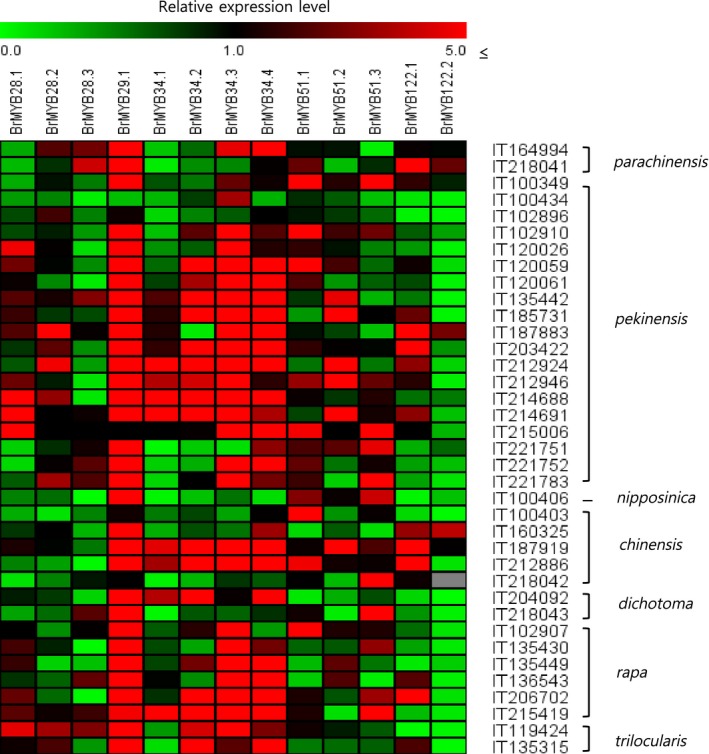
Relative expression analysis of BrMYB TFs related to GSL biosynthesis in 38 accessions of Brassica rapa. The Bractin gene was used as the quantitative control. Values indicated the average of three biological replicates. The relative expression was calculated as the fold increase relative to ssp. narinosa IT215413 with the lowest total GSL content.
Relationship between BrMYB TF expression and GSL content
We investigated the relationship between expression of the 13 BrMYB TFs and GSL content by correlation analyses in all 38 accessions (Table 4). BrMYB28.2 was found to be positively correlated with 4‐methoxyglucobrassicin (4‐MOGBS; P < 0.05), an indolic GSL, whereas BrMYB28.3 was significantly and positively correlated with the aliphatic GSLs progoitrin (PRO; P < 0.01) and glucocochlearin (GCC; P < 0.05). BrMYB51.1 was also positively correlated with total indolic GSLs (P < 0.01), GBS (P < 0.01) and neoglucobrassicin (NGBS; P < 0.05). BrMYB122.2 was significantly and positively correlated with SNG (P < 0.01), an aliphatic GSL, although low mRNA transcript levels were detected in most of the 38 accessions. The correlation of BrMYB TF expression and GSL content was also analyzed for individual subspecies (Tables S2, S3 and S4). As found for the analysis of all accessions, BrMYB28.3, BrMYB51.1 and BrMYB122.2 were positively correlated with GSL content in B. rapa ssp. pekinensis and chinensis (Tables S2 and S3). In addition, BrMYB51.3 was positively correlated with PRO and gluconapoleiferin (GNL; i.e. aliphatic GSLs) in B. rapa ssp. chinensis (Table S3). The indolic GSL 4‐MOGBS was positively correlated with various BrMYB TFs, including BrMYB29, BrMYB51.2 and two BrMYB34 paralogs in B. rapa ssp. chinensis. In B. rapa ssp. rapa, four BrMYB34 paralogs were found to be positively correlated with the aliphatic GSLs GCC, glucobrassicanapin (GBN) and glucoalyssin (GAL; Table S4). Taken together, these results indicate that the 13 BrMYB TFs function as positive regulators in different parts of the GSL biosynthesis pathway in B. rapa.
Table 4.
Correlation analysis of relative expression levels of BrMYB TFs related to GSL biosynthesis and GSL content in 38 accessions of Brassica rapa
| Gene | PRO | GRA | SNG | GAL | GNL | GNA | GCC | GBN | Aliphatic GSLs | GBS | 4‐MOGBS | NGBS | Indolic GSLs | GNT | Total GSLs |
|---|---|---|---|---|---|---|---|---|---|---|---|---|---|---|---|
| BrMYB28.1 | −0.066 | −0.102 | −0.122 | −0.034 | −0.128 | −0.098 | −0.046 | −0.120 | −0.124 | 0.025 | 0.214 | −0.103 | 0.051 | −0.072 | −0.122 |
| BrMYB28.2 | 0.158 | −0.215 | 0.166 | −0.238 | −0.052 | −0.046 | −0.073 | −0.158 | −0.083 | 0.173 | 0.341* | −0.065 | 0.194 | −0.025 | −0.057 |
| BrMYB28.3 | 0.470** | −0.207 | 0.112 | −0.012 | −0.005 | 0.073 | 0.384* | 0.288 | 0.203 | −0.234 | −0.210 | −0.252 | −0.271 | 0.110 | 0.175 |
| BrMYB29.1 | 0.030 | 0.210 | 0.049 | −0.022 | −0.136 | 0.119 | −0.120 | 0.152 | 0.120 | 0.043 | −0.036 | −0.154 | −0.037 | 0.149 | 0.122 |
| BrMYB34.1 | −0.050 | −0.050 | −0.125 | −0.219 | 0.143 | −0.228 | 0.241 | −0.008 | −0.175 | 0.132 | 0.158 | −0.013 | 0.122 | −0.077 | −0.166 |
| BrMYB34.2 | −0.088 | −0.145 | 0.026 | −0.191 | 0.065 | −0.166 | −0.063 | −0.170 | −0.200 | 0.011 | 0.049 | −0.065 | 0.004 | −0.199 | −0.209 |
| BrMYB34.3 | −0.192 | −0.216 | −0.070 | −0.193 | −0.131 | −0.281 | −0.173 | −0.112 | −0.312 | 0.214 | 0.151 | −0.090 | 0.138 | −0.203 | −0.305 |
| BrMYB34.4 | −0.062 | 0.097 | 0.016 | 0.204 | −0.147 | 0.278 | −0.029 | 0.217 | 0.283 | −0.122 | −0.118 | −0.051 | −0.121 | 0.104 | 0.277 |
| BrMYB51.1 | −0.156 | 0.080 | −0.182 | 0.139 | −0.186 | −0.203 | −0.075 | −0.196 | −0.233 | 0.446** | 0.255 | 0.378* | 0.434** | −0.066 | −0.185 |
| BrMYB51.2 | 0.038 | −0.011 | 0.129 | −0.020 | 0.205 | −0.129 | −0.080 | −0.097 | −0.139 | −0.175 | −0.051 | 0.154 | −0.063 | −0.135 | −0.152 |
| BrMYB51.3 | −0.156 | −0.105 | −0.178 | −0.118 | −0.170 | 0.028 | 0.135 | −0.132 | −0.002 | −0.025 | 0.150 | −0.199 | −0.017 | −0.099 | −0.006 |
| BrMYB122.1 | −0.169 | −0.113 | 0.082 | −0.178 | −0.188 | −0.049 | −0.080 | −0.037 | −0.081 | −0.107 | −0.082 | −0.103 | −0.115 | 0.013 | −0.097 |
| BrMYB122.2 | −0.064 | −0.107 | 0.585** | −0.105 | −0.191 | −0.184 | 0.065 | −0.159 | −0.192 | −0.114 | −0.058 | −0.170 | −0.130 | −0.148 | −0.213 |
Significantly correlated: *P < 0.05, **P < 0.01, respectively.
Expression profile of BrMYB TFs in different developmental stages
Expressed sequence tag (ESTs) were identified for all BrMYB TFs except the BrMYB122s in the Brassica database (http://nabic.rda.go.kr; Table 2). Expression profiles of these 11 BrMYB TFs were analyzed in different developmental stages of B. rapa using a microarray database 25 (Fig. 5). Two of the TFs, BrMYB28.3 and BrMYB34.4, were not expressed, despite the presence of two ESTs extracted from the database: KFFB‐103G11 and KBLS‐091A11. Expression of the nine remaining BrMYB TFs was observed in most developmental stages. BrMYB28.2, BrMYB34.2 and BrMYB51.2 exhibited higher expression in vegetative stages (BLCS2D–BLCC0D) compared to reproductive stages (BLCA1D–BLCA3W), whereas BrMYB28.1, BrMYB34.3 and BrMYB51.3 were more highly expressed during the reproductive stages. BrMYB34.3 was expressed at higher levels than the other BrMYB TFs in various developmental stages, with a maximum expression level of 71 days in a whole plant (BLCA1D). These results indicate that expression of the BrMYB TF paralogs occurred in different patterns and at different levels depending on the plant developmental (life history) stage.
Figure 5.
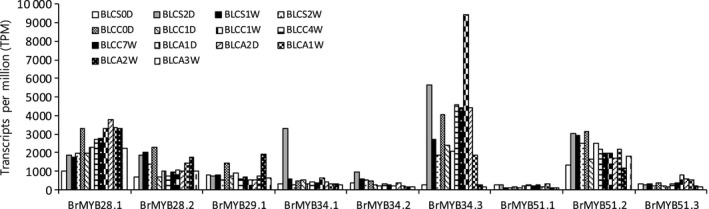
Expression analysis of nine BrMYB TFs related to GSL biosynthesis at different developmental stages in Brassica rapa. BLCS0D, seeds, mature; BLCS2D, seedling (2 days old); BLCS1W, whole plant, 1 week old vegetative stage (7 days old); BLCS2W, whole plant, 2 weeks old vegetative stage (14 days old); BLCC0D, whole plant, 3 weeks old vegetative stage (21 days old); BLCC1D, whole plant, 1 day after light‐chilled at 4 °C (22 days old); BLCC1W, whole plant, 1 week after light‐chilled at 4 °C (28 days old); BLCC4W, whole plant, 4 weeks after light‐chilled at 4 °C (56 days old); BLCC7W, whole plant, 7 weeks after light‐chilled at 4 °C (70 days old); BLCA1D, whole plant, 1 day after greenhouse growth (71 days old); BLCA2D, whole plant, 2 days after green house growth (72 days old); BLCA1W, whole plant, 1 week after green house growth (77 days old; BLCA2W, whole plant, 2 weeks after greenhouse growth (84 days old); BLCA3W, whole plant, 3 weeks after greenhouse growth (91 days old). LCS, vegetative stage; LCC, chilling treatment (vernalization); LCA, growth stage after chilling treatment (reproductive stage).
Expression profiles of BrMYB TFs under abiotic stresses
The effects of four abiotic stress treatments, namely cold, drought, salt and ABA, on the expression of BrMYB TFs were analyzed (Fig. 6). A cold stress treatment of 4 °C caused an initial decrease in the expression of BrMYB28.1 but a subsequent increase by 24 h. Expression of BrMYB28.2 and of BrMYB34.3 increased under cold stress and was higher than the control at 0.5 and 3 h, respectively. BrMYB51.2 expression increased until 3 h after treatment, although it decreased thereafter. Under drought stress conditions, expression of BrMYB28.1,2 and BrMYB29.1 significantly increased until 12 h of treatment, and gradually decreased thereafter. Expression BrMYB34.3 and BrMYB51.3 increased to 36 h, plateaued, and then decreased at 48 h. BrMYB28.1 and BrMYB28.2 exhibited identical responses, with an increased expression from 12 to 48 h under salt stress conditions. BrMYB34.3 showed a higher expression level compared to the control during the salt stress treatment. After ABA treatment, expression of BrMYB34.1 and BrMYB51.3 increased compared to the control. After ABA stress, expression of BrMYB28.1 and BrMYB29.1 increased at 3 h post‐treatment. The variation in expression patterns observed for the nine BrMYB TFs related to GSL biosynthesis during the four abiotic stress treatments reflects their potential as regulators (effectors) for abiotic stress resistance. In particular, the increased expression of BrMYB28s and BrMYB34.3 in the different stress treatments highlights the importance of these TFs in plant stress responses.
Figure 6.
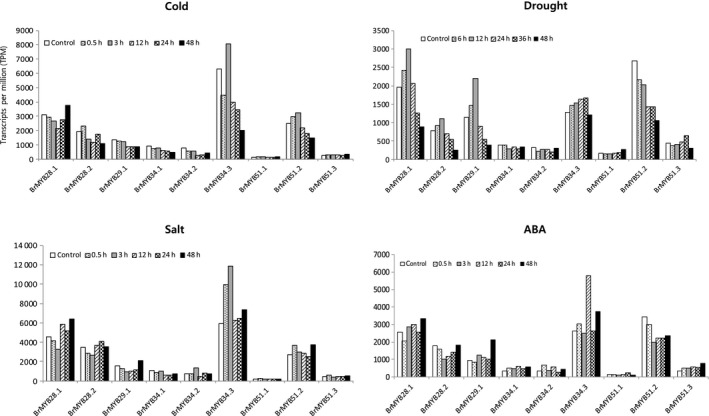
Microarray expression analysis at different abiotic stresses of nine BrMYB TFs related to GSL biosynthesis of Brassica rapa. Control, 3‐week‐old whole plant; cold, 4 °C cold treatment; drought, air‐dry; salt, 250 mm NaCl; ABA, 100 μm abscisic acid.
Expression profile of BrMYB TFs under two biotic stresses
We also analyzed changes in expression level of nine BrMYB TFs under two biotic stress conditions (Fig. 7). BrMYB28.1,2, BrMYB34.1 and BrMYB51.2 showed increased expression in roots of 28‐day‐old plants infected with P. brassicae, which causes clubroot disease in Brassica (Fig. 7A). Expression of BrMYB34.3 was significantly increased at 38 and 55 days after infection. After infection with P. carotovorum, which causes soft rot disease in Brassica, all three BrMYB51 paralogs exhibited significantly increased expression (Fig. 7B). These results suggest that some BrMYB TFs may potentially regulate resistance to biotic stress, including infection responses.
Figure 7.
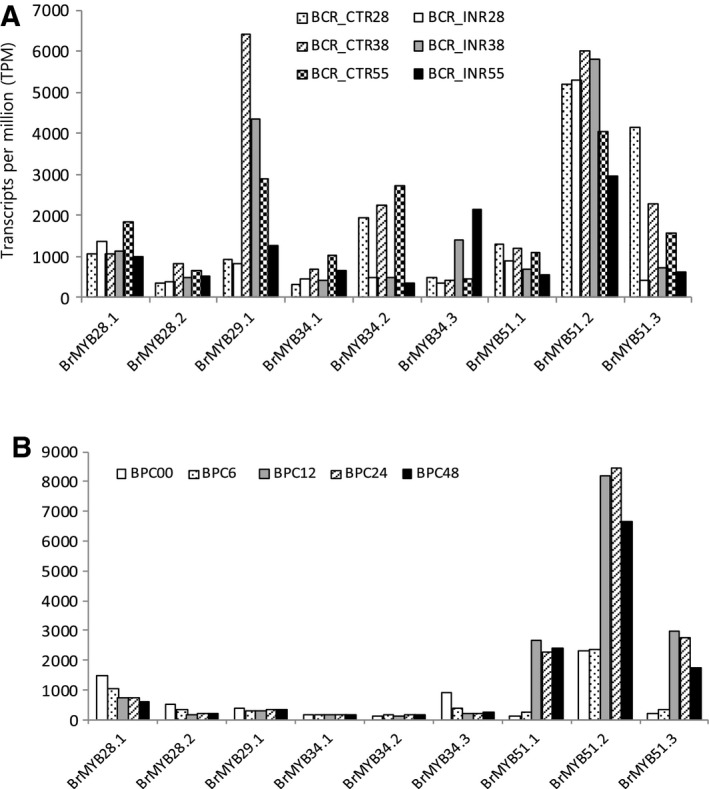
Microarray analysis of effects of two biotic stresses on the expression of nine BrMYB TFs related to GSL biosynthesis in Brassica rapa. (A) Expression changes after infection with Plasmodiophora brassicae (BCR_CTR28, non‐infected 28‐day‐old roots; BCR_INR28, 28‐day‐old roots infected by P. brassicae; BCR_CTR38, non‐infected 38‐day‐old roots; BCR_INR38, infected 38‐day‐old roots; BCR_CTR55, non‐infected 55‐day‐old roots; BCR_INR55, infected 55‐day‐old roots). (B) Expression changes after infection of Pectobacterium carotovorum (BPC00, non‐infected reference, leaf, one‐third upper part from the top; BPC6–48, 6–48 h post infection, non‐necrotic).
Discussion
MYB TFs are one of the largest gene families of plant TFs and are known to perform many functions in plant biological processes 28, 29. MYB TFs are classified by a conserved DNA‐DBD, which contains R1, R2 or R3 repeats; most plant MYB TFs are classified as R2R3‐MYB with two repeats in the N‐terminal region 30. R2R3 MYB TFs regulate plant responses to several signaling molecules 31. In the present study, all 13 BrMYB TFs were found to have highly conserved aa sequences in the R2 and R3 repeats of the DBD. However, polymorphisms within the C‐terminal region between paralogous genes led to structural divergence. Furthermore, the chromosomal locations of the paralogous genes differed. These results indicate that the polyploid evolution of the Brassica genome led to sequence divergence, such as indels that produced rearrangement of the BrMYB TFs related to GSL biosynthesis. Sequence divergence and chromosomal translocation of the triplicate paralogous genes has been reported in many Brassica species 32, 33, 34. Consequently, the duplication of genes by polyploidy speciation in Brassica species has led to functional diversity among the different species 35.
In the present study, we investigated the patterns of expression of 13 BrMYB TFs related to GSL content in eight subspecies of B. rapa. Twelve GSLs belonging to three chemical classes were detected in the 38 accessions of B. rapa. The total GSL contents of B. rapa ssp. parachinensis, chinensis and narinosa, which have leaf morphologies classified as entire, were found to be low. The B. rapa ssp. dichotoma and rapa, which have intermediately serrated leaves, were found to have a higher total GSL content than subspecies with entire or slightly serrated leaf edges. The highest total GSL content was found in B. rapa ssp. trilocularis, which has a very serrated leaf shape. Thus, we suggest that the morphogenesis of leaf edge shape may be regulated by the GSL biosynthesis pathway.
In the GSL profiles of different accessions, aliphatic GSLs were found to be most abundant, and GNA was the most abundant GSL recorded. Previous studies have reported the same GSL pattern in leaves 22, 36. These results indicate that the GSL content profiles in these 38 accessions are representative of B. rapa in general. Most research on the GSL content of Brassica genus has focused on differences among cultivars or the effects of environmental factors 18, 37, 38. The varieties were significantly different for total GSL content as well because, for all the individual GSLs, content in B. rapa varieties was dependent upon the crops and genotype 20. In the present study, significant differences in GSL content were identified in three main genotypes, including pekinensis of the Chinese cabbage type, chinensis of the pak choi type and rapa of the turnip type. Turnip type accessions were found to have the highest GSL contents, with increased aliphatic GSLs. The content of aliphatic GSLs is influenced by genetic and morphological variation in B. rapa. Therefore, indolic GSLs are influenced by environmental factors, whereas they are less affected by genetic factors than aliphatic GSLs 17.
Paralogous genes showed different expression patterns among accessions with the same ancestral gene. These results indicate that gene duplication through genome polyploidy in B. rapa has led to functional diversity and alteration of expression patterns, as reflected by genotype‐specific variation. BrMYB28.3, BrMYB51.1 and BrMYB122.2 were identified as positive regulators of GSL content in B. rapa ssp. pekinensis and chinensis. In the case of B. rapa ssp. rapa with drastically increased aliphatic GSLs, the four paralogous genes of BrMYB34 and BrMYB28.3 showed positive correlations with aliphatic GSLs. The distinct correlation patterns of B. rapa ssp. rapa might be explained by the individual GSL content. Some R2R3 MYB TFs were recently shown to regulate GSL biosynthesis in Arabidopsis, with MYB28 as a positive regulator of aliphatic GSLs, and MYB34, MYB51 and MYB122 as positive regulators of indolic GSLs 12, 13, 14. Similarly, we found that the BrMYB28.3 was positively correlated with the aliphatic GSLs (PRO and GCC) and BrMYB51.1 was also positively correlated with total indolic GSLs and individual indolic GSLs (GBS and NGBS) in 38 accessions (Table 4). However, some TFs, such as BrMYB28.2 for indolic GSL 4‐MOGBS and BrMYB122.2 for aliphatic GSL SNG, showed contrasting regulatory responses. The differences in the regulation of BrMYB TFs between B. rapa and A. thaliana suggest that different mechanisms may operate in the genotype‐specific GSL biosynthesis pathway of B. rapa. GSL concentrations can be influenced by various factors, such as genotype differences, pre‐harvest conditions, cultural practices, stage of maturity and harvesting methods, as well as the interactions among these factors 20. This finding indicates that changes in genotype‐specific expression within BrMYB TFs are potentially correlated with phenotypic effects in polyploid B. rapa. Phenotypic effects of duplicated genes in polyploids have been reported previously for genes involved in regulating flowering time in Arabidopsis allotetraploids 39. Additionally, organ‐specific expression changes in duplicated genes have been demonstrated in the allopolyploid Gossypium hirsutum and Brassica juncea 40, 41. Thus, the divergence of paralogous genes may result in a functional alteration during the evolution of flowering plants.
Correlation analysis of the relative expression levels of BrMYB TFs related to GSL biosynthesis and GSL content in 38 accessions of B. rapa showed insufficient correlation with the content of both total and 12 identified GSLs. MYB TFs are known to be regulators of GSL biosynthesis genes, such as AOP2, GSL‐OH and ST5, etc. 12, 15, 41. Such an insufficient correlation between the expression level of BrMYB TFs and the content of total and aliphatic GSLs suggested the possibility that variation in the expression levels of GSL biosynthesis genes might lead to the changes in GSL content. Therefore, accurate observation of the expression levels of various GSL biosynthesis genes in 38 accessions will be required to determine the GSL content change by the expression network of the GSL biosynthesis genes involved with the 13 BrMYB TFs. Furthermore, functional studies are required to confirm that these BrMYB TFs are key regulators for GSLs biosynthesis in B. rapa.
Glucosinolates are known plant defense compounds in the Brassicaceae family 42. Transcript levels for some genes related to indolic and aliphatic GSL biosynthesis have been shown to increase resistance to various stresses, such as pathogens, insects, bacteria and herbivory in Arabidopsis 21, 43, 44. In the present study, all nine BrMYB TFs related to GSL biosynthesis showed increased expression levels in various stress treatments. The present study highlights the strong potential of these nine BrMYB TFs as regulators for various stress mechanisms. A functional approach to expression analysis of the BrMYB TFs and stress treatments on accessions with various GSL contents will help clarify the role of BrMYB TFs or GSLs for stress resistance mechanisms in B. rapa.
The present study improves our understanding of 13 BrMYB TFs duplicated by polyploid evolution in B. rapa. Our findings reveal that several BrMYB TFs are important for GSL biosynthesis and stress resistance mechanisms in B. rapa. Furthermore, the 38 Brassica accessions provide genetic diversity (through gene expression variation) and phenotypic diversity (in GSL content) for molecular breeding strategies in B. rapa and related species.
Author contributions
JSK and MSS wrote the manuscript and carried out the experimental analysis. MJ and SHS were responsible for plant husbandry in the greenhouse and for the analysis of the traits of the 38 accessions.
Supporting information
Table S1. List of primers used for real‐time PCR.
Table S2. Correlation analysis of expression level of BrMYB TFs related to GSL biosynthesis and GSL content in 19 accessions of Brassica rapa ssp. pekinensis.
Table S3. Correlation analysis of expression level of BrMYB TFs related to GSL biosynthesis and GSL content in five accessions of Brassica rapa ssp. chinensis.
Table S4. Correlation analysis of expression level of BrMYB TFs related to GSL biosynthesis and GSL content in six accessions of Brassica rapa ssp. rapa.
Acknowledgements
This work was supported by a grant from the National Academy of Agricultural Science (PJ008673 and PJ010157), Rural Development of Administration, Korea.
References
- 1. Hayes JD, Kelleher MO and Eggleston IM (2008) The cancer chemopreventive actions of phytochemicals derived from GSLs. Eur J Nutr 47, 73–88. [DOI] [PubMed] [Google Scholar]
- 2. Mun JH, Kwon SJ, Seol YJ, Kim J, Jin M, Kim JS, Lim MH, Lee SI, Hong JK, Park TH et al (2010) Sequence and structure of Brassica rapa chromosome A3. Genome Biol 11, R94. [DOI] [PMC free article] [PubMed] [Google Scholar]
- 3. Wang X, Wang H, Wang J, Sun R, Wu J, Liu S, Bai Y, Mun JH, Bancroft I, Cheng F et al (2011) The genome of the mesopolyploid crop species Brassica rapa . Nat Genet 43, 1035–1157. [DOI] [PubMed] [Google Scholar]
- 4. Mun JH, Yu HJ, Shin JY, Oh MJ, Hwang HJ and Chung H (2012) Auxin response factor gene family in Brassica rapa: genomic organization, divergence, expression, and evolution. Mol Genet Genomics 287, 765–784. [DOI] [PMC free article] [PubMed] [Google Scholar]
- 5. Zang YX, Kim HU, Kim JA, Lim MH, Jin M, Lee SC, Kwon SJ, Lee SI, Hong JK, Park TH et al (2009) Genome‐wide identification of glucosinolate synthesis genes in Brassica rapa . FEBS J 276, 3559–3574. [DOI] [PubMed] [Google Scholar]
- 6. Wang H, Wu J, Sun S, Liu B, Cheng F, Sun R and Wang X (2011) Glucosinolate biosynthetic genes in Brassica rapa . Gene 487, 135–142. [DOI] [PubMed] [Google Scholar]
- 7. Liu X, Lu Y, Yan M, Sun D, Hu X, Liu X, Chen S, Guan C and Liu Z (2016) Genome‐wide identification, localization, and expression analysis of proanthocyanidin‐associated genes in Brassica . Front Plant Sci 7, 1831. [DOI] [PMC free article] [PubMed] [Google Scholar]
- 8. Sawada Y, Toyooka K, Kuwahara A, Sakata A, Nagano M, Saito K and Hirai MY (2009) Arabidopsis bile acid: sodium symporter family protein 5 is involved in methionine‐derived glucosinolate biosynthesis. Plant Cell Physiol 5, 1579–1586. [DOI] [PMC free article] [PubMed] [Google Scholar]
- 9. Yonekura‐Sakakibara K and Saito K (2009) Functional genomics for plant natural product biosynthesis. Nat Prod Rep 26, 1466–1487. [DOI] [PubMed] [Google Scholar]
- 10. Kliebenstein DJ, Kroymann J, Brown P, Figuth A, Pedersen D, Gershenzon J and Mitchell‐Olds T (2001) Genetic control of natural variation in Arabidopsis glucosinolate accumulation. Plant Physiol 126, 811–825. [DOI] [PMC free article] [PubMed] [Google Scholar]
- 11. Skirycz A, Reichelt M, Burow M, Birkemeyer C, Rolcik J, Kopka J, Zanor MI, Gershenzon J, Strnad M, Szopa J et al (2006) DOF transcription factor AtDof1.1(OBP2) is part of a regulatory network controlling glucosinolate biosynthesis in Arabidopsis . Plant J 47, 10–24. [DOI] [PubMed] [Google Scholar]
- 12. Sønderby IE, Burow M, Rowe HC, Kliebenstein DJ and Halkier BA (2010) A complex interplay of three R2R3 MYB transcription factors determines the profile of aliphatic GSLs in Arabidopsis . Plant Physiol 153, 348–363. [DOI] [PMC free article] [PubMed] [Google Scholar]
- 13. Hirai MY, Sugiyama K, Sawada Y, Tohge T, Obayashi T, Suzuki A, Araki R, Sakurai N, Suzuki H, Aoki K et al (2007) Omics‐based identification of Arabidopsis Myb transcription factors regulating aliphatic glucosinolate biosynthesis. PNAS 104, 6478–6483. [DOI] [PMC free article] [PubMed] [Google Scholar]
- 14. Gigolashvili T, Engqvist M, Yatusevich R, Muller C and Flugge UI (2007) The transcription factor HIG1/MYB51 regulates indolic glucosinolate biosynthesis in Arabidopsis thaliana . Plant J 50, 886–901. [DOI] [PubMed] [Google Scholar]
- 15. Seo MS, Jin M, Chun JH, Kim SJ, Park BS, Shon SH and Kim JS (2016) Functional analysis of three BrMYB28 transcription factors controlling the biosynthesis of glucosinolates in Brassica rapa . Plant Mol Biol 90, 503–516. [DOI] [PMC free article] [PubMed] [Google Scholar]
- 16. Kushad MM, Brown AF, Kurilich AC, Juvik JA, Klein BK, Walig MA and Jeffery EH (1999) Variation of glucosinolates in vegetable subspecies of Brassica oleracea . J Agric Food Chem 47, 1541–1548. [DOI] [PubMed] [Google Scholar]
- 17. Kim SJ, Kawaguchi S and Watanabe Y (2003) Glucosinolates in vegetative tissues and seeds of 12 cultivars of vegetable turnip rape (Brassica rapa L.). Soil Sci Plant Nutr 49, 337–346. [Google Scholar]
- 18. Francisco M, Cartea ME, Soengas P and Velasco P (2011) Effect of genotype and environmental conditions on health‐promoting compounds in Brassica rapa . J Agric Food Chem 59, 2421–2431. [DOI] [PubMed] [Google Scholar]
- 19. Padilla G, Cartea ME, Rodríguez VM and Ordás A (2005) Genetic diversity in a germplasm collection of Brassica rapa subsp. rapa L. from northwestern Spain. Euphytica 145, 171–180. [Google Scholar]
- 20. Cartea ME, Haro AD, Obregón S, Soengas P and Velasco P (2012) Glucosinolate variation in leaves of Brassica rapa crops. Plant Foods Hum Nutr 67, 283–288. [DOI] [PubMed] [Google Scholar]
- 21. Yang B and Quiros CF (2010) Survey of glucosinolate variation in leaves of Brassica rapa crops. Genet Resour Crop Evol 57, 1079–1089. [Google Scholar]
- 22. Kim JK, Chu SM, Kim SJ, Lee DJ, Lee SY, Lim SH, Ha SH, Kweon SJ and Cho HS (2010) Variation of glucosinolate in vegetable crops of Brassica rapa L. spp. pekinensis . Food Chem 119, 423–428. [Google Scholar]
- 23. Mikkelsen MD, Petersen BL, Glawischnig E, Jensen AB, Andreasson E and Halkier BA (2003) Modulation of CYP79 genes and glucosinolate profile in Arabidopsis by defense signaling pathways. Plant Physiol 131, 298–308. [DOI] [PMC free article] [PubMed] [Google Scholar]
- 24. Mewis I, Tokuhisa JG, Schultz JC, Appel HM, Ulrichs C and Gershenzon J (2006) Gene expression and glucosinolate accumulation in Arabidopsis thaliana in response to generalist and specialist herbivores of different feeding guilds and the role of defense signaling pathways. Phytochemistry 67, 2450–2462. [DOI] [PubMed] [Google Scholar]
- 25. Lee SC, Lim MH, Kim JA, Lee SI, Kim JS, Jin M, Kwon SJ, Mun JH, Kim YK, Hur Y et al (2008) Transcriptome analysis in Brassica rapa under the abiotic stresses using Brassica 24K oligo microarray. Mol Cells 26, 595–605. [PubMed] [Google Scholar]
- 26. Kim SJ, Kawaharada C, Jin S, Hashimoto M, Ishii G and Yamauchi H (2007) Structural elucidation of 4‐(Cystein‐S‐yl) butyl glucosinolate from the leaves of Eruca sativa . Biosci Biotechnol Biochem 71, 114–121. [DOI] [PubMed] [Google Scholar]
- 27. Lou P, Zhao J, Kim JS, Shen S, Carpio DPD, Song X, Jin M, Vreugdenhil D, Wang X, Koornneef M et al (2007) Quantitative trait loci for flowering time and morphological traits in multiple populations of Brassica rapa . J Exp Bot 14, 4005–4016. [DOI] [PubMed] [Google Scholar]
- 28. Dias AP, Braun EL, McMullen MD and Grotewold E (2003) Recently duplicated maize R2R3 myb genes provide evidence for distinct mechanisms of evolutionary divergence after duplication. Plant Physiol 131, 610–620. [DOI] [PMC free article] [PubMed] [Google Scholar]
- 29. Du H, Feng BR, Yang SS, Huang YB and Tang YX (2012) The R2R3‐MYB transcription factor gene family in maize. PLoS ONE 7, e37463. [DOI] [PMC free article] [PubMed] [Google Scholar]
- 30. Matus JT, Aquea F and Arce‐Johnson P (2008) Analysis of the grape MYB R2R3 subfamily reveals expanded wine quality‐related clades and conserved gene structure organization across Vitis and Arabidopsis genomes. BMC Plant Biol 8, 83. [DOI] [PMC free article] [PubMed] [Google Scholar]
- 31. Romero I, Fuertes A, Benito MJ, Malpica JM, Leyva A and Paz‐Ares J (1998) More than 80 R2R3‐MYB regulatory genes in the genome of Arabidopsis thaliana . Plant J 14, 273–284. [DOI] [PubMed] [Google Scholar]
- 32. Parkin IAP, Sharpe AG and Lydiate DJ (2003) Patterns of genome duplication within the Brassica napus genome. Genome 46, 291–303. [DOI] [PubMed] [Google Scholar]
- 33. Town CD, Cheung F, Maiti R, Crabtree J, Haas BJ, Wortman JR, Hine EE, Althoff R, Arbogast TS and Tallon LJ (2006) Comparative genomics of Brassica oleracea and Arabidopsis thaliana reveal gene loss, fragmentation, and dispersal after polyploidy. Plant Cell 18, 1348–1359. [DOI] [PMC free article] [PubMed] [Google Scholar]
- 34. Yang TJ, Kim JS, Kwon SJ, Lim KB, Choi BS, Kim JA, Jin M, Park JY, Lim MH, Kim HI et al (2006) Sequence‐level analysis of the diploidization process in the triplicated FLOWERING LOCUS C region of Brassica rapa . Plant Cell 18, 1339–1347. [DOI] [PMC free article] [PubMed] [Google Scholar]
- 35. Taylor JS and Raes J (2004) Duplication and divergence: the evolution of new genes and old ideas. Annu Rev Genet 38, 15–43. [DOI] [PubMed] [Google Scholar]
- 36. Padilla G, Cartea ME, Velasco P, Haro AD and Ordás A (2007) Variation of glucosinolates in vegetable crops of Brassica rapa . Phytochemistry 68, 536–545. [DOI] [PubMed] [Google Scholar]
- 37. Charron CS, Saxton AM and Carl ES (2005) Relationship of climate and genotype to seasonal variation in the glucosinolate‐myrosinase system I. glucosinolate content in ten cultivars of Brassica oleracea grown in fall and spring seasons. J Sci Food Agric 85, 671–681. [Google Scholar]
- 38. Hong EY, Kim SJ and Kim GH (2011) Identification and quantitative determination of glucosinolates in seeds and edible parts of Korean Chinese cabbage. Food Chem 128, 1115–1120. [Google Scholar]
- 39. Wang J, Tian L, Lee HS, Wei NE, Jiang H, Watson B, Madlung A, Osborn TC, Doerge RW, Comai L et al (2006) Genomewide nonadditive gene regulation in Arabidopsis allotetraploids. Genetics 172, 507–517. [DOI] [PMC free article] [PubMed] [Google Scholar]
- 40. Adams KI, Cronn R, Percifield R and Wendel JF (2003) Genes duplicated by polyploidy show unequal contributions to the transcriptome and organ‐specific reciprocal silencing. PNAS 100, 4649–4654. [DOI] [PMC free article] [PubMed] [Google Scholar]
- 41. Augustine R, Majee M, Gershenzon J and Bisht NC (2013) Four genes encoding MYB28, a major transcriptional regulator of the aliphatic glucosinolate pathway, are differentially expressed in the allopolyploid Brassica juncea . J Exp Bot 64, 4907–4921. [DOI] [PMC free article] [PubMed] [Google Scholar]
- 42. Halkier BA and Gershenzon J (2006) Biology and biochemistry of glucosinolates. Ann Rev Plant Biol 57, 303–333. [DOI] [PubMed] [Google Scholar]
- 43. Giamoustaris A and Mithen R (1995) The effect of modifying the glucosinolate content of oilseed rape (Brassica napus ssp. oleifera) on its interaction with specialist and generalist pests. Ann App Biol 126, 347–363. [Google Scholar]
- 44. Tierens KFM, Thomma BPHJ, Brouwer M, Schmidt J, Kistner AP, Mauch‐Mani B, Cammue BPA and Broekaert WF (2001) Study of the role of antimicrobial glucosinolate‐derived isothiocyanates in resistance of Arabidopsis to microbial pathogens. Plant Physiol 125, 1688–1699. [DOI] [PMC free article] [PubMed] [Google Scholar]
- 45. Zhao J, Wang X, Deng B, Lou P, Wu J, Xu Z, Vromans J, Koornneef M and Bonnema G (2005) Genetic relationships within Brassica rapa as inferred from AFLP fingerprints. Ther Appl Genet 110, 1301–1314. [DOI] [PubMed] [Google Scholar]
Associated Data
This section collects any data citations, data availability statements, or supplementary materials included in this article.
Supplementary Materials
Table S1. List of primers used for real‐time PCR.
Table S2. Correlation analysis of expression level of BrMYB TFs related to GSL biosynthesis and GSL content in 19 accessions of Brassica rapa ssp. pekinensis.
Table S3. Correlation analysis of expression level of BrMYB TFs related to GSL biosynthesis and GSL content in five accessions of Brassica rapa ssp. chinensis.
Table S4. Correlation analysis of expression level of BrMYB TFs related to GSL biosynthesis and GSL content in six accessions of Brassica rapa ssp. rapa.