Abstract
Hepatocellular carcinoma (HCC) that is graded histologically as poorly differentiated has a high recurrence, metastasis and poor prognosis. We sought to determine the regulatory mechanisms of HCC tumorigenesis and to identify molecules closely related to poorly differentiated HCC. High‐throughput sequencing was used to construct microRNA (miRNA) and mRNA expression profiles for poorly differentiated HCC tissues and adjacent tissues. Network analysis was carried out to study miRNA–target interactions. Integrating the miRNA and mRNA data of HCC with four tumor grades from The Cancer Genome Atlas (TCGA) portal enabled the identification of potential closely related molecules for early diagnosis of poorly differentiated HCC. Electronic validation of RNA‐seq data and survival analysis was also performed. In total, 1051 differentially expressed genes and 165 differentially expressed miRNAs were identified between HCC tumor and paired non‐tumorous tissue. Based on 3718 miRNA–target interactions, we established an miRNA–target interaction network; the target genes were mainly involved in bile acid biosynthesis and bile secretion. Integrating expression data of HCC from TCGA indicated that two proteins, TM4SF1 and ANXA2, are convincing indicators for initial diagnosis of poorly differentiated HCC. According to the survival analysis, three proteins, ANXA2, C8orf33 and IGF2BP3, were identified as being associated with the survival time of HCC patients. Moreover, we suggest that hsa‐miR‐1180 may be an effective biomarker for poorly differentiated HCC. Three molecules, TM4SF1, ANXA2 and C8orf33, are potential biomarkers for distinguishing poorly differentiated from well‐differentiated HCC.
Keywords: hepatocellular carcinoma, poorly differentiated hepatocellular carcinoma, tumor grades
Abbreviations
- DEG
differentially expressed gene
- FC
fold change
- GO
Gene Ontology
- HBV
hepatitis B virus
- HCC
hepatocellular carcinoma
- KEGG
Kyoto Encyclopedia of Genes and Genomes
- TCGA
The Cancer Genome Atlas
Hepatocellular carcinoma (HCC) is the most frequent type of primary liver cancer; it arises from hepatocytes and leads to a high worldwide mortality 1. The hepatitis B virus (HBV) is the main risk factor associated with HCC, especially in developing countries such as those in Southeast Asia and sub‐Saharan Africa 2. HCC patients are always diagnosed at an advanced stage and miss out on potentially curative options. Although there have been some advances in HCC's diagnosis and therapy, its prognosis has not improved considerably because of a high recurrence rate 3.
The histological types and grades of HCC can be identified by histopathological examination of liver tissues, and there are usually four tumor grades: G1–G4 4. To some extent, the histological grading can estimate tumor malignancy and the differentiation level, which corresponds successively to well‐differentiated, moderately differentiated, poorly differentiated and undifferentiated HCC cells. Specifically, HCC with a poor differentiation level represents greater malignancy of the tissue, which is related to higher recurrence, metastasis and poorer prognosis 5, 6. Therefore, poor differentiation can be an indicator of poor outcome in patients with HCC. It is important to diagnose the poorly differentiated HCC early, which would provide a significant benefit in treatment options and improve the prognosis.
In the current study, the miRNA and mRNA expression profiles of poorly differentiated HCC were created using high‐throughput sequencing, and the miRNA–target interaction regulatory network was constructed. Then, we integrated the miRNA and mRNA data of HCC with four tumor grades (G1–G4) downloaded from The Cancer Genome Atlas (TCGA) portal to identify the stable closely related molecules. Additionally, electronic validation of RNA‐seq data and survival analysis were further performed, which was helpful in identifying key molecules in poorly differentiated HCC.
Materials and methods
Sample preparation
Three patients were enrolled in this study, and were diagnosed as HCC by imaging and pathology. All patients showed poor histological differentiation and hepatitis B infection. Their HCC tumors and matched adjacent non‐tumor control tissues were surgically resected. Informed consent was obtained from each patient and the project was approved by the Second Hospital of Dalian Medical University (no. 2017.19). The completed clinical data were obtained, and the clinical and pathological features of the three HCC patients are shown in Table 1.
Table 1.
Clinical information of three HCC patients used for RNA‐seq. G3, Grade 3; T, tumor; C, control
| No. | Sex | Age (years) | TNM stage | HBV infection | Liver cirrhosis | Hepatic fibrosis | Tumor dimensions (cm) | Histological differentiation | Clean reads (mRNA) | Clean reads (miRNA) |
|---|---|---|---|---|---|---|---|---|---|---|
| 1 | Male | 51 | T4N0M0 | Yes | Yes | Yes | 6 × 6 × 7 | Poor (G3) |
53 687 294 (T) 35 515 948 (C) |
6 441 04 (T) 9 463 257 (C) |
| 2 | Male | 48 | T2N0M0 | Yes | Yes | Yes | 1.8 × 1.2 × 0.8 | Poor (G3) |
35 030 210 (T) 36 547 530 (C) |
10 870 504 (T) 11 983 159 (C) |
| 3 | Male | 41 | T1N0M0 | Yes | Yes | Yes | 4 × 2.5 × 2.3 | Poor (G3) |
33 114 380 (T) 31 351 198 (C) |
9 306 568 (T) 10 700 324 (C) |
RNA extraction and RNA‐seq
Total RNA was isolated from the tumor and control tissues using Trizol reagent (Invitrogen, Carlsbad, CA, USA) according to the manufacturer's protocols. The RNA quality and quantity were verified with a NanoDrop 1000 Spectrophotometer (NanoDrop Technologies, Wilmington, DE, USA) and an Agilent 2100 Bioanalyzer (Agilent Technologies, Santa Clara, CA, USA). An mRNA library was constructed using polyA selection using a TruSeq RNA Library Preparation Kit (Illumina, San Diego, CA, USA) and a small RNA library was constructed with the TruSeq Small RNA Sample Prep Kit (Illumina). Using the Hiseq2500/Miseq platform, mRNA and miRNA libraries were sequenced as 100 bp pair‐ends and 50 bp single‐end reads, respectively. We obtained the high quality reads after removing contaminating and low quality reads.
Identification of differentially expressed genes and miRNAs
The RNA‐seq data were used to discover differentially expressed genes (DEGs) and miRNAs. Firstly, the processed reads were mapped to the human reference genome hg19 by the tophat program version 2.0.8 using the default parameters 7, 8. According to the mapped reads, DEGs were identified using the cuffdiff tool in the cufflinks program (http://cole-trapnell-lab.github.io/cufflinks/cuffdiff/index.html). Moreover, the degseq package in R was used to determine differentially expressed miRNAs. P < 0.001 and |log fold change (FC)| > 2 were used as the cut‐off criteria.
Integrative miRNA–mRNA analysis
Differentially expressed miRNA and gene data from matched samples were further integrated. A given miRNA is usually negatively correlated with the expression of its targets. Therefore firstly, miRNA–mRNA pairs that were inversely correlated in expression levels were screened. Then, we extracted the extant miRNA–target relationship by validation or prediction in rna22, miranda, mirdb, mirwalk, pictar2 and targetscan, and the miRNA–target pairs recorded by > 4 algorithms were reserved. A search for inverse correlations between differentially expressed miRNAs and mRNAs was conducted to obtain the miRNA–target pairs for HCC. Furthermore, miRNA–target pairs were subjected to construct the HCC‐specific miRNA–target interaction network, which was visualized using cytoscape 9.
Pathway analysis of miRNA–targets
We used the web‐based david 10 to discover the biological functional interpretation of the miRNA–targets and address the enriched and redundant relationships among many genes in many terms. The listed target genes can be mapped to associated Gene Ontology (GO) terms 11. Similarly, the target genes were also assigned Kyoto Encyclopedia of Genes and Genomes (KEGG) terms 12 and an enrichment analysis was also carried out.
MRNA and miRNA expression data for HCC from TCGA
To identify the stable miRNA and mRNA biomarker for poorly differentiated HCC, the mRNA and miRNA expression data for patients with HCC were downloaded from the TCGA data portal (http://tcga.cancer.gov; January 2016). Only the patients with hepatitis B infection were included. Of the 73 patients, 5 were well differentiated (Grade 1, G1), 27 were moderately differentiated (Grade 2, G2), 34 were poorly differentiated (Grade 3, G3) and 7 were undifferentiated (Grade 4, G4). Sample IDs are listed in Table 2.
Table 2.
Patient IDs in TCGA. G, grade
| Grade | Sample IDs |
|---|---|
| G1, well differentiated | TCGA‐DD‐AAE4, TCGA‐DD‐AAVP, TCGA‐G3‐AAV4, TCGA‐XR‐A8TF, TCGA‐ZP‐A9CZ |
| G2, moderately differentiated | TCGA‐CC‐A9FU, TCGA‐DD‐A1EA, TCGA‐DD‐A1EI, TCGA‐DD‐AAC9, TCGA‐DD‐AACC, TCGA‐DD‐AACK, TCGA‐DD‐AACT, TCGA‐DD‐AAD0, TCGA‐DD‐AAD2, TCGA‐DD‐AADY, TCGA‐DD‐AAEI, TCGA‐DD‐AAVQ, TCGA‐DD‐AAVR, TCGA‐DD‐AAVS, TCGA‐DD‐AAVU, TCGA‐DD‐AAVW, TCGA‐DD‐AAVX, TCGA‐DD‐AAVZ, TCGA‐DD‐AAW0, TCGA‐G3‐A25Z, TCGA‐G3‐A3CH, TCGA‐G3‐A3CK, TCGA‐G3‐AAV0, TCGA‐G3‐AAV7, TCGA‐QA‐A7B7, TCGA‐RC‐A7SB, TCGA‐UB‐A7ME |
| G3, poorly differentiated | TCGA‐BC‐A10W, TCGA‐BW‐A5NP, TCGA‐DD‐A116, TCGA‐DD‐A119, TCGA‐DD‐A1EH, TCGA‐DD‐A1EL, TCGA‐DD‐AAC8, TCGA‐DD‐AACA, TCGA‐DD‐AACB, TCGA‐DD‐AACE, TCGA‐DD‐AACH, TCGA‐DD‐AACN, TCGA‐DD‐AACO, TCGA‐DD‐AACQ, TCGA‐DD‐AACS, TCGA‐DD‐AACU, TCGA‐DD‐AACY, TCGA‐DD‐AAD6, TCGA‐DD‐AADA, TCGA‐DD‐AADC, TCGA‐DD‐AADI, TCGA‐DD‐AADK, TCGA‐DD‐AADP, TCGA‐DD‐AADW, TCGA‐DD‐AAE1, TCGA‐DD‐AAE2, TCGA‐DD‐AAEK, TCGA‐DD‐AAVV, TCGA‐G3‐A25U, TCGA‐G3‐A25X, TCGA‐G3‐A25Y, TCGA‐G3‐AAV1, TCGA‐RC‐A7S9, TCGA‐RC‐A7SH |
| G4, undifferentiated | TCGA‐DD‐AACD, TCGA‐DD‐AACG, TCGA‐DD‐AADB, TCGA‐DD‐AADD, TCGA‐DD‐AADF, TCGA‐DD‐AAE0, TCGA‐DD‐AAEE |
After principal component analysis, we removed the genes and miRNAs that were outliers, and 13 141 genes and 259 miRNAs were used for subsequent study. Genes and miRNAs associated with tumor grade were further identified by a P‐value of < 0.05 using the linear by linear association test. Moreover, we used an ANOVA and Tukey's honest significant difference to detect the significant differences across the groups and false positives, and the different averages across the experimental groups were evaluated. Genes and miRNAs were regarded as DEGs and miRNAs with P < 0.05. In order to validate the expression of RNA sequencing data, especially those DEGs and miRNAs between G3 and other groups of HCC, we performed an electronic validation in the TCGA dataset. The selected differential genes were SLC6A13, APOA5, TOP2A, IGF2BP3, NDRG2, CYP4A11, CTH, KIAA1522, TM4SF1 and ANXA2. hsa‐mir‐942, hsa‐mir‐769, hsa‐mir‐1180, hsa‐mir‐1301, hsa‐mir‐483, hsa‐mir‐210 and hsa‐mir‐18a were validated as differentially expressed miRNAs.
Survivability analysis in HCC
Survivability is an important prognostic indicator in the development of HCC. In order to analyze the survival time of HCC patients, we evaluated the correlation of HCC survival with the expression of overlapped DEGs between RNA sequencing and the TCGA dataset by using the online software cbioportal for Cancer Genomics (http://www.cbioportal.org/).
Results
Overview of the RNA‐seq data
To discriminate HCC from non‐tumorous tissue, we selected three cases of HCC patients who showed poor histological differentiation and hepatitis B infection. After sequencing of miRNA and mRNA libraries and filtering of raw RNA‐seq reads, high quality clean reads were obtained (Table 1). Differential expression analysis was performed in normal–cancerous paired tissue samples. Using the criteria of P < 0.001 and |log FC| > 2, 1051 DEGs were identified between the HCC tumor and the paired non‐tumorous tissue, including 492 up‐regulated genes and 559 down‐regulated genes. Moreover, 165 differentially expressed miRNAs were identified, including 157 up‐regulated miRNAs and 8 down‐regulated miRNAs. The clustering map of the top 100 DEGs is shown in Fig. 1.
Figure 1.
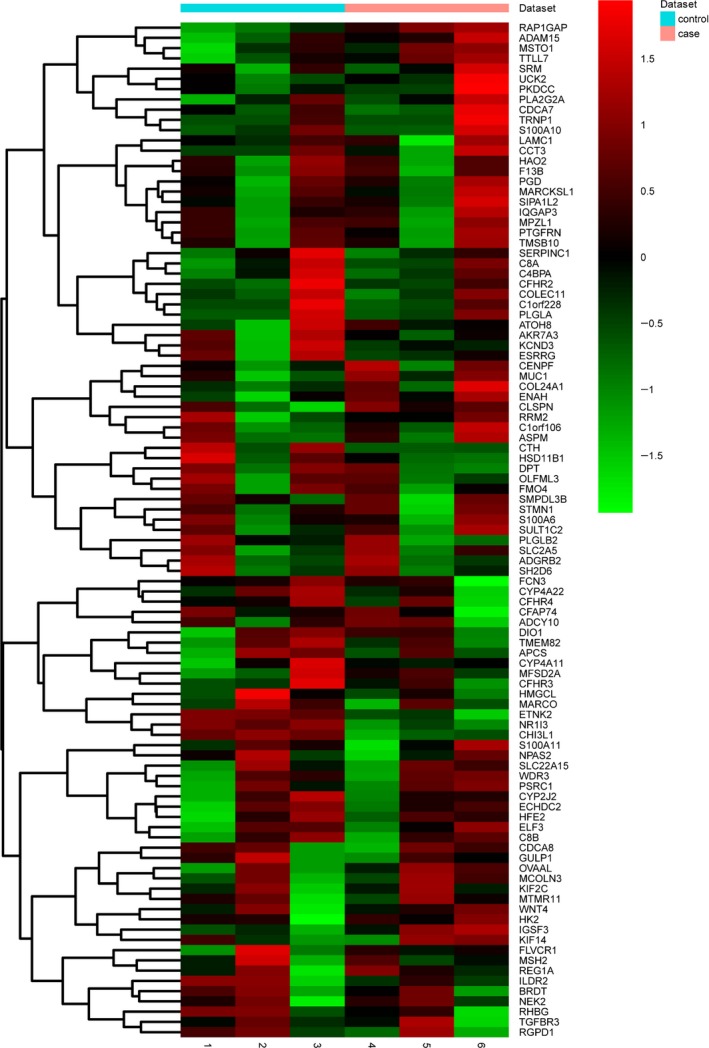
Clustering map of the top 100 DEGs in RNA‐seq. The diagram presents the result of a two‐way hierarchical clustering of 100 DEGs and samples. The clustering was constructed using the complete‐linkage method together with Euclidean distance. Each row represents a DEG and each column a sample. The DEG clustering tree is shown on the right. The color scale illustrates the relative level of DEG expression: red, below the reference channel; green, higher than the reference.
MiRNA–target regulatory network analysis
Considering that miRNA can post‐transcriptionally regulate the expression of target genes, we firstly selected inverse correlation pairs of differentially expressed miRNAs and mRNAs. After that, miRNA target genes were further identified using six miRNA target computational prediction methods. This yielded 3718 miRNA–target interactions between 159 differentially expressed miRNAs and 429 genes. The top 10 miRNAs with highest degree values were miR‐940 (degree = 53), hsa‐miR‐942‐5p (degree = 52), hsa‐miR‐519d‐3p (degree = 50), hsa‐miR‐520c‐3p (degree = 50), hsa‐miR‐520 g‐3p (degree = 50), hsa‐miR‐512‐3p (degree = 49), hsa‐miR‐520b (degree = 49), hsa‐miR‐520d‐3p (degree = 46), hsa‐miR‐526b‐3p (degree = 45) and hsa‐miR‐520e (degree = 44). The global miRNA–target interactions network was constructed (Fig. 2).
Figure 2.
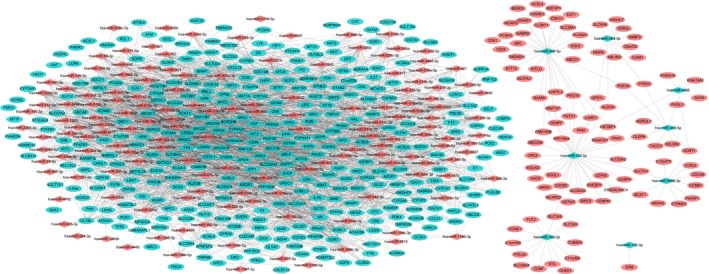
The miRNA–target interaction network for HCC. The red and green colors represent relatively high and low expression, respectively.
Pathways analysis of miRNA targets
Functional enrichment analysis of miRNA targets showed that these were significantly enriched in the GO terms digestion, bile acid metabolic process, lipid metabolic process and liver development. Moreover, KEGG pathway enrichment analysis revealed that the miRNA targets were significantly associated with primary bile acid biosynthesis, bile secretion, fat digestion and absorption, and fatty acid metabolism (Table 3).
Table 3.
GO and KEGG pathway enrichment of miRNA targets in poorly differentiated HCC. FDR, false discovery rate
| GO ID | Item | No. | FDR | |
|---|---|---|---|---|
| GO enrichment | GO:0006631 | Fatty acid metabolic process | 20 | 8.71 × 10⁻¹³ |
| GO:0008206 | Bile acid metabolic process | 14 | 1.68 × 10⁻¹¹ | |
| GO:0006629 | Lipid metabolic process | 31 | 2.46 × 10⁻¹¹ | |
| GO:0006699 | Bile acid biosynthetic process | 11 | 1.08 × 10⁻¹⁰ | |
| GO:0007586 | Digestion | 12 | 9.67 × 10⁻⁷ | |
| GO:0015721 | Bile acid and bile salt transport | 7 | 2.38 × 10⁻⁶ | |
| GO:0001889 | Liver development | 11 | 1.13 × 10⁻⁴ | |
| GO:0030573 | Bile acid catabolic process | 3 | 5.07 × 10⁻⁴ | |
| Pathway enrichment | hsa04110 | Cell cycle | 28 | 1.11 × 10⁻¹⁶ |
| hsa03320 | PPAR signaling pathway | 19 | 3.83 × 10⁻¹³ | |
| hsa00071 | Fatty acid metabolism | 15 | 1.45 × 10⁻¹² | |
| hsa00120 | Primary bile acid biosynthesis | 9 | 7.61 × 10⁻¹⁰ | |
| hsa04976 | Bile secretion | 14 | 3.56 × 10⁻⁸ | |
| hsa04920 | Adipocytokine signaling pathway | 9 | 2.59 × 10⁻⁴ | |
| hsa04115 | p53 signaling pathway | 9 | 2.59 × 10⁻⁴ | |
| hsa05200 | Pathways in cancer | 21 | 4.8 × 10⁻⁴ | |
| hsa04975 | Fat digestion and absorption | 6 | 2.537 × 10⁻³ | |
| hsa04010 | MAPK signaling pathway | 14 | 2.0704 × 10⁻² |
DEGs associated with poorly differentiated HCC
Using mRNA expression data for HCC with various grades of differentiation from the TCGA, differential expression analysis was performed to identify critical genes that can distinguish poorly differentiated HCC from others. A linear association test found that 577 genes were associated with tumor grade of HCC. Of these 577 genes, 51 were differentially expressed in the G3 vs G1 group, 18 were differentially expressed in the G3 vs G2 group, and 22 were differentially expressed in the G3 vs G4 group. Hierarchical clustering analysis indicated that the DEGs in the G3 group can be significantly distinguished from the G1 group (Fig. 3).
Figure 3.
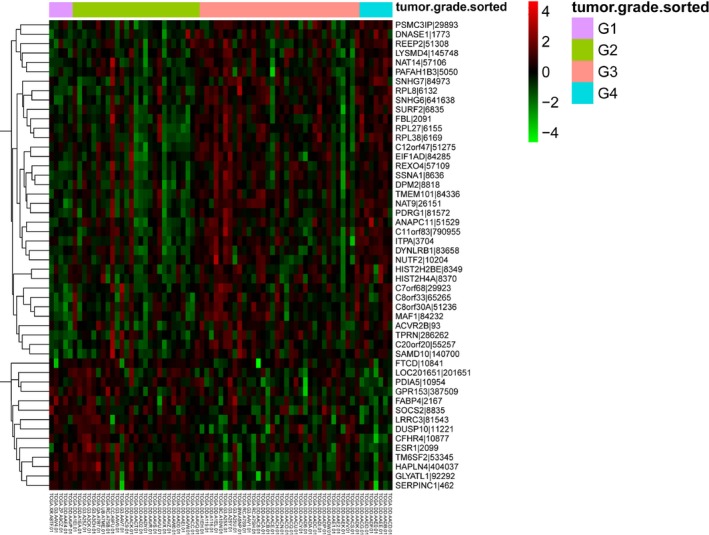
Hierarchical clustering heat map of the top 50 genes associated with tumor grade of HCC. G, grade. The hierarchical clustering analysis indicated that the DEGs in the G3 group can be significantly distinguished from the G1 group.
To find a stable biomarker for poorly differentiated HCC, the above DEGs were overlapped with DEGs from our sequencing data. This yielded 88 genes associated with tumor grade, in which seven DEGs (C8orf33, TSNAXIP1, TM4SF1, CTH, ANXA2, KIAA1522 and LRRC1) can distinguish HCC of G3 from G1, two DEGs (CYB5A and RRAGD) can distinguish HCC of G3 from G2, and two DEGs (CFHR4 and F13B) can distinguish HCC of G3 from G4 (Fig. 4). Additionally, electronic validation of several genes (SLC6A13, APOA5, TOP2A, IGF2BP3, NDRG2, CYP4A11, CTH, KIAA1522, TM4SF1 and ANXA2) that were differentially expressed between G3 and other grades in the RNA sequencing are shown in Fig. 5. All these genes can distinguish G3 from other groups of HCC, which was consistent with the RNA sequencing result.
Figure 4.
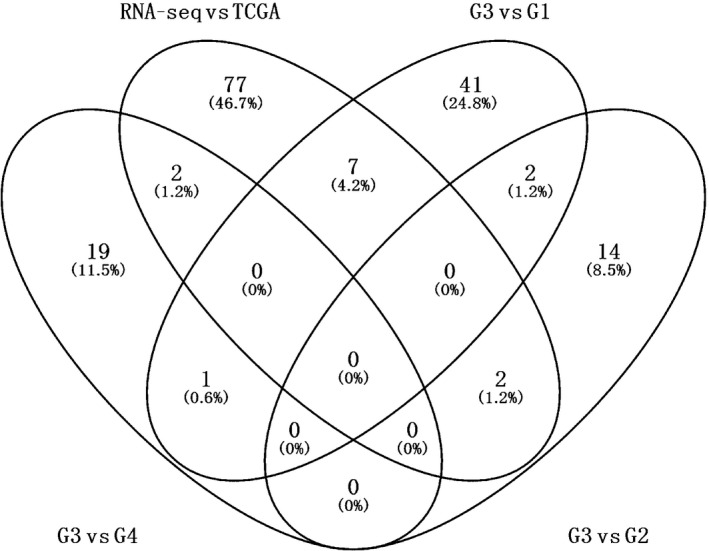
Venn diagrams of DEGs in HCC. G, grade. G3 vs G1: DEGs between G3 and G1; G3 vs G2: DEGs between G3 and G2. G3 vs G4: DEGs between G3 and G4. RNA‐seq vs TCGA: overlap of DEGs from RNA‐seq and tumor grade‐related genes from TCGA.
Figure 5.
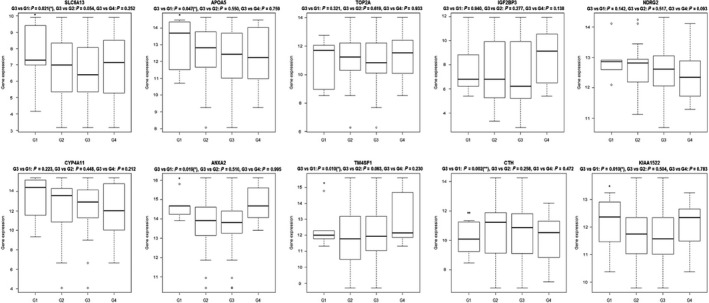
Validated gene expression box plots in the TCGA dataset.
Differentially expressed miRNAs associated with poorly differentiated HCC
Using miRNA expression data for HCC with various grades of differentiation from the TCGA, differential expression analysis was performed to identify the critical miRNAs that can distinguish poorly differentiated HCC from others. A linear association test found that 20 miRNAs were associated with tumor grade of HCC, of which there were six miRNAs (hsa‐miR‐103‐1, hsa‐miR‐103‐2, hsa‐miR‐1180, hsa‐miR‐151, hsa‐miR‐30b and hsa‐miR‐30d) differentially expressed in the G3 vs G1 group, hsa‐miR‐3074 differentially expressed in the G3 vs G2 group, and no miRNA differentially expressed in the G3 vs G4 group.
To find a stable biomarker for poorly differentiated HCC, the above miRNAs were overlapped with miRNAs differentially expressed from our sequencing data. This yielded three miRNAs (hsa‐miR‐210, hsa‐miR‐1180 and hsa‐miR‐18a) associated with tumor grade, in which hsa‐miR‐1180 can distinguish HCC with G3 from G1. Furthermore, electronic validation of several miRNAs (hsa‐mir‐942, hsa‐mir‐769, hsa‐mir‐1180, hsa‐mir‐1301, hsa‐mir‐483, hsa‐mir‐210 and hsa‐mir‐18a) that were differentially expressed between G3 and the other grades in the RNA sequencing is shown in Fig. 6. All these miRNAs can distinguish G3 from the other HCC groups, which was consistent with the RNA sequencing result.
Figure 6.
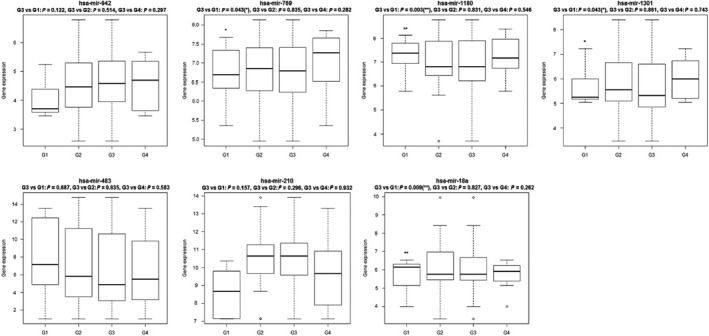
Validated miRNA expression box plots in the TCGA dataset.
Survivability analysis
In this study, four overlapped DEGs (ANXA2, C8orf33, TM4SF1 and IGF2BP3) between RNA sequencing and the TCGA dataset were selected for survival analysis in HCC. According to the results of the survival analysis, the expression of ANXA2 (P = 0.00923), C8orf33 (P = 0.04) and IGF2BP3 (P = 0.00313) was significantly correlated with overall survival time of HCC patients (Fig. 7A–C). However, the expression of TM4SF1 was not remarkably associated with overall survival time of HCC patients (Fig. 7D).
Figure 7.
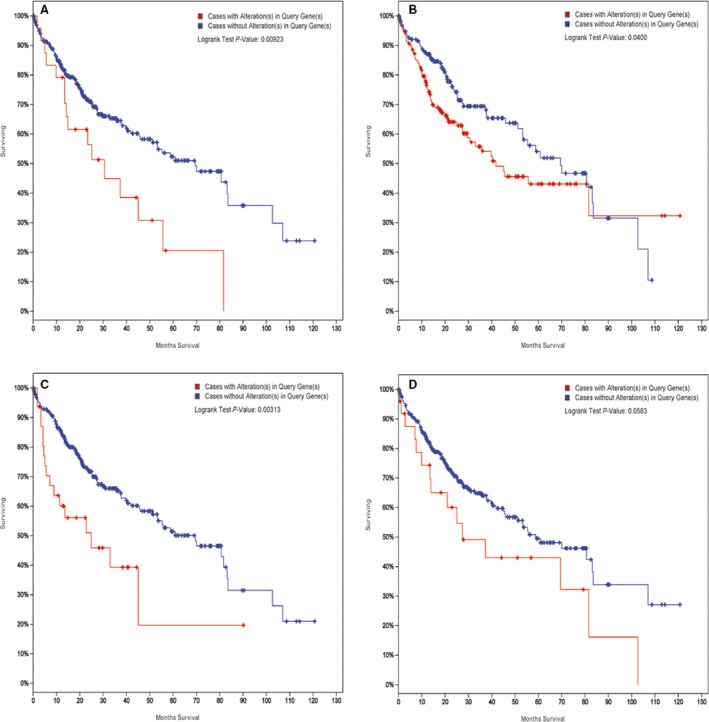
Survival analysis of ANXA2 (A), C8orf33 (B), TM4SF1 (C) and IGF2BP3 (D) in HCC.
Discussion
The prognosis for HCC remains poor, which probably results from late diagnosis, metastasis and recurrence 13. Specifically, compared with other histopathological grades of HCC, the poorly differentiated HCC represents greater malignancy of the tissues, leading to a poor outcome after hepatectomy of patients with HCC 3, 5. To better understand the characteristics of the poorly differentiated HCC, we used RNA‐seq to create miRNA and mRNA expression profiles for HCC and non‐tumorous tissue. This yielded 1051 DEGs (559 up‐regulated and 492 down‐regulated) and 165 differentially expressed miRNA (157 up‐regulated and 8 down‐regulated). An miRNA–target regulatory network was then constructed, which contained 3718 miRNA–target interactions. Pathway analysis indicated that miRNA targets were mainly involved in digestion, bile secretion and liver development.
Tumor grades are commonly estimated by histopathological investigation and represent tumor malignancies. Generally, high‐grade tumors or poorly differentiated tissues have a poor prognosis and low survival rate. Due to similar characteristics of tumors with different degrees of differentiation, diagnosing poorly differentiated HCC tumors is critical. To identify an indicator for tumor grade of HCC, especially the poorly differentiated HCC, we downloaded the miRNA and mRNA data of HCC from the TCGA portal and found that 577 genes were linearly correlated with tumor grade of HCC.
TM4SF1, a member of the transmembrane 4 superfamily, is characterized by four hydrophobic and transmembrane domains 14. Several TM4SF proteins have a strong association with cell motility and are associated with cancer invasion and metastasis 15. Previous study indicated that transfection and over‐expression of TM4SF1 in HeLa cells had no impact on tumor cell proliferation but rather enhanced the migration ability of HeLa cells and contributed to the metastatic phenotype 16. Using cDNA microarrays, Huang et al. 17 found that the expression of TM4SF1 was significantly increased in HBV‐related HCC tissues over the adjacent non‐cancerous tissues. We found that TM4SF1 was up‐regulated in HBV‐related HCC tumor tissues. Moreover, the expression of TM4SF1 was positively associated with tumor grade and it can distinguish HCC with G3 from G1. However, we found that it was not remarkably associated with the overall survival time of HCC patients. Anyway, we suggest that TM4SF1 may be a molecule closely related to HCC malignancy, especially to the poorly differentiated HCC.
ANXA2 is a calcium‐dependent phospholipid binding protein that is also involved in cell differentiation 18. ANXA2 was frequently increased in HCC tissues and the expression of ANXA2 was significantly correlated with differentiation degree and metastasis phenotype of HCC 19. Shi et al. 20 suggested that ANXA2 plays a role in the malignant behavior of HCC cells by remodeling cell motility‐associated structures. Immunohistology experiments have also indicated that ANXA2 is correlated with the histological grade of HCC, and ANXA2 staining was more intense in poorly differentiated tissues than well‐differentiated tissues 21. Our results showed that ANXA2 was up‐regulated in HCC tissues and its expression was positively associated with tumor grade and could distinguish G3 from G1 of HCC. Moreover, survival analysis showed that the expression of ANXA2 was closely associated with the survival time of HCC. Emerging data suggest that ANXA2 may be a molecule closely related to HCC that can distinguish poorly differentiated from well‐differentiated HCC and may be a prognosis factor in the development of HCC.
It should be pointed out that the expression of C8orf33 was disordered in HCC samples compared with normal liver samples 22. In this study, we found that C8orf33 was down‐regulated in HCC and could distinguish G3 from G1 of HCC. Furthermore, the survival analysis showed that the expression of C8orf33 was closely related to the survival time of HCC patients. Our results suggested that C8orf33 is an important differentiation‐related molecules in the process of HCC and could be regarded as a crucial factor in the prognosis of HCC. In addition, it was reported that aberrant up‐regulation of LRRC1 contributes to human HCC 23. The nuclear membrane proteome of HCC showed that CYB5A protein was down‐regulated and played a role in oncogenesis of HCC 24. Our finding showed that up‐regulation of LRRC1 and down‐regulation of CYB5A were associated with tumor grade. Further studies are needed to explore the role of LRRC1 in the differentiation degree of HCC.
It is well known that miRNAs play important roles in cancer development and progression of HCC. In our study, we found three miRNAs that were associated with tumor grade of HCC, namely hsa‐miR‐210, hsa‐miR‐1180 and hsa‐miR‐18a. One of them, hsa‐miR‐1180, caught our attention. Our sequencing data indicated that hsa‐miR‐1180 was up‐regulated in HCC. Moreover, hsa‐miR‐1180 was positively associated with tumor grade and distinguished HCC of G3 from G1. Previous studies have indicated that has‐miR‐1180 was significantly increased in HCC tissues and cells, and promoted cell proliferation of HCC by targeting TNIP2 25, 26. Here, we make the first suggestion that hsa‐miR‐1180 may be an effective biomarker for poorly differentiated HCC.
In addition, we also performed electronic validation of several miRNAs (hsa‐mir‐30d, hsa‐mir‐151, hsa‐mir‐103‐1, hsa‐mir‐942, hsa‐mir‐769, hsa‐mir‐1180, hsa‐mir‐1301, hsa‐mir‐483, hsa‐mir‐210 and hsa‐mir‐18a) and genes (SLC6A13, APOA5, TOP2A, IGF2BP3, NDRG2, CYP4A11, CTH, KIAA1522, TM4SF1 and ANXA2) in the TCGA dataset. All these miRNAs and genes were differentially expressed between G3 and other grades, which was consistent with the RNA sequencing. It is noted that IGF2BP3 was significantly associated with survival time of HCC patients, which further demonstrated the prognostic role of IGF2BP3 in patients with HCC.
Conclusions
Taken together, we constructed the miRNA and mRNA expression profiles of poorly differentiated HCC by high‐throughput sequencing. Further integrating expression data of HCC with different degree of differentiation from TCGA led to the discovery that TM4SF1 and ANXA2 are closely related molecules for distinguishing poorly differentiated HCC from well‐differentiated HCC. Furthermore, ANXA2, C8orf33 and IGF2BP3 were demonstrated to be associated with the survival time of HCC patients, which suggested that they could be considered as prognosis factors for HCC.
Author contributions
LW and RF analyzed and interpreted the data. PS and DS were major contributors in writing the manuscript. ZG designed the project. All authors read and approved the final manuscript.
Acknowledgements
This study was funded by the Key Disciplines Construction Program of The Second Hospital of Dalian Medical University (Grant/Award Number: 201602226).
Contributor Information
Rong Fan, Email: fanrongdl@126.com.
Zhenming Gao, Email: zhenming_gao1@163.com.
References
- 1. Okuda K (1997) Hepatocellular carcinoma: clinicopathological aspects. J Gastroenterol Hepatol 12, S314–S318. [DOI] [PubMed] [Google Scholar]
- 2. Ferlay J, Shin HR, Bray F, Forman D, Mathers C and Parkin DM (2010) Estimates of worldwide burden of cancer in 2008: GLOBOCAN 2008. Int J Cancer 127, 2893–2917. [DOI] [PubMed] [Google Scholar]
- 3. Guo W, Zhao S, Yang Y and Shao G (2015) Histological grade of hepatocellular carcinoma predicted by quantitative diffusion‐weighted imaging. Int J Clin Exp Med 8, 4164–4169. [PMC free article] [PubMed] [Google Scholar]
- 4. Atupelage C, Nagahashi H, Kimura F, Yamaguchi M, Tokiya A, Hashiguchi A and Sakamoto M (2014) Computational hepatocellular carcinoma tumor grading based on cell nuclei classification. J Med Imaging 1, 034501. [DOI] [PMC free article] [PubMed] [Google Scholar]
- 5. Ng IO, Lai EC, Fan ST, Ng MM and So MK (1995) Prognostic significance of pathologic features of hepatocellular carcinoma. A multivariate analysis of 278 patients. Cancer 76, 2443–2448. [DOI] [PubMed] [Google Scholar]
- 6. Regimbeau JM, Abdalla EK, Vauthey JN, Lauwers GY, Durand F, Nagorney DM, Ikai I, Yamaoka Y and Belghiti J (2004) Risk factors for early death due to recurrence after liver resection for hepatocellular carcinoma: results of a multicenter study. J Surg Oncol 85, 36–41. [DOI] [PubMed] [Google Scholar]
- 7. Trapnell C, Roberts A, Goff L, Pertea G, Kim D, Kelley DR, Pimentel H, Salzberg SL, Rinn JL and Pachter L (2012) Differential gene and transcript expression analysis of RNA‐seq experiments with TopHat and Cufflinks. Nat Protoc 7, 562–578. [DOI] [PMC free article] [PubMed] [Google Scholar]
- 8. Kukurba KR and Montgomery SB (2015) RNA sequencing and analysis. Cold Spring Harb Protoc 2015, 951–969. [DOI] [PMC free article] [PubMed] [Google Scholar]
- 9. Smoot ME, Ono K, Ruscheinski J, Wang PL and Ideker T (2011) Cytoscape 2.8: new features for data integration and network visualization. Bioinformatics 27, 431–432. [DOI] [PMC free article] [PubMed] [Google Scholar]
- 10. Dennis G Jr, Sherman BT, Hosack DA, Yang J, Gao W, Lane HC and Lempicki RA (2003) DAVID: database for annotation, visualization, and integrated discovery. Genome Biol 4, P3. [PubMed] [Google Scholar]
- 11. Ashburner M, Ball CA, Blake JA, Botstein D, Butler H, Cherry JM, Davis AP, Dolinski K, Dwight SS, Eppig JT et al (2000) Gene ontology: tool for the unification of biology. The Gene Ontology Consortium. Nat Genet 25, 25–29. [DOI] [PMC free article] [PubMed] [Google Scholar]
- 12. Kanehisa M and Goto S (2000) KEGG: kyoto encyclopedia of genes and genomes. Nucleic Acids Res 28, 27–30. [DOI] [PMC free article] [PubMed] [Google Scholar]
- 13. Villanueva A, Minguez B, Forner A, Reig M and Llovet JM (2010) Hepatocellular carcinoma: novel molecular approaches for diagnosis, prognosis, and therapy. Annu Rev Med 61, 317–328. [DOI] [PMC free article] [PubMed] [Google Scholar]
- 14. Hasegawa H, Watanabe H, Nomura T, Utsunomiya Y, Yanagisawa K and Fujita S (1997) Molecular cloning and expression of mouse homologue of SFA‐1/PETA‐3 (CD151), a member of the transmembrane 4 superfamily. Biochim Biophys Acta 1353, 125–130. [DOI] [PubMed] [Google Scholar]
- 15. Kao YR, Shih JY, Wen WC, Ko YP, Chen BM, Chan YL, Chu YW, Yang PC, Wu CW and Roffler SR (2003) Tumor‐associated antigen L6 and the invasion of human lung cancer cells. Clin Cancer Res 9, 2807–2816. [PubMed] [Google Scholar]
- 16. Testa JE, Brooks PC, Lin JM and Quigley JP (1999) Eukaryotic expression cloning with an antimetastatic monoclonal antibody identifies a tetraspanin (PETA‐3/CD151) as an effector of human tumor cell migration and metastasis. Cancer Res 59, 3812–3820. [PubMed] [Google Scholar]
- 17. Huang YK, Fan XG, Qiu F and Wang ZM (2011) Genomics of hepatitis B virus‐related hepatocellular carcinoma and adjacent noncancerous tissues with cDNA microarray. Chinese Med J 124, 2057–2064. [PubMed] [Google Scholar]
- 18. Singh P (2007) Role of annexin‐II in GI cancers: interaction with gastrins/progastrins. Cancer Lett 252, 19–35. [DOI] [PMC free article] [PubMed] [Google Scholar]
- 19. Zhang H, Yao M, Wu W, Qiu L, Sai W, Yang J, Zheng W, Huang J and Yao D (2015) Up‐regulation of annexin A2 expression predicates advanced clinicopathological features and poor prognosis in hepatocellular carcinoma. Tumour Biol 36, 9373–9383. [DOI] [PubMed] [Google Scholar]
- 20. Shi H, Xiao L, Duan W, He H, Ma L, Da M, Duan Y, Wang Q, Wu H, Song X et al (2016) ANXA2 enhances the progression of hepatocellular carcinoma via remodeling the cell motility associated structures. Micron 85, 26–33. [DOI] [PubMed] [Google Scholar]
- 21. Mohammad HS, Kurokohchi K, Yoneyama H, Tokuda M, Morishita A, Jian G, Shi L, Murota M, Tani J, Kato K et al (2008) Annexin A2 expression and phosphorylation are up‐regulated in hepatocellular carcinoma. Int J Oncol 33, 1157–1163. [PubMed] [Google Scholar]
- 22. Gillet JP, Andersen JB, Madigan JP, Varma S, Bagni RK, Powell K, Burgan WE, Wu CP, Calcagno AM, Ambudkar SV et al (2016) A gene expression signature associated with overall survival in patients with hepatocellular carcinoma suggests a new treatment strategy. Mol Pharmacol 89, 263–272. [DOI] [PMC free article] [PubMed] [Google Scholar]
- 23. Li Y, Zhou B, Dai J, Liu R and Han ZG (2013) Aberrant upregulation of LRRC1 contributes to human hepatocellular carcinoma. Mol Biol Rep 40, 4543–4551. [DOI] [PubMed] [Google Scholar]
- 24. Khan R, Zahid S, Wan YJ, Forster J, Karim AB, Nawabi AM, Azhar A, Rahman MA and Ahmed N (2013) Protein expression profiling of nuclear membrane protein reveals potential biomarker of human hepatocellular carcinoma. Clin Proteomics 10, 6. [DOI] [PMC free article] [PubMed] [Google Scholar]
- 25. Tan G, Wu L, Tan J, Zhang B, Tai WC, Xiong S, Chen W, Yang J and Li H (2016) MiR‐1180 promotes apoptotic resistance to human hepatocellular carcinoma via activation of NF‐kappaB signaling pathway. Sci Rep 6, 22328. [DOI] [PMC free article] [PubMed] [Google Scholar]
- 26. Zhou X, Zhu HQ, Ma CQ, Li HG, Liu FF, Chang H and Lu J (2016) MiR‐1180 promoted the proliferation of hepatocellular carcinoma cells by repressing TNIP2 expression. Biomed Pharmacother 79, 315–320. [DOI] [PubMed] [Google Scholar]


