

Abstract
Brief monocular deprivation (MD) shifts ocular dominance and reduces the density of thalamic synapses in layer 4 of the mouse primary visual cortex (V1). We found that microglial lysosome content is also increased as a result of MD. Previous studies have shown that the microglial fractalkine receptor CX3CR1 is involved in synaptic development and hippocampal plasticity. We therefore tested the hypothesis that neuron-to-microglial communication via CX3CR1 is an essential component of visual cortical development and plasticity in male mice. Our data show that CX3CR1 is not required for normal development of V1 responses to visual stimulation, multiple forms of experience-dependent plasticity, or the synapse loss that accompanies MD in layer 4. By ruling out an essential role for fractalkine signaling, our study narrows the search for understanding how microglia respond to active synapse modification in the visual cortex.
SIGNIFICANCE STATEMENT Microglia in the visual cortex respond to monocular deprivation with increased lysosome content, but signaling through the fractalkine receptor CX3CR1 is not an essential component in the mechanisms of visual cortical development or experience-dependent synaptic plasticity.
Keywords: microglia, ocular dominance plasticity, stimulus-selective response potentiation, synaptic plasticity, visual cortex
Introduction
The study of ocular dominance (OD) plasticity has greatly advanced the understanding of how experience and deprivation modify the brain and behavior. Monocular deprivation (MD) shifts the relative responsiveness of cortical neurons away from the deprived eye and toward the nondeprived eye (Hubel et al., 1977; Fagiolini et al., 1994; Gordon and Stryker, 1996; Sawtell et al., 2003; Frenkel and Bear, 2004). It has been established that functional deprived-eye depression in layer 4 (L4) is mediated by NMDA receptor (NMDAR)-dependent AMPA receptor (AMPAR) internalization (for review, see Cooke and Bear, 2014). Additionally, there are well known anatomical changes in geniculocortical axons and synapses after MD (Hubel et al., 1977; Shatz and Stryker, 1978; Friedlander et al., 1991; Antonini and Stryker, 1993; Antonini et al., 1999). Quantitative immunoelectron microscopy (immuno-EM) in the mouse binocular visual cortex demonstrates that structural effects of MD can occur as rapidly as the functional, electrophysiologically measured effects (Coleman et al., 2010). However, the mechanisms that couple and coordinate functional and structural plasticity are largely unidentified.
During developmental circuit refinement, microglia phagocytose synapses in an activity-dependent manner. Altering the balance of competing retinal ganglion cell (RGC) input to the lateral geniculate nucleus (LGN) shifts microglial phagocytosis toward the removal of a weaker input and away from a stronger input (Schafer et al., 2012). Furthermore, proper pruning following eye opening does not occur in the absence of complement system components that signal through microglia, leaving aberrant RGC synapses and ocular inputs improperly segregated (Stevens et al., 2007; Schafer et al., 2012).
Fractalkine (or CX3CL1) is believed to be an important additional signal for microglia to monitor and influence synaptic plasticity. Fractalkine is a transmembrane protein expressed by neurons of the forebrain, which can be cleaved by cathepsin S or metalloproteases to release a soluble isoform containing the chemokine domain (Garton et al., 2001; Sheridan and Murphy, 2013). Fractalkine binds exclusively to the fractalkine receptor (CX3CR1), a Gi-protein-coupled receptor expressed by microglia within the brain (Jung et al., 2000), allowing for highly selective signaling from neurons to microglia. Local fractalkine signaling is therefore ideally positioned to coordinate synapse elimination and functional long-term synaptic depression.
In the hippocampi of the transgenic Cx3cr1 KO mouse (Jung et al., 2000), there are increases in dendritic spines and PSD95 puncta (Paolicelli et al., 2011) and fewer multisynaptic boutons than in WT animals (Zhan et al., 2014), suggesting that without proper fractalkine signaling, synapse loss is stunted and specific synapses do not mature and strengthen. The absence of the fractalkine receptor also impacts the cortex: in the developing mouse somatosensory cortex, Cx3cr1 KO thalamocortical synapses are functionally immature, with delayed increases in the GluN2A/GluN2B and AMPAR/NMDAR ratios (Hoshiko et al., 2012).
Although it is evident that Cx3cr1 KO mice show synaptic deficits during development, the question remains as to whether experience-dependent plasticity occurs without the fractalkine receptor. CX3CR1 is highly expressed in V1 at ages characterized by heightened activity-dependent synaptic plasticity (Nimmerjahn et al., 2005; Tremblay et al., 2010). Both the Cx3cr1 KO hippocampus and barrel cortex have increased numbers of weak synapses, which are normally removed or strengthened in WT brains. This deficit might additionally manifest as an inability to properly target and remove synapses from a weakened input. We therefore tested the hypotheses that CX3CR1 is required for the following: (1) the proper functional development of the visual system, (2) experience-dependent increases in synaptic strength in V1, (3) the functional and structural consequences of MD in V1, and (4) microglial activation in V1 after MD. The data suggest that microglia indeed respond structurally after MD, but that fractalkine signaling is not required for synaptic remodeling. Visual system development and experience-dependent plasticity in V1 proceed normally in the absence of CX3CR1.
Materials and Methods
Mice
All procedures involving laboratory animals occurred at the Massachusetts Institute of Technology, adhered to the guidelines of the National Institutes of Health, and were approved by the Committee on Animal Care at the Massachusetts Institute of Technology. Mice were housed in groups of 2–5 with food and water available ad libitum and maintained on a 12 h light/dark cycle. CX3CR1 transgenic mice (B6.129P-Cx3cr1tm1Litt/J, RRID:IMSR_JAX:005582) mice, wherein green fluorescent protein (GFP) has replaced the first coding exon of the CX3CR1 gene (Jung et al., 2000) were obtained from The Jackson Laboratory and maintained on a C57BL/6 background. All mice used were CX3CR1+/+ (WT) and CX3CR1−/− (KO) male littermates, resulting from parents heterozygous for the CX3CR1 gene and were genotyped by Transnetyx using real-time PCR for the CX3CR1 (WT) and GFP (KO) genes. All experiments were conducted blind to genotype and treatment.
Labeling eye-specific projections to the LGN
Juvenile mice [postnatal day (P) 28] were anesthetized with isoflurane (1.5–2%). To access the vitreous chamber for cholera toxin B (CTB) injection, the temporal portion of the globe was reflected anteriorly by gently pulling a 7-0 silk suture threaded through the conjunctiva and securing it to the operating surface. The conjunctiva was then trimmed using fine-angled scissors to expose the sclera. A small puncture was made at the corneoscleral junction into the vitreous chamber with a fine needle. A glass micropipette with a tip diameter of 40–50 μm was attached to a Nanoject II injection system (Drummond Scientific) and inserted into the vitreous chamber at a depth of ∼2 mm. Animals received 1 μl intravitreal injections of CTB conjugated to Alexa fluorophores (Thermo Fisher Scientific) into each eye: the left eye received CTB-Alexa-647 and the right eye received CTB-Alexa-555. The eye was then rinsed with sterile eye drops and coated with an antibiotic ointment to prevent infection.
After 48 h, animals were anesthetized with Nembutal and perfused with 4% paraformaldehyde in PBS. Sixty micrometer coronal brain slices containing the LGN were collected, and every second slice was mounted on glass slides with fluoromount G. Three sections representing the middle third of the LGN were selected per hemisphere. Z stacks were acquired with confocal microscopy (Olympus confocal microscope) and a 20× objective lens, with a step size of 5 μm, resulting in 8–10 images per brain slice.
For analysis, background fluorescence was subtracted and normalized (0–255) using Fiji (http://fiji.sc, RRID:SCR_002285). Grayscale images were converted into binary, and an ROI containing only the LGN was traced. The “add images” function was used to superimpose the channels containing the 555-generated and 647-generated signal. Pixels were counted to measure the area of the contralaterally labeled retinal projection, the area of the ipsilaterally labeled retinal projection, and the area containing overlap of both projections.
Visually evoked potential surgery
Mice were first injected with 0.1 mg/kg Buprenex subcutaneously to provide analgesia. They were then anesthetized with an intraperitoneal injection of 50 mg/kg ketamine and 10 mg/kg xylazine. Before surgical incision, 1% lidocaine hydrochloride anesthetic was injected under the mouse's scalp. The skull was then cleaned with iodine and 70% ethanol. A steel head post was affixed to the skull anterior to bregma using cyanoacrylate glue. Burr holes (<0.5 mm) were then drilled in the skull over binocular V1 (3.1 mm lateral to lambda). Tapered tungsten recording electrodes (FHC), 75 μm in diameter at their widest point, were implanted in each hemisphere, 450 μm below the cortical surface. Silver wire (A-M Systems) reference electrodes were placed over the prefrontal cortex. Mice were allowed to recover for ≥24 h before head fixation.
Stimulus delivery
Visual stimuli consisted of full-field, 100% contrast, sinusoidal gratings presented on a computer monitor. Visual stimuli were generated using custom software written in either C++ for interaction with a VSG2/2 card (Cambridge Research Systems.) or Matlab (MathWorks, RRID:SCR_001622) using the PsychToolbox extension (http://psychtoolbox.org, RRID:SCR_002881) to control stimulus drawing and timing. The display was positioned 20 cm in front of the mouse and centered, thereby occupying 92 × 66° of the visual field. Visual stimuli consisted of full-field sinusoidal grating stimuli phase-reversing at a frequency of 2 Hz. Mean stimulus luminance was 27 cd/m2. Grating stimuli spanned the full range of monitor display values between black and white, with γ-correction to ensure constant total luminance in both gray-screen and patterned stimulus conditions. Experiments were fully automated and each stimulus block consisted of 200 phase reversals with 30 s intervals between each stimulus presentation, during which the screen was gray but of equivalent luminance.
Each day's recordings used oriented stimuli ≥30° different from any experienced previously by the individual mouse and was never within 20° of horizontal as these orientations are known to elicit visually evoked potentials (VEPs) of greater magnitude than oblique stimuli. For acuity experiments, stimuli were presented binocularly with 200 phase reversals of each stimulus at 100% contrast and spatial frequencies as noted in the text. During stimulus-selective response potentiation (SRP) experiments, binocular stimuli were presented with 400 phase reversals of each stimulus at 100% contrast, with the spatial acuity and orientation denoted in the text. This was repeated identically every day for 7 d. On the seventh day, a novel orientated stimulus was presented interleaved with the trained stimulus to confirm stimulus specificity. During MD experiments, stimuli of 100% contrast at 0.4 cycle/° were presented and recorded to each eye separately, with the opposing eye blocked by an opaque drape placed flush with the animal's nose.
In vivo electrophysiology
VEP recordings were conducted in awake, head-restrained mice. Before recording, mice were habituated to the restraint apparatus by sitting in situ in front of a gray screen for a 30 min session on each of 2 consecutive days. For repeated experiments in older animals (SRP and acuity), the animals were rehabituated before rerecording. For experiments in which monocular VEPs were acquired, mice were also habituated to the occluding paddle positioned in front of each eye. Data were extracted from the binary storage files and analyzed using custom software written in C++, Matlab, and Labview. VEP magnitude was then quantified by measuring trough–peak response magnitude averaged over all phase reversals.
Eyelid suture
Under isoflurane anesthesia (1.5–2%), hair surrounding the eye was removed and lid margins were trimmed. The eye was thoroughly flushed with sterile saline and antibiotic ophthalmic ointment (Vetropolycin, Pharmaderm) was applied to the eye. Using 6-0 vicryl sutures, ∼5 stitches were placed along the extent of the trimmed lids and knots were secured with cyanoacrylate glue.
Three days after lid closure, suture integrity was inspected and animals whose eyelids were not fully sealed were excluded from further experiments. In experiments where VEPs were recorded after MD, the animal was placed under isoflurane anesthesia (1.5–2%) and the sutured eye was opened and cleaned with saline. Animals were given 30–60 min of recovery from anesthesia in a light-blocked cage before being recorded with a visual stimulus of orthogonal orientation.
Tissue preparation for EM
Perfusions.
Animals were anesthetized with Nembutal and transcardially perfused with Tyrode solution until vasculature was flushed clear (<2 min). This was immediately followed by 100 ml of 4% PFA/0.5% glutaraldehyde in PB (EM grade; Electron Microscopy Sciences). Experimental animals were always perfused on the same day as littermate controls. Tissue was postfixed for 1–2 d at room temperature, during which the brains were transferred to the University of Virginia for EM analysis.
Immunohistochemistry.
Visual cortex blocks were placed in a vibratome and cut at 60 μm. For each group of animals, yoked, littermate control tissue was always processed with experimental tissue. Sections were subsequently immersed in a 1% sodium borohydride/PB solution, followed by a series of PB rinses until borohydride solution was cleared. Free-floating sections were stored in PBS containing 0.05% NaN3 at 4°C. VGluT2 was visualized using guinea pig anti-VGluT2 (Millipore Bioscience Research Reagents, RRID:AB_1587626) diluted 1:5000 in PBS, pH 7.4, containing 0.9% NaCl, 1% BSA, and 0.05% NaN3 at room temperature for 36–48 h. Next, sections of V1 were immersed in biotinylated anti-guinea pig IgG (Vector Laboratories, RRID:AB_2336132) secondary antibody at 1:100 for 2 h. Sections were then incubated in ABC solution for 2 h, followed by three rinses in PBS for 3 min. Sections were then exposed to a 1% diaminobenzidine (DAB) solution in the presence of 0.003% H2O2 with gentle agitation for 5–8 min.
Embedding.
Using previously published protocols, the embedding procedure was performed blind to the history of the tissue, thereby eliminating any biases in selecting regions for analysis (Erisir et al., 2001; Nahmani and Erisir, 2005). DAB-treated sections were rinsed in PB and treated with 1% osmium tetroxide in PB for 30–45 min. Osmicated sections were then treated with 4% uranyl acetate in 70% ethanol for 2 h, and they were dehydrated in a series of ethanols. Sections were then dehydrated in acetone and placed in a 1:1 acetone-to-resin (Epon 812, Electron Microscopy Sciences) mixture for 2 h. Next, sections were placed in full resin for 2 h, flat-embedded between two acetate sheets (Aclar, Ted Pella), and cured in a 60°C oven. Binocular V1 was delineated using a brain atlas based on C57BL/6J mice, and the region of V1 that represents the upper binocular hemifield, which served as the site for previous electrophysiological recordings (Frenkel and Bear, 2004), was identified. Tissue containing all six cortical layers was excised from the flat embed and placed in a plastic capsule, which was then filled with resin. Capsules were cured in a 60°C oven overnight or until polymerized. Embedded sections were traced using a camera lucida. Capsule blocks were then trimmed down to a trapezoid that contained only L4, and ultrathin sections (∼70 nm) were collected on 200 mesh copper grids (Ted Pella) using an ultramicrotome (Ultracut UCT, Leica). As antibody penetration can be limited to several micrometers from the surface of individual thick vibratome sections, ultrathin sections were collected at a plane nearly parallel to the surface, thereby maximizing the width of the tissue that contained labeled regions. Using this cutting approach, we obtained strips of labeled tissue that were ≥50 (and ≤150) μm wide. Data collection was performed within the first 10–100 μm from the tissue–resin transition zone on ultrathin sections. Particular care was paid during ultrathin sectioning to obtain tissue “strips” that contain the tissue–resin transition zone and that span all of L4 dorsoventrally. Collecting sections in this manner allowed for ample sample area (∼25 photographs; 20–30 μm2 per EM) within each ultrathin section containing cortical L4. Moreover, the width of the labeled strip enabled us to choose optimal areas for both VGluT2 labeling and ultrastructural preservation. Although the specific dimensions of this labeled strip necessarily varied from section to section, in the rare instance wherein ultrathin sections did not adhere to the above criteria they were omitted from all of our analyses. These strips were then systematically photographed (blind to tissue history) to obtain minimally overlapping images of L4, regardless of label or profiles present in the sections.
Ultrathin sections were examined on a JEOL 1010 EM. Digital pictures were captured using a 16 megapixel SIA-12C (Sia Cam) camera coupled with MaxIm DL CCD software (Diffraction Limited). Individual ultrathin sections were photographed at the tissue–resin interface, in which label is present within a 50–150-μm-wide strip along the dorsoventral expanse of L4 as described above. Images captured at 12,000× magnification yielded 20–30 μm2 per micrograph, excluding blood vessels, myelinated axons, and somata areas.
EM image analysis and quantification.
Each EM micrograph was examined using Image-Pro Plus, version 5.0, software (Media Cybernetics), at a final screen magnification of 60,000–80,000×. Profiles were identified as synaptic terminals if they met the following criteria: (1) the presence of ≥3 vesicles, (2) parallel alignment of presynaptic terminal membrane in apposition with that of the postsynaptic membrane (Colonnier, 1968; Peters et al., 1991), and (3) a pronounced asymmetric postsynaptic density (PSD). In each digital picture, vesicle-filled profiles that displayed a synapse at the level of cross section (i.e., synaptic terminals) were identified and classified as containing VGluT2-DAB chromogen (labeled) or unlabeled.
In each micrograph, the numbers of synaptic terminals labeled or unlabeled were counted, terminal profile areas and synapse lengths (PSD lengths) were quantified, and the effective sampling area was measured. Effective sampling area was calculated as the total area of an individual micrograph minus the area occupied by cell bodies, blood vessels, and myelinated axons, as these elements may otherwise inflate the amount of neuropil available for synaptic interaction nonuniformly across photographs. Synapses were traced by following the entire length of the PSD along the parallel membranes of the synapse. In the event that a PSD was perforated, the synapse was assumed to continue along the length of the perforation.
Because experimental manipulations can potentially introduce variations in synaptic elements that could bias the sampling procedure, the volumetric density method was used as previously described (Nv = NA/d, where NA is the number of terminals per square micrometer and d is the average synapse length in micrometers (Beaulieu and Colonnier, 1985; DeFelipe et al., 1999; Erisir and Harris, 2003). This quantification method allows for estimations of synaptic terminal densities and has been shown to yield a reliable measure of profile density for asymmetric synapses in the cerebral cortex (DeFelipe et al., 1999; Erisir and Harris, 2003). The size–frequency method is sometimes preferred over the optical dissector method because it accounts for sampling biases introduced by the fact that the sampled unit (synapse) is several times larger than the tissue section thickness (Merchán-Pérezet al., 2009). Although the volumetric density method yields nearly identical results to the optical dissector method applied in the same tissue samples, the former is advantageous because it allows analysis of considerably larger areas in the cortex, reducing the variation across samples (DeFelipe et al., 1999; Benes and Lange, 2001). Furthermore, in immunostained ultrathin sections, as used in this study, the sampling is performed at the border of tissue and resin, which progresses in consecutive sections; this makes volumetric density a more feasible method to obtain enough data for meaningful statistical comparisons between experimental and control groups after multiple manipulations (Erisir and Harris, 2003; May et al., 2008). The percentage of VGluT2-labeled synaptic terminals in L4 was determined as follows: %Nv labeled = 100 × (Nv labeled/Nv all). To control for variations in signal intensity, tissues obtained from experimental and control animals (yoked controls) were always processed together and all values were normalized to the means of yoked controls.
Immunohistochemistry
Three days after lid suture, mice (P31) were deeply anesthetized with Fatal-Plus (pentobarbital) and the brain was removed and drop-fixed for 4 h at room temperature. Immediately following fixation, the brain was sectioned into 60 μm coronal slices using a vibratome. Slices containing the visual cortex were incubated with blocking solution (10% fetal bovine serum in PBS with 0.2% Triton X-100) for 1 h at room temperature and then with anti-Iba1 rabbit primary antibody (1:1000; 019-19741, Wako Chemicals, RRID:AB_2314667) and anti-CD68 mouse antibody (1:400; FA-11, AbD Serotec, RRID:AB_323909) diluted in blocking solution overnight at 4°C. Slices were then washed three times with PBS and incubated with the secondary antibody (Alexa-647-conjugated anti-rabbit IgG, 1:500; RRID:AB_10393158; Alexa-568-conjugated anti-mouse IgG, 1:500; RRID:AB_2534013) and Hoechst 33342 (1:10,000; Thermo Fisher Scientific) for 1 h at room temperature. Slices were washed three times with PBS and mounted with fluoromount-G on slides. Images were taken with a 40× objective (0.95 numerical aperture; Olympus) on a confocal fluorescence microscope (Fluoview F1000, Olympus). L4 of the binocular visual cortex was identified by anatomical hallmarks, including the location of the dentate gyrus, location and shape of the white matter, and intensity of Hoechst stain.
Using the Iba1 channel only, ROIs were drawn around microglial cell bodies in Fiji. The CD68 channel was then autothresholded and the microglia soma ROIs were overlaid on top. Using the “measure” function, the area of each soma as well as the percentage of the area containing CD68 staining was determined. An ROI not containing microglia was used to quantify the background staining of each imaging area, and this value was subtracted from all cell measurements.
Experimental design and statistical analysis
All data are expressed as a mean ± SEM and n represents individual animals (biological replicate), except in data about CD68 activation per cell and EM synaptic terminal size. In these cases, n is a cell or terminal, respectively, and is noted in the text. Sigmaplot was used for parametric statistical analysis. With two samples, t tests were performed. When comparing ≥3 groups, normality of distribution and homogeneity of variation was tested and ANOVAs were applied. When ANOVAs yielded significance, Student–Newman–Keuls (SNK) post hoc tests with adjustment for multiple comparisons were applied for individual comparisons. Repeated-measures ANOVAs were applied for all within-subject comparisons. For other comparisons, unpaired ANOVAs were used. For volumetric density EM measurements, one-way ANOVAs with nested replicate measures were used. p < 0.05 is used as a threshold for significance for all parametric comparisons and exact values are reported within the results. With CD68 activation and EM synaptic terminal size, the data are not normally distributed. In these cases, nonparametric tests (Mann–Whitney U) were performed using SPSS software. To correct for repeated comparisons, statistical significance for nonparametric tests was p < 0.005.
Results
CX3CR1 is not required for segregation of retinal geniculate inputs into the LGN
During early postnatal development, the mouse LGN develops from a structure containing large areas of overlap between the RGC projections from each eye to one that is distinctly segregated. Microglia are necessary for this process, engulfing the projections pruned away (Schafer et al., 2012) in a manner that requires proper immune signaling (Stevens et al., 2007; Boulanger, 2009). This raises the possibility that LGN segregation will be disrupted in the absence of CX3CR1, which may impact both binocular cortical development and visual cortical plasticity.
To determine whether CX3CR1 influences retinal axon segregation, we labeled eye-specific inputs with an anterograde tracer (CTB) conjugated to a different fluorophore (Alexa-555 or Alexa-647) in littermate mice (Fig. 1A,B). We chose to analyze brains from P28–P30 mice because it is a complementary time point to our electrophysiology studies and eye segregation within the LGN is complete. We found no significant difference between either the areas occupied by the contralateral eye (Fig. 1C, blue; WT, 83.91 ± 1.88%; KO, 83.88 ± 2.91% of total dLGN; p = 0.585 t test) or ipsilateral eye (yellow; WT, 17.65 ± 3.09; KO, 18.57 ± 2.27% of total dLGN area; p = 0.528 t test). Furthermore, we did not see an increased area of overlapping projections (Fig. 1D, green; WT, 2.08 ± 0.29%; KO, 2.48 ± 0.52% of total dLGN area; p = 0.482 t test), the hallmark of disrupted LGN segregation. This confirms that at the RGC level, microglia lacking CX3CR1 are still capable of sculpting thalamic circuits during visual system development. We cannot rule out the possibility of a subtler effect on the rate of segregation, but by the peak of the critical period for OD plasticity ∼P30, segregation is complete.
Figure 1.
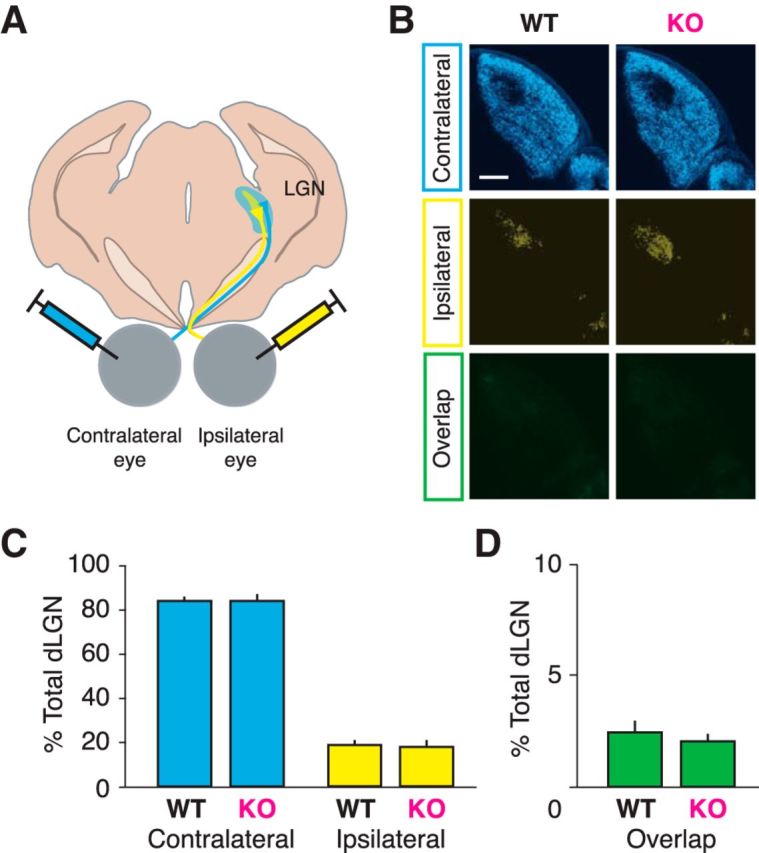
Segregation of ocular inputs to LGN is normal in juvenile Cx3cr1 KO animals. A, Schematic of eye injection procedure, where anterograde tracers (CTB Alexa Fluor conjugates) are injected into each eye, labeling RGC projections in the LGN. B, Representative images of LGN with contralateral retinal projections (blue), ipsilateral projections (yellow), and the overlapping signal of both eyes (green). C, Average of labeled LGN areas shows no difference in any measurement between genotypes (contralateral, p = 0.585; ipsilateral, p = 0.528; overlap, p = 0.482). D, Overlap between contralateral and ipsilateral projections is minimal (n = 6 WT, 10 KO animals).
Juvenile and adult Cx3cr1 KO mice have normal visual acuity
Like LGN segregation, the quality of vision is also a reflection of the proper developmental wiring of the visual system. VEPs offer a way to quantify visual function in mice at the level of the primary visual cortex and these recordings match behavioral measures of visual acuity (Prusky and Douglas, 2003; Cooke et al., 2015). This method is also well suited for chronic recording from awake mice over a developmental time course.
Juvenile Cx3cr1 KO and WT littermate mice (P25) were implanted with VEP recording electrodes within L4 of the binocular primary visual cortex, a depth that yields the maximum negative-going VEP (Huang et al., 1999; Sawtell et al., 2003). VEPs were recorded in juvenile mice (at P28) across a range of eight spatial frequencies (0.05, 0.1, 0.2, 0.3, 0.4, 0.5, 0.6, and 0.7 cycle/°). One month later (at P60), these animals were recorded from again using the same spatial frequencies (Fig. 2A). We found no difference between visual acuity of WT and Cx3cr1 KO mice either as juveniles or adult animals (Fig. 2B; Table 1; ANOVA animal age, P28: p = 0.360; P60: p = 0.192).
Figure 2.

Development of visual acuity as measured by VEPs is normal in Cx3cr1 KO animals. A, Experimental timeline of visual acuity assessment in juvenile and adult mice. Animals were implanted and VEPs recorded in response to grating stimuli of 0.05, 0.1, 0.2, 0.3, 0.4, 0.5, 0.6, and 0.7 cycle/° as juveniles (P28) and later as adults (P60). B, VEP magnitudes do not vary between Cx3cr1 KO animals (magenta) and WT animals (black) as juveniles (solid lines) or adults (dashed lines), including difficult-to-detect spatial frequencies, which yield VEP magnitudes greater than noise (gray bar; n = 8 WT, 7 KO animals). C, Experimental timeline of visual acuity development following eye opening. VEPs were recorded every other day from P21 to P31 across four spatial frequencies (0.05, 0.2, 0.5, and 0.7 cycle/°) with a uniquely oriented (separated by 30° to prevent response potentiation; Cooke and Bear, 2010). D, There is no detectable difference between KO and WT mice at any of the four spatial frequencies tested. In both genotypes, there is a gradual increase in VEP magnitude as the animal matures (n = 14 WT, 17 KO animals).
Table 1.
Summary of visual acuity
| Stimulus spatial frequency | Genotype | Age of recording |
|
|---|---|---|---|
| Juvenile (P28) | Adult (P60) | ||
| 0.05 cycle/° | WT | 181 ± 18 μV | 130 ± 11 μV |
| KO | 161 ± 18 μV | 110 ± 8 μV | |
| p | 0.224 | 0.204 | |
| 0.1 cycle/° | WT | 158 ± 11 μV | 140 ± 11 μV |
| KO | 140 ± 17 μV | 132 ± 14 μV | |
| p | 0.282 | 0.617 | |
| 0.2 cycle/° | WT | 224 ± 14 μV | 173 ± 13 μV |
| KO | 195 ± 13 μV | 155 ± 10 μV | |
| p | 0.075 | 0.265 | |
| 0.3 cycle/° | WT | 180 ± 21 μV | 173 ± 20 μV |
| KO | 171 ± 12 μV | 146 ± 12 μV | |
| p | 0.584 | 0.084 | |
| 0.4 cycle/° | WT | 85 ± 10 μV | 108 ± 15 μV |
| KO | 78 ± 4 μV | 89 ± 8 μV | |
| p | 0.703 | 0.211 | |
| 0.5 cycle/° | WT | 52 ± 7 μV | 87 ± 17 μV |
| KO | 58 ± 8 μV | 73 ± 8 μV | |
| p | 0.759 | 0.388 | |
| 0.6 cycle/° | WT | 42 ± 5 μV | 63 ± 8 μV |
| KO | 43 ± 4 μV | 61 ± 7 μV | |
| p | 0.950 | 0.933 | |
| 0.7 cycle/° | WT | 31 ± 6 μV | 49 ± 6 μV |
| KO | 32 ± 3 μV | 45 ± 5 μV | |
| p | 0.954 | 0.828 | |
We considered the possibility that there might be a delay in the development of visual acuity in the Cx3cr1 animals that occurs during initial light exposure shortly after birth, but is ameliorated by 1 month of age. We implanted mice with VEP electrodes as close to eye opening as technical limitations allowed (the earliest weaning age, P18). VEPs in response to four different spatial frequencies (0.05, 0.2, 0.5, and 0.7 cycle/°) presented binocularly were recorded every other day from P21 to P31 (Fig. 2C). We found no differences between VEP magnitudes of WT or KO animals at any of the spatial frequencies tested (Fig. 2D; Table 2). Over the 10 d of testing, there was a gradual increase in VEP magnitude particularly at low spatial frequencies in both genotypes (ANOVA animal age: 0.05 cycle/°, p < 0.001; 0.2 cycle/°, p < 0.001; 0.5 cycle/°, p = 0.141; 0.7 cycle/°, p = 0.043). These data show that the quality of vision in the absence of CX3CR1 is approximately equal to that of WT animals across developmental age.
Table 2.
Summary of visual acuity development
| Stimulus spatial frequency | Genotype | Age of recording |
|||||
|---|---|---|---|---|---|---|---|
| P21 | P23 | P25 | P27 | P29 | P31 | ||
| 0.05 cycle/° | WT | 119 ± 15 μV | 160 ± 25 μV | 159 ± 27 μV | 175 ± 29 μV | 167 ± 29 μV | 207 ± 38 μV |
| KO | 126 ± 21 μV | 127 ± 18 μV | 166 ± 32 μV | 142 ± 37 μV | 172 ± 39 μV | 190 ± 30 μV | |
| p | 0.872 | 0.424 | 0.861 | 0.432 | 0.894 | 0.691 | |
| 0.2 cycle/° | WT | 132 ± 19 μV | 165 ± 20 μV | 209 ± 21 μV | 201 ± 25 μV | 198 ± 20 μV | 210 ± 25 μV |
| KO | 148 ± 17 μV | 150 ± 15 μV | 200 ± 20 μV | 201 ± 23 μV | 216 ± 19 μV | 215 ± 19 μV | |
| p | 0.540 | 0.567 | 0.747 | 0.978 | 0.499 | 0.840 | |
| 0.5 cycle/° | WT | 36 ± 8 μV | 39 ± 7 μV | 48 ± 10 μV | 48 ± 8 μV | 43 ± 9 μV | 47 ± 13 μV |
| KO | 45 ± 10 μV | 46 ± 11 μV | 57 ± 12 μV | 60 ± 15 μV | 60 ± 12 μV | 63 ± 17 μV | |
| p | 0.308 | 0.461 | 0.450 | 0.166 | 0.133 | 0.291 | |
| 0.7 cycle/° | WT | 19 ± 5 μV | 15 ± 4 μV | 23 ± 4 μV | 25 ± 5 μV | 26 ± 4 μV | 27 ± 7 μV |
| KO | 23 ± 4 μV | 21 ± 3 μV | 26 ± 4 μV | 26 ± 4 μV | 31 ± 7 μV | 27 ± 7 μV | |
| p | 0.412 | 0.253 | 0.602 | 0.858 | 0.421 | 0.991 | |
Juvenile and adult Cx3cr1 KO mice express SRP
SRP is a substrate for a form of visual learning induced by daily presentations of a visual stimulus of a particular orientation (Frenkel et al., 2006). This plasticity requires NMDAR signaling and AMPAR insertion (Frenkel et al., 2006) and employs the mechanism of long-term synaptic potentiation (LTP; Cooke and Bear, 2010). SRP provides a robust measure of experience-dependent synaptic strengthening.
Following the standard VEP implantation surgery, littermate mice aged P25–P31 were binocularly presented with a phase-reversing sinusoidal grating stimulus of a specific orientation, repeated every day for 7 d (Fig. 3A). On the final day of SRP induction, the mice were presented with a stimulus of a novel orientation randomly interleaved with the familiar stimulus to confirm that SRP was specific to the trained stimulus. In our WT animals, the amplitude of VEPs evoked by the familiar visual stimulus increases across presentation days to approximately double that evoked by a novel stimulus, which is consistent with published data (Frenkel et al., 2006; Cooke and Bear, 2010).
Figure 3.

Cx3cr1 KO mice demonstrate normal experience-dependent synaptic potentiation following SRP. A, Experimental timeline of SRP protocol. Animals were implanted at P22 and habituated to the recording apparatus 48 h later. Over the next 7 d, binocular VEPs were recorded from awake, head-fixed animals, driven by the same stimulus with an orientation of 45°. On the final day, an additional visual stimulus with a novel orientation of 135° (red) was interspersed with the trained 45° stimuli (orange). A month later, this same weeklong protocol was repeated with adult animals and a new stimulus (75°, 165° on test day). B, Average traces showing VEPs potentiate similarly in WT and Cx3cr1 KO juvenile mice. C, An asymptote of VEP amplitude is reached after 1 d of stimulus exposure, yet a novel stimulus is not potentiated, demonstrating that the increased VEP magnitude is specific to the trained stimuli. D, Average traces of VEPs in adult animals potentiate similarly in Cx3cr1 KO and WT adult mice. E, VEP magnitude gradually increases across 7 d and is specific to the trained stimuli (filled bars, first day of stimulus presentation; open bars, repeated stimulus; scale bar for traces: 100 μV by 100 ms; WT, n = 11 animals; KO, n = 9 animals).
To measure the quality of SRP during the visual system critical period, we began SRP induction 2 weeks earlier than has previously been investigated (Fig. 3A). We discovered that the kinetics of SRP induction in P25 WT mice was very different from that previously detected in older animals: the VEP doubled after only 1 d of stimulus exposure (Fig. 3B,C; Table 3; WT day 1 vs WT day 2, p < 0.001 SNK post hoc), a plateau that was unaffected by the additional days of training and is specific to the trained stimuli (WT day 7 vs WT day 7 novel, p < 0.001 SNK post hoc). Juvenile Cx3cr1 KO animals had SRP induction that was indistinguishable from that of WT animals (ANOVA genotype, p = 0.659).
Table 3.
Summary of SRP induction
| SRP recording day | Genotype | Age of recording |
|
|---|---|---|---|
| Juvenile (P25–P31) | Adult (P60–P66) | ||
| 1 | WT | 153 ± 10 μV | 200 ± 14 μV |
| KO | 148 ± 25 μV | 180 ± 25 μV | |
| p | 0.912 | 0.671 | |
| 2 | WT | 302 ± 31 μV | 263 ± 25 μV |
| KO | 307 ± 39 μV | 274 ± 31 μV | |
| p | 0.914 | 0.822 | |
| 3 | WT | 335 ± 36 μV | 289 ± 33 μV |
| KO | 324 ± 42 μV | 311 ± 39 μV | |
| p | 0.791 | 0.639 | |
| 4 | WT | 316 ± 25 μV | 335 ± 32 μV |
| KO | 342 ± 34 μV | 316 ± 37 μV | |
| p | 0.562 | 0.684 | |
| 5 | WT | 335 ± 34 μV | 364 ± 30 μV |
| KO | 396 ± 41 μV | 388 ± 35 μV | |
| p | 0.174 | 0.211 | |
| 6 | WT | 317 ± 31 μV | 392 ± 46 μV |
| KO | 358 ± 35 μV | 397 ± 36 μV | |
| p | 0.356 | 0.911 | |
| 7 | WT | 342 ± 35 μV | 364 ± 37 μV |
| KO | 377 ± 29 μV | 425 ± 41 μV | |
| p | 0.356 | 0.933 | |
| 7: novel stimulus | WT | 141 ± 12 μV | 159 ± 20 μV |
| KO | 123 ± 21 μV | 164 ± 28 μV | |
| p | 0.427 | 0.912 | |
We repeated SRP induction with these same animals using uniquely oriented spatial frequencies 1 month later (Fig. 3A). In adult mice using our standard SRP timeline beginning in animals ∼2 months of age, we found the classically reported incremental SRP induction approaching a plateau following 5–7 d of training in WT animals (Fig. 3D,E; Table 3). Adult Cx3cr1 KO animals express SRP over a similar time course and magnitude equivalent to adult WT animals (ANOVA genotype, 0.778).
The age-dependent difference in SRP induction raises intriguing possibilities about developmental differences in visual cortical synaptic potentiation. However, we did not find any differences in Cx3cr1 KO SRP expression as compared with WT. This leads us to conclude that the visual circuit does not require CX3CR1 to produce LTP-like synaptic plasticity.
Brief lid suture induces an OD shift in WT and Cx3cr1 KO mice
It has been repeatedly shown that OD in the primary visual cortex as measured by VEPs can be strongly shifted by suturing closed the contralateral eyelid in juvenile mice (Frenkel and Bear, 2004). The ratio of VEP amplitudes evoked by stimulation of each eye provides a reliable index of OD and is in close agreement with single-unit recordings (Liu et al., 2008; Yoon et al., 2009).
Juvenile mice (P25) were implanted with VEP recording electrodes in binocular V1 within L4 (Fig. 4A). Phase-reversing grating stimuli were presented monocularly to each eye and the amplitude of evoked responses was recorded (Fig. 4A). During baseline recordings at P28, we observed that the ratio of contralateral eye VEP amplitude to ipsilateral eye VEP amplitude (the C/I ratio, Fig. 4C, green) for both WT and KO animals was ∼2 (WT pre-MD C/I ratio, 1.81 ± 0.24 μV; KO pre-MD C/I ratio, 2.00 ± 0.17 μV; ANOVA genotype, p = 0.778), similar to published contralateral eye dominance in mice. Before MD, the amplitude of VEPs driven by the contralateral eye was not different between genotypes (Fig. 4B, blue; WT contralateral pre-MD, 76.41 ± 7.53 μV; KO contralateral pre-MD, 78.47 ± 7.75 μV; ANOVA genotype, p = 0.487), nor by the ipsilateral eye (Fig. 4B, yellow; WT ipsilateral pre-MD, 53.87 ± 7.15 μV; KO ipsilateral pre-MD, 45.22 ± 7.09 μV; ANOVA genotype, p = 0.661).
Figure 4.

Effect of brief MD on OD shift unaffected in Cx3cr1 mutants. A, Left, Timeline of 3 d MD experiment. Right, Diagram of VEP recording apparatus: an awake mouse is head-restrained in front of a computer screen with a phase-reversing grating stimulus presented monocularly, with an occluder blocking one eye. VEPs driven by the eye contralateral to the recorded hemisphere are shown in blue and the eye ipsilateral to the recorded hemisphere is shown in yellow. B, After 3 d of MD of the contralateral eye (post-MD), VEPs driven by the contralateral/deprived eye decrease significantly in both genotypes (ANOVA condition, p < 0.001; WT pre-MD vs WT post-MD, p = 0.003; KO pre-MD vs KO post-MD, p = 0.044), while VEPs driven by the ipsilateral/open eye increased significantly in both genotypes (ANOVA condition, p < 0.001; WT pre-MD vs WT post-MD, p = 0.031; KO pre-MD vs KO post-MD, p = 0.007). C, The OD shift can be measured through a ratio of contralateral VEP to ipsilateral VEP, shifting from ∼2:1 to 1:1 following MD in both WT and KO animals (scale bar for traces: 50 μV by 100 ms; n = 15 WT animals, 15 KO animals; post hoc tests, *p < 0.05 after 2-way ANOVA).
After 3 d of MD, an OD shift was manifested as both depression of deprived-eye VEP amplitudes (Fig. 4B; WT contralateral post-MD, 42.67 ± 7.96 μV, p = 0.003 SNK post hoc; KO contralateral post-MD, 57.12 ± 14.08 μV, p = 0.044 SNK post hoc; ANOVA MD condition, p < 0.001) and potentiation of open-eye VEP amplitudes (Fig. 4B; WT ipsilateral post-MD, 74.59 ± 11.99 μV, p = 0.031 SNK post hoc; KO ipsilateral post-MD, 72.36 ± 11.21 μV, p = 0.007 SNK post hoc; ANOVA MD condition p < 0.001), with no significant differences between WT and KO animals (contralateral ANOVA MD × genotype interaction: p = 0.396; ipsilateral ANOVA MD × genotype interaction: p = 0.644). This ratio of responses driven by each eye was rapidly shifted as a consequence of contralateral eyelid closure, such that after 3 d of MD, the C/I ratio became ∼1 for both genotypes (Fig. 4C; WT post-MD C/I ratio, 0.92 ± 0.27, p = 0.010 SNK post hoc; KO post-MD C/I ratio, 0.84 ± 0.16, p = 0.001 SNK post hoc; ANOVA MD × genotype interaction: p = 0.540).
Brief lid suture reduces both thalamocortical synapse density and size in WT brains, but only density in Cx3cr1 KO mice
We were intrigued by the possibility that elimination of fractalkine signaling might abrogate structural remodeling while leaving functional plasticity intact. Therefore, we next investigated how 3 d of MD affects thalamocortical synapse size and density using quantitative immuno-EM. We used the vesicular glutamate transporter (VGluT2) antibody to specifically label thalamocortical terminals in the mouse (Nahmani and Erisir, 2005; Coleman et al., 2010). This approach allows separate analysis of presynaptic input that originates from the LGN and other (mostly intracortical) sources (Fig. 5A,B). Previous studies have shown that 3 d of MD results in a structural OD shift wherein thalamocortical synapses are less dense and their presynaptic terminals are smaller (Coleman et al., 2010). We confirmed this finding: in L4 of the binocular visual cortex in WT animals, there was a significant decrease in the volumetric density of VGluT2-labeled synapses normalized to total volumetric density of each brain that had undergone 3 d of MD (Fig. 5D; WT, 0.23 ± 0.01 μm3, WT+MD: 0.16 ± 0.02 μm3, p = 0.005 SNK post hoc) but no impact on volumetric density of all WT synapses (Fig. 5C; WT, 0.98 ± 0.12 μm3; WT+MD, 1.10 ± 0.11 m3; p = 0.02 SNK post hoc). Furthermore, we found that the terminal size decreased as a consequence of MD (Fig. 5E; median: WT, 0.30 μm2; WT+MD, 0.24 μm2, p < 0.001 Mann–Whitney U).
Figure 5.
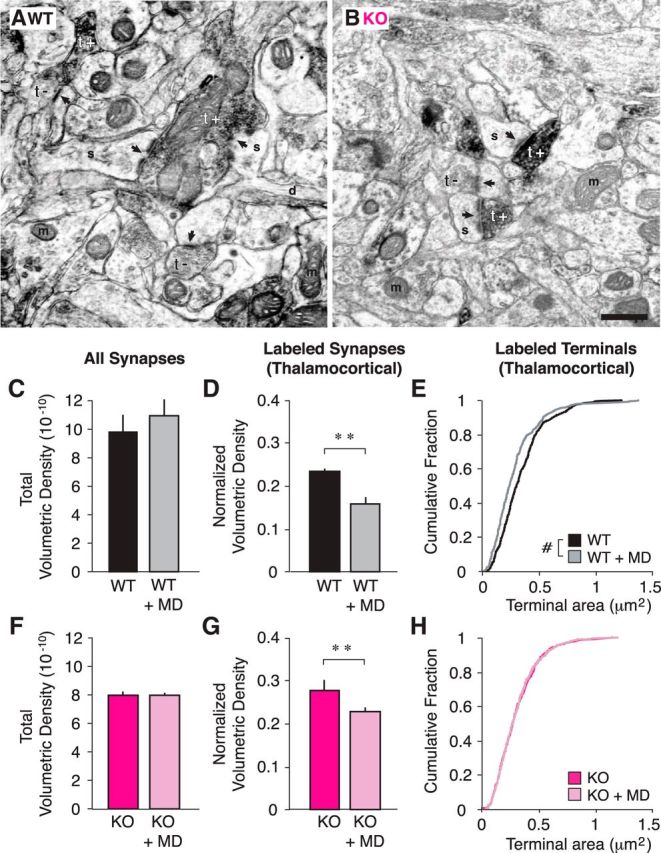
Thalamocortical synapses are less dense following brief MD in both WT and Cx3cr1 KO animals. A, B, Example EMs of WT (A) and KO (B) cortical slices. Synapses (arrows) are classified as originating from thalamic input based upon VGlut2 immunoreactivity (black, t+) or a lack of VGlut2 immunoreactivity (t−; s, spine; d, dendrite; m, mitochondria; scale bar, 500 μm). C, D, Total volumetric density of all synapses in WT animals is unchanged following MD (C; p > 0.05), but the normalized volumetric density of labeled synapses (Nvlabeled/Nvtotal) is significantly decreased (D; p = 0.005), as is the size of the terminals (E; p < 0.001). F, G, In KO animals, similar to WT animals, total volumetric density is unchanged after MD (F; p > 0.05) and normalized volumetric density of labeled synapses is decreased (G; p = 0.003). H, However, unlike WT brains, the size of labeled terminals is unaffected by MD in KO brains (p = 0.852; n = 3 WT, 3 WT+MD, 3 KO, and 6 KO+MD animals; terminal n = 489 WT, 381 WT+MD, 473 KO, 843 KO+MD; post hoc tests, **p < 0.01 after ANOVA; #p < 0.005, Mann–Whitney U test).
In Cx3cr1 KO brains following 3 d of MD, we also found a significant decrease in the normalized density of VGluT2-labeled synapses (Fig. 5G; KO, 0.28 ± 0.02 nm3; KO+MD, 0.23 ± 0.01 nm3, p = 0.003 SNK post hoc) and no change in the synapse density of all synapses (Fig. 5F; KO, 0.79 ± 0.03 nm3; KO+MD, 0.80 ± 0.02 nm3; p = 0.505 Mann–Whitney U). However, unlike WT animals, there was no impact of MD on terminal size of labeled synapses in KO animals (Fig. 5H; median: KO, 0.27 μm 2; KO+MD, 0.27 μm 2; p = 0.852 Mann–Whitney U).
We also found a difference in the baseline properties of thalamocortical synapses between WT and KO animals. Comparing the genotypes during unmanipulated sensory experience, KO brains have higher normalized volumetric densities of labeled synapses (Fig. 6A; filled bars, p = 0.020 SNK post hoc) with smaller terminal sizes when compared with WT brains (Fig. 6B, solid lines; p = 0.005 SNK post hoc). In the case of unlabeled synapses in non-MD animals, KO brains have slightly lower densities than WT brains (Fig. 6A, open bars; p = 0.006 SNK post hoc), but no difference in terminal size (Fig. 6B; WT labeled vs WT unlabeled, p < 0.001 Mann–Whitney U; KO labeled vs KO unlabeled, p < 0.001 Mann–Whitney U).
Figure 6.

EM reveals baseline synapse deficit between WT and Cx3cr1 KO brains. A, The volumetric density of synapses in animals with unmanipulated vision shows a baseline difference between WT and Cx3cr1 KO brains such that KO animals have a higher density of labeled thalamocortical synapses (p = 0.006; filled bars) and a lower density of unlabeled corticocortical synapses (p = 0.020; open bars). B, Though the population of unlabeled synaptic terminals (dashed lines) are no different between non-MD genotypes (p = 0.580), there is, however, a significant difference between the terminal sizes of labeled synapses between WT and Cx3cr1 KO brains (solid lines; Mann–Whitney U test, p = 0.005). The populations of both genotypes are significantly different between labeled and unlabeled terminal sizes (WT, p < 0.001; KO, p < 0.001; n = 3 WT animals, 3 KO animals; terminal n = 489 labeled WT, 473 labeled KO, 1243 unlabeled WT, and 1014 unlabeled KO; post hoc tests *p < 0.05 after ANOVA, **p < 0.01; #p < 0.005, Mann–Whitney U test).
Unlabeled synapse density increases following brief lid suture in WT and Cx3cr1 KO brains
Populations of axons originating from the thalamus or from within the cortex itself have different baseline dynamics and reactiveness to sensory input (De Paola et al., 2006; Yamahachi et al., 2009). We were therefore curious whether unlabeled, presumptive corticocortical synapses of binocular cortex L4 would react differently to MD. In WT animals that had undergone 3 d of MD, we found a slight but significant increase in the density of putative corticocortical connections; the normalized volumetric density of unlabeled synapses increases following MD (Fig. 7A; WT, 0.79 ± 0.02 nm3; WT+MD, 0.85 ± 0.02 nm3; p = 0.004 SNK post hoc) with the same effect in KO animals (Fig. 7C; KO, 0.73 ± 0.03 nm3; KO+MD, 0.78 ± 0.01 nm3; p = 0.035 SNK post hoc).
Figure 7.

Intracortical synapses are denser following brief MD in both WT and KO animals. A, B, Following MD, WT brains have increased normalized volumetric densities of unlabeled synapses (A; p = 0.004) and no change in unlabeled terminal size (B; p = 0.067). C, D, In KO animals, MD also causes an increase in the unlabeled synapse normalized volumetric density (C; p = 0.035) and additionally an increase in unlabeled terminal size (D; p < 0.001; n = 3 WT, 3 WT+MD, 3 KO, and 6 KO+MD animals; terminal n = 1243 WT, 1410 WT+MD, 1014 KO, and 2228 KO+MD; post hoc tests, *p < 0.05 after ANOVA; **p < 0.01; #p < 0.005, Mann–Whitney U test).
Both WT and KO animals showed the classic phenotype of intracortical terminals being smaller than thalamocortical terminals (Fig. 6B, dashed lines; WT labeled vs WT unlabeled, p < 0.001; KO labeled vs KO unlabeled, p < 0.001 Mann–Whitney U). However, the way in which these unlabeled presynaptic terminals react to brief lid suture is significantly different: in WT animals, intracortical terminal size is unchanged following MD (Fig. 7B; median: WT, 0.19 μm2; WT+MD, 0.18 μm2; p = 0.067 Mann–Whitney U), whereas in KO animals, intracortical terminals increase in size following MD (Fig. 7D; median: KO, 0.19 μm2; KO+MD, 0.21 μm2, p < 0.001 Mann–Whitney U).
In summary, brief MD of WT animals causes a higher density of presumptive intracortical terminals with no change in their size, whereas in Cx3cr1 KO animals, brief MD results in a higher density of intracortical terminals and a small but significant increase in their size.
Brief lid suture increases lysosome content within microglia but does not affect migration in WT and Cx3cr1 KO animals
Three days of monocular lid suture results in decreased thalamocortical synaptic input to L4 of binocular V1 (Coleman et al., 2010; Khibnik et al., 2010). We hypothesized that if microglia are required for this process, there might be increased microglia recruitment to the location of this change in input. Using the microglia-specific antibody Iba-1, we did not find any difference in the density of Iba1-stained microglia in L4 of binocular V1 in WT animals whether or not they had undergone MD (Fig. 8B; WT, 192.50 ± 28.17 cells/mm2; WT+MD, 183.33 ± 24.00 cells/mm2; ANOVA MD condition, p = 0.968). When microglia are pathologically activated, surveying processes are retracted and soma size increases (Thomas, 1992). We found decreased microglial soma size as a result of brief MD in WT mice that is not statistically significant (Fig. 8C; WT, 81.81 ± 2.87 μm2; WT+MD, 73.26 ± 2.51μm2; ANOVA MD condition, p = 0.004; WT vs WT+MD, p = 0.059 SNK post hoc). This trend may be a consequence of increased microglial projection volume, similar to that found recently by Sipe et al. (2016), which enables increased parenchymal scanning following MD.
Figure 8.
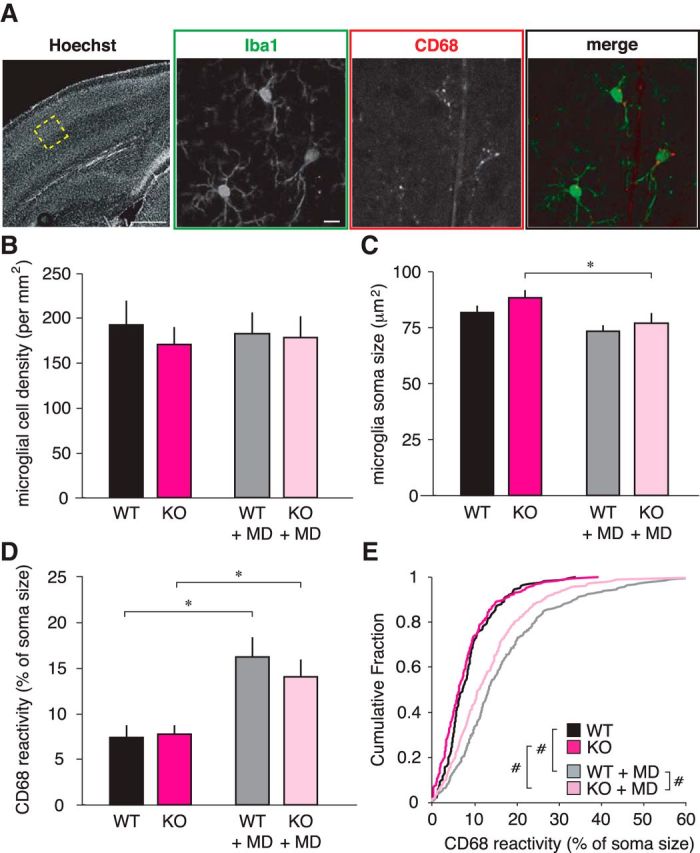
Microglia have increased lysosome content following brief MD. A, Example images of microglia in L4 of binocular V1 (cortical structure identified with Hoechst 33342; scale bar, 500 μm) stained with anti-Iba1 to label all microglia (green; scale bar, 10 μm), and anti-CD68 to label microglial lysosomes (red). In the merged image, the CD68 puncta are specific to microglial somas (except for blood vessels; note the faint vertical line running through the image). B, In the hemisphere contralateral to the deprived eye, the density of microglia in L4 is not different between genotypes (ANOVA genotypes, p = 0.572) or following MD (ANOVA MD condition, p = 0.968). C, The volume of the microglia soma (i.e., excluding ramified processes) decreases slightly in WT animals following MD, though not significantly (p = 0.059), as well as decreasing in KO animals (p = 0.014), which may be a product of increased ramification. D, Per animal averages of the amount of lysosome content within microglial somas increases following MD in both genotypes (WT, p = 0.003; KO, p = 0.026). E, Cumulative distributions of individual microglial CD68 increase following MD. On this per-microglia basis, CX3CR1 KO+MD microglia have less lysosome reactivity when compared with WT+MD microglia (WT vs KO, p = 0.093; WT vs WT+MD, p < 0.001; KO vs KO+MD, p < 0.001; WT+MD vs KO+MD, p = 0.001; post hoc tests, *p < 0.05 after 2-way ANOVA; #p < 0.005, Mann–Whitney U test; n = 4 WT, 4 WT+MD, 6 KO, 6 KO+MD animals).
When phagosomes engulf material, the endosome containing the foreign material fuses with lysosomes containing digestive enzymes (Peri and Nüsslein-Volhard, 2008). The presence of CD68, a lysosome membrane protein expressed in cells of myeloid origin (Song et al., 2011), can reflect microglial phagocytic state (Schafer et al., 2012; Tanaka et al., 2013). We therefore quantified CD68 immunoreactivity within microglia somas to determine whether there was increased lysosomal content following MD (Fig. 8A). We found a striking increase in microglia-specific CD68 staining in WT animals that underwent 3 d of MD (Fig. 8D; WT, 7.41 ± 1.40% soma size; WT+MD, 16.25 ± 2.19% soma size; ANOVA MD condition < 0.001; WT p = 0.003 SNK post hoc), and increased CD68 staining within individual microglia somas (Fig. 8E; WT vs WT+MD, p < 0.001 Mann–Whitney U).
Many previous studies have found a microglia recruitment deficit as a result of CX3CR1 deletion, which is consistent with its chemoattractant function. In KO animals, there is a transient deficit in microglia density in the developing hippocampus (Paolicelli et al., 2011) and increased microglia density in the white matter of the motor cortex (Ueno et al., 2013). However, a study of the mouse somatosensory cortex found no difference in microglia density in L4 of Cx3cr1 KO animals. The authors report a recruitment deficit, but at a finer level reflective of the thalamic input, suggesting that there may be small, specific microdomains (Hoshiko et al., 2012). Our findings parallel the somatosensory cortex data: we found no significant difference between the L4 microglia density in WT and Cx3cr1 KO mice in baseline conditions (Fig. 8B; KO, 171.25 ± 18.95 cells/mm2; ANOVA genotype, p = 0.572), and like WT animals, KO animals have no recruitment difference following lid suture (Fig. 8B; KO+MD, 178.57 ± 23.58 cells/mm2; ANOVA genotype MD interaction, p = 0.720). Also, similar to WT animals, Cx3cr1 KO microglia have significantly smaller soma sizes following MD (Fig. 8C; KO, 88.16 ± 3.45 μm2; KO+MD, 76.93 ± 4.59 μm2; p = 0.014 SNK post hoc).
Lysosomal content per animal also increases after MD in Cx3cr1 KO animals (Fig. 8D; KO, 7.76 ± 1.05% soma size; KO+MD, 14.04 ± 1.95% soma size). On an individual microglial cell basis, there is a significant difference following MD in the KO animals (Fig. 8E; KO vs KO+MD, p < 0.001 Mann–Whitney U). However, when comparing microglia of WT animals that have undergone MD to microglia of KO animals that have undergone MD, there is significantly less lysosome content in KO+MD microglia (Fig. 8E; WT+MD vs KO+MD, p = 0.001 Mann–Whitney U). This leads us to conclude that CX3CR1-deficient microglia are capable of reacting to changes in activity and upregulating their phagocytotic machinery, but to an extent slightly less than WT microglia.
Discussion
There is burgeoning interest in the role of microglia in removing synapses and axon arbors tagged for elimination during development, particularly with recent evidence that this process may go awry in developmental brain disorders, such as schizophrenia (van Berckel et al., 2008; Monji et al., 2009; Frick et al., 2013; Sekar et al., 2016) and autism (Vargas et al., 2005; Morgan et al., 2010; Tetreault et al., 2012; Chen et al., 2015). Synapses that have undergone functional long-term depression (LTD) have been shown to be subsequently eliminated (Zhou et al., 2004; Bastrikova et al., 2008), and there is abundant evidence that MD triggers both LTD and synapse elimination in the visual cortex (Cooke and Bear, 2014). Thus, OD plasticity provides an excellent opportunity to investigate the mechanism by which functionally depressed synapses might be tagged for elimination by microglia. In this study, we confirmed that 3 d of MD triggers the functional depression of deprived-eye responses and the shrinkage and loss of thalamocortical synapses in V1, and additionally showed that this period of synaptic remodeling is characterized by increased lysosomal content of microglia in L4. The microglia response to MD could simply reflect the removal of debris following synapse elimination, or it could represent the active participation of microglia in activity-dependent synaptic plasticity. Distinguishing between these two alternatives would require evidence of engulfment of thalamocortical synapses, and our attempts to detect engulfment of the vGluT2 antigen in visual cortex after MD failed. This outcome was not entirely unexpected, as this antigen proved to be difficult to detect in LGN microglia during pruning at earlier ages, even though retinogeniculate synapses express vGluT2 and are robustly engulfed by microglia (Schafer et al., 2012). Our interpretation is that the antigen is rapidly degraded after phagocytosis and is only detectable inside microglia when rates of engulfment are very high. In any case, although the hypothesis that microglia engulf and eliminate thalamocortical synapses following MD is supported by the increased lysosomal content of microglia, it remains to be tested definitively.
Coordinating microglial and synaptic responses to experience-dependent plasticity
To test the intriguing hypothesis that changes in neural activity are communicated to microglia via the fractalkine receptor to refine synaptic connectivity (Paolicelli et al., 2011), we studied visual development and plasticity in mice lacking CX3CR1. Our experiments show, however, that this receptor is not required for refinement of connections in the LGN by P30, for the maturation of visual responsiveness, for experience-induced and deprivation-induced plasticity in V1, for the structural remodeling of thalamocortical synapses, or for the increase in microglial lysosomal content in L4 after MD. We therefore conclude that neuron–microglia communication via fractalkine receptors is not required for the key features of OD plasticity in L4.
Our findings clearly indicate that one must look elsewhere to account for coordination of synaptic and microglial activity. A contemporaneous study, corroborating our finding of a microglial response following MD, showed that microglia of L2/3 hyper-ramify after MD and contain GluR1-inclusions (Sipe et al., 2016). Furthermore, this study showed that this microglial activation is abrogated by disrupting signaling mediated by the Gi/o-coupled purinergic receptor P2Y12. Of particular interest, the OD shift following MD was also absent in the P2Y12 KO mouse (Sipe et al., 2016). These exciting results are consistent with the hypothesis that microglia may indeed play an integral role in the synaptic response to MD, at least in the superficial layers of V1. Indeed, microglia express other receptors that mediate synaptic remodeling and synaptic function in other systems (Schafer et 2012; Parkhurst et al., 2013). In accordance with the findings of Sipe et al. (2016), we also find that unlike pathological activation of microglia, in which cell size typically increases, microglial size decreases after MD. These observations suggest that some markers of microglial activation can be regulated independently of those associated with pathological conditions.
Our study reveals heterogeneity in the role of CX3CR1 in cortical and hippocampal plasticity. In 1-month-old Cx3cr1 KO mice, there is a reduction in microglial density of the hippocampus (Paolicelli et al., 2011) and subsequent poor performance in hippocampal-dependent learning (Rogers et al., 2011). However, we found no deficit in the density of microglia of the visual cortex, and proficiency equal to WT animals in SRP, a form of visual learning. Apparently, microglia in the hippocampus use the chemotaxic guidance of CX3CR1 to contribute to learning, whereas they use other homing signals in the cortex. One key difference between plasticity in hippocampus and cortex is the existence of ongoing adult neurogenesis in the dentate gyrus, which is modulated by microglia and contributes to the mnemonic functions of this structure (Kitabatake et al., 2007; Gemma and Bachstetter, 2013).
Baseline differences in the visual cortex of WT and CX3CR1 KO mice
Our data appear to rule out a major role for fractalkine signaling in the development and plasticity of the visual cortex (of course with the caveat that visual functions not tested in our study may have been affected by the loss of CX3CR1). Nevertheless, in the course of our investigation, we did note several differences. Our EM data of animals with unmanipulated vision reveal a baseline difference between WT and Cx3cr1 KO animals. Thalamocortical synapses in KO brains are smaller, but more numerous. In ferret visual cortex, thalamocortical input and synapse density is a product of age; by adulthood, they have fewer thalamocortical synapses that are larger (Erisir and Dreusicke, 2005). It may be the case that the KO cortex is less mature than the age-matched WT cortex, which would parallel data found in the hippocampus (Paolicelli et al., 2011) and the barrel cortex (Hoshiko et al., 2012), suggesting an overall developmental delay in the brains of Cx3cr1 KO mice, but one that does not impact visual cortical plasticity. Our results are consistent with the synaptic multiplicity model of the KO hippocampus proposed by Zhan et al. (2014); it is possible that the presence of numerous weak, small thalamocortical synapses prevents the formation of large, strong synapses at a lower density.
Novel findings on the synaptic responses to MD and development of SRP
Our EM analysis on WT animals revealed that brief MD impacts unlabeled, presumably intracortical synapses. In a previous study, we showed that deprived-eye depression is associated with shrinkage and removal of thalamic input, but intracortical synapses were not included in the analysis (Coleman et al., 2010). An intriguing possibility is that the observed increase in unlabeled synapses is related to our finding of precocious strengthening of the nondeprived eye response in our experiments. Prevailing models of open-eye potentiation assume this occurs at thalamocortical synapses following a period of reduced cortical activity. Our EM data suggests that open-eye potentiation may also be a product of increased intracortical input. Adult SRP expression also requires intracortical inputs, as it apparently is not expressed at thalamocortical synapses (Cooke and Bear, 2014). These findings raise the possibility that corticocortical connections are the major substrate for response potentiation within V1.
Additionally, our study of juvenile SRP revealed a dramatic difference in the rate of SRP acquisition over the lifespan. Only a single session was required in juvenile mice to reach the same asymptotic potentiation that is observed following a week of exposure in the exact same adult mice. Pinpointing the age during which this transitions from one rate to another (between P25 and P60) could point to specific mechanisms for rapid synaptic potentiation available to the young brain that is lost during aging. The SRP protocol is extraordinarily robust and reliable, making it a promising method for screening interventions that could reopen juvenile adaptability.
Conclusion
The question of how the modification of synaptic function sculpts the anatomical organization of neural circuits in the brain is important. Although substantial progress has been made in recent decades identifying the synaptic mechanisms for experience-dependent visual cortical development and plasticity, little is known about how these early modifications ultimately manifest as modifications of entire axon arbors. An attractive hypothesis is that neuron-to-microglia communication plays an active role in pruning ineffective synapses and circuits, and fractalkine signaling is in an ideal position to mediate such communication. However, despite some evidence for a role for fractalkine signaling in synaptic changes in some brain regions, our thorough test of this hypothesis in the visual cortex has failed to reveal any significant contribution of CX3CR1 to the functional development of the visual cortex, or to the functional and structural consequences of early MD. Nevertheless, in the course of our studies we discovered that microglia in visual cortex L4 respond vigorously to MD at timepoints when synapses are undergoing functional depression and structural elimination. By ruling out an essential role for fractalkine signaling, our study narrows the search for understanding how microglia respond to active synapse modification in the visual cortex.
Footnotes
This work was supported by National Institutes of Health Grants R01-EY012309 and R01-EY0237 and by the Howard Hughes Medical Institute. We thank Arnie Heynen, Ming-Fai Fong, Weifeng Xu, and Troy Littleton for helpful scientific discussions, and Jeff Gavornik for creating custom stimulus generation Matlab analysis code. We thank Erik Sklar, Amanda Coronado, Suzanne Meagher, and Nina Palisano for technical and administrative support.
The authors declare no competing financial interests.
References
- Antonini A, Stryker MP (1993) Development of individual geniculocortical arbors in cat striate cortex and effects of binocular impulse blockade. J Neurosci 13:3549–3573. [DOI] [PMC free article] [PubMed] [Google Scholar]
- Antonini A, Fagiolini M, Stryker MP (1999) Anatomical correlates of functional plasticity in mouse visual cortex. J Neurosci 19:4388–4406. [DOI] [PMC free article] [PubMed] [Google Scholar]
- Bastrikova N, Gardner GA, Reece JM, Jeromin A, Dudek SM (2008) Synapse elimination accompanies functional plasticity in hippocampal neurons. Proc Natl Acad Sci U S A 105:3123–3127. 10.1073/pnas.0800027105 [DOI] [PMC free article] [PubMed] [Google Scholar]
- Beaulieu C, Colonnier M (1985) A laminar analysis of the number of round-asymmetrical and flat-symmetrical synapses on spines, dendritic trunks, and cell bodies in area 17 of the cat. J Comp Neurol 231:180–189. 10.1002/cne.902310206 [DOI] [PubMed] [Google Scholar]
- Benes FM, Lange N (2001) Two-dimensional versus three-dimensional cell counting: a practical perspective. Trends Neurosci 24:11–17. 10.1016/S0166-2236(00)01660-X [DOI] [PubMed] [Google Scholar]
- Boulanger LM. (2009) Immune proteins in brain development and synaptic plasticity. Neuron 64:93–109. 10.1016/j.neuron.2009.09.001 [DOI] [PubMed] [Google Scholar]
- Chen JA, Peñagarikano O, Belgard TG, Swarup V, Geschwind DH (2015) The emerging picture of autism spectrum disorder: genetics and pathology. Annu Rev Pathol 10:111–144. 10.1146/annurev-pathol-012414-040405 [DOI] [PubMed] [Google Scholar]
- Coleman JE, Nahmani M, Gavornik JP, Haslinger R, Heynen AJ, Erisir A, Bear MF (2010) Rapid structural remodeling of thalamocortical synapses parallels experience-dependent functional plasticity in mouse primary visual cortex. J Neurosci 30:9670–9682. 10.1523/JNEUROSCI.1248-10.2010 [DOI] [PMC free article] [PubMed] [Google Scholar]
- Colonnier M. (1968) Synaptic patterns on different cell types in the different laminae of the cat visual cortex. An electron microscope study. Brain Res 9:268–287. 10.1016/0006-8993(68)90234-5 [DOI] [PubMed] [Google Scholar]
- Cooke SF, Bear MF (2010) Visual experience induces long-term potentiation in the primary visual cortex. J Neurosci 30:16304–16313. 10.1523/JNEUROSCI.4333-10.2010 [DOI] [PMC free article] [PubMed] [Google Scholar]
- Cooke SF, Bear MF (2014) How the mechanisms of long-term synaptic potentiation and depression serve experience-dependent plasticity in primary visual cortex. Philos Trans R Soc Lond B Biol Sci 369:20130284. 10.1098/rstb.2013.0284 [DOI] [PMC free article] [PubMed] [Google Scholar]
- Cooke SF, Komorowski RW, Kaplan ES, Gavornik JP, Bear MF (2015) Visual recognition memory, manifested as long-term habituation, requires synaptic plasticity in V1. Nat Neurosci 18:262–271. 10.1038/nn.3920 [DOI] [PMC free article] [PubMed] [Google Scholar]
- DeFelipe J, Marco P, Busturia I, Merchán-Pérez A (1999) Estimation of the number of synapses in the cerebral cortex: methodological considerations. Cereb Cortex 9:722–732. 10.1093/cercor/9.7.722 [DOI] [PubMed] [Google Scholar]
- De Paola V, Holtmaat A, Knott G, Song S, Wilbrecht L, Caroni P, Svoboda K (2006) Cell type-specific structural plasticity of axonal branches and boutons in the adult neocortex. Neuron 49:861–875. 10.1016/j.neuron.2006.02.017 [DOI] [PubMed] [Google Scholar]
- Erisir A, Dreusicke M (2005) Quantitative morphology and postsynaptic targets of thalamocortical axons in critical period and adult ferret visual cortex. J Comp Neurol 485:11–31. 10.1002/cne.20507 [DOI] [PubMed] [Google Scholar]
- Erisir A, Harris JL (2003) Decline of the critical period of visual plasticity is concurrent with the reduction of NR2B subunit of the synaptic NMDA receptor in layer 4. J Neurosci 23:5208–5218. [DOI] [PMC free article] [PubMed] [Google Scholar]
- Erisir A, Levey AI, Aoki C (2001) Muscarinic receptor M(2) in cat visual cortex: laminar distribution, relationship to γ-aminobutyric acidergic neurons, and effect of cingulate lesions. J Comp Neurol 441:168–185. 10.1002/cne.1405 [DOI] [PubMed] [Google Scholar]
- Fagiolini M, Pizzorusso T, Berardi N, Domenici L, Maffei L (1994) Functional postnatal development of the rat primary visual cortex and the role of visual experience: dark rearing and monocular deprivation. Vision Res 34:709–720. 10.1016/0042-6989(94)90210-0 [DOI] [PubMed] [Google Scholar]
- Frenkel MY, Bear MF (2004) How monocular deprivation shifts ocular dominance in visual cortex of young mice. Neuron 44:917–923. 10.1016/j.neuron.2004.12.003 [DOI] [PubMed] [Google Scholar]
- Frenkel MY, Sawtell NB, Diogo AC, Yoon B, Neve RL, Bear MF (2006) Instructive effect of visual experience in mouse visual cortex. Neuron 51:339–349. 10.1016/j.neuron.2006.06.026 [DOI] [PubMed] [Google Scholar]
- Frick LR, Williams K, Pittenger C (2013) Microglial dysregulation in psychiatric disease. Clin Dev Immunol 2013:608654. 10.1155/2013/608654 [DOI] [PMC free article] [PubMed] [Google Scholar]
- Friedlander MJ, Martin KA, Wassenhove-McCarthy D (1991) Effects of monocular visual deprivation on geniculocortical innervation of area 18 in cat. J Neurosci 11:3268–3288. [DOI] [PMC free article] [PubMed] [Google Scholar]
- Garton KJ, Gough PJ, Blobel CP, Murphy G, Greaves DR, Dempsey PJ, Raines EW (2001) Tumor necrosis factor-α-converting enzyme (ADAM17) mediates the cleavage and shedding of fractalkine (CX3CL1). J Biol Chem 276:37993–38001. 10.1074/jbc.M106434200 [DOI] [PubMed] [Google Scholar]
- Gemma C, Bachstetter AD (2013) The role of microglia in adult hippocampal neurogenesis. Front Cell Neurosci 7:229. 10.3389/fncel.2013.00229 [DOI] [PMC free article] [PubMed] [Google Scholar]
- Gordon JA, Stryker MP (1996) Experience-dependent plasticity of binocular responses in the primary visual cortex of the mouse. J Neurosci 16:3274–3286. [DOI] [PMC free article] [PubMed] [Google Scholar]
- Hoshiko M, Arnoux I, Avignone E, Yamamoto N, Audinat E (2012) Deficiency of the microglial receptor CX3CR1 impairs postnatal functional development of thalamocortical synapses in the barrel cortex. J Neurosci 32:15106–15111. 10.1523/JNEUROSCI.1167-12.2012 [DOI] [PMC free article] [PubMed] [Google Scholar]
- Huang ZJ, Kirkwood A, Pizzorusso T, Porciatti V, Morales B, Bear MF, Maffei L, Tonegawa S (1999) BDNF regulates the maturation of inhibition and the critical period of plasticity in mouse visual cortex. Cell 98:739–755. 10.1016/S0092-8674(00)81509-3 [DOI] [PubMed] [Google Scholar]
- Hubel DH, Wiesel TN, LeVay S (1977) Plasticity of ocular dominance columns in monkey striate cortex. Philos Trans R Soc Lond B Biol Sci 278:377–409. 10.1098/rstb.1977.0050 [DOI] [PubMed] [Google Scholar]
- Jung S, Aliberti J, Graemmel P, Sunshine MJ, Kreutzberg GW, Sher A, Littman DR (2000) Analysis of fractalkine receptor CX(3)CR1 function by targeted deletion and green fluorescent protein reporter gene insertion. Mol Cell Biol 20:4106–4114. 10.1128/MCB.20.11.4106-4114.2000 [DOI] [PMC free article] [PubMed] [Google Scholar]
- Khibnik LA, Cho KK, Bear MF (2010) Relative contribution of feedforward excitatory connections to expression of ocular dominance plasticity in layer 4 of visual cortex. Neuron 66:493–500. 10.1016/j.neuron.2010.04.012 [DOI] [PMC free article] [PubMed] [Google Scholar]
- Kitabatake Y, Sailor KA, Ming GL, Song H (2007) Adult neurogenesis and hippocampal memory function: new cells, more plasticity, new memories? Neurosurg Clin N Am 18:105–113, x. 10.1016/j.nec.2006.10.008 [DOI] [PMC free article] [PubMed] [Google Scholar]
- Liu CH, Heynen AJ, Shuler MG, Bear MF (2008) Cannabinoid receptor blockade reveals parallel plasticity mechanisms in different layers of mouse visual cortex. Neuron 58:340–345. 10.1016/j.neuron.2008.02.020 [DOI] [PubMed] [Google Scholar]
- May OL, Erisir A, Hill DL (2008) Modifications of gustatory nerve synapses onto nucleus of the solitary tract neurons induced by dietary sodium-restriction during development. J Comp Neurol 508:529–541. 10.1002/cne.21708 [DOI] [PMC free article] [PubMed] [Google Scholar]
- Merchán-Pérez A, Rodriguez JR, Alonso-Nanclares L, Schertel A, Defelipe J (2009) Counting synapses using FIB/SEM microscopy: a true revolution for ultrastructural volume reconstruction. Front Neuroanat 3:18. 10.3389/neuro.05.018.2009 [DOI] [PMC free article] [PubMed] [Google Scholar]
- Monji A, Kato T, Kanba S (2009) Cytokines and schizophrenia: microglia hypothesis of schizophrenia. Psychiatry Clin Neurosci 63:257–265. 10.1111/j.1440-1819.2009.01945.x [DOI] [PubMed] [Google Scholar]
- Morgan JT, Chana G, Pardo CA, Achim C, Semendeferi K, Buckwalter J, Courchesne E, Everall IP (2010) Microglial activation and increased microglial density observed in the dorsolateral prefrontal cortex in autism. Biol Psychiatry 68:368–376. 10.1016/j.biopsych.2010.05.024 [DOI] [PubMed] [Google Scholar]
- Nahmani M, Erisir A (2005) VGluT2 immunochemistry identifies thalamocortical terminals in layer 4 of adult and developing visual cortex. J Comp Neurol 484:458–473. 10.1002/cne.20505 [DOI] [PubMed] [Google Scholar]
- Nimmerjahn A, Kirchhoff F, Helmchen F (2005) Resting microglial cells are highly dynamic surveillants of brain parenchyma in vivo. Science 308:1314–1318. 10.1126/science.1110647 [DOI] [PubMed] [Google Scholar]
- Paolicelli RC, Bolasco G, Pagani F, Maggi L, Scianni M, Panzanelli P, Giustetto M, Ferreira TA, Guiducci E, Dumas L, Ragozzino D, Gross CT (2011) Synaptic pruning by microglia is necessary for normal brain development. Science 333:1456–1458. 10.1126/science.1202529 [DOI] [PubMed] [Google Scholar]
- Parkhurst CN, Yang G, Ninan I, Savas JN, Yates JR 3rd, Lafaille JJ, Hempstead BL, Littman DR, Gan WB (2013) Microglia promote learning-dependent synapse formation through brain-derived neurotrophic factor. Cell 155:1596–1609. 10.1016/j.cell.2013.11.030 [DOI] [PMC free article] [PubMed] [Google Scholar]
- Peri F, Nüsslein-Volhard C (2008) Live imaging of neuronal degradation by microglia reveals a role for v0-ATPase a1 in phagosomal fusion in vivo. Cell 133:916–927. 10.1016/j.cell.2008.04.037 [DOI] [PubMed] [Google Scholar]
- Peters A, Palay SL, Webster HD (1991) The fine structure of the nervous system: neurons and their supporting cells, 3rd edition New York: Oxford UP. [Google Scholar]
- Prusky GT, Douglas RM (2003) Developmental plasticity of mouse visual acuity. Eur J Neurosci 17:167–173. 10.1046/j.1460-9568.2003.02420.x [DOI] [PubMed] [Google Scholar]
- Rogers JT, Morganti JM, Bachstetter AD, Hudson CE, Peters MM, Grimmig BA, Weeber EJ, Bickford PC, Gemma C (2011) CX3CR1 deficiency leads to impairment of hippocampal cognitive function and synaptic plasticity. J Neurosci 31:16241–16250. 10.1523/JNEUROSCI.3667-11.2011 [DOI] [PMC free article] [PubMed] [Google Scholar]
- Sawtell NB, Frenkel MY, Philpot BD, Nakazawa K, Tonegawa S, Bear MF (2003) NMDA receptor-dependent ocular dominance plasticity in adult visual cortex. Neuron 38:977–985. 10.1016/S0896-6273(03)00323-4 [DOI] [PubMed] [Google Scholar]
- Schafer DP, Lehrman EK, Kautzman AG, Koyama R, Mardinly AR, Yamasaki R, Ransohoff RM, Greenberg ME, Barres BA, Stevens B (2012) Microglia sculpt postnatal neural circuits in an activity and complement-dependent manner. Neuron 74:691–705. 10.1016/j.neuron.2012.03.026 [DOI] [PMC free article] [PubMed] [Google Scholar]
- Sekar A, Bialas AR, de Rivera H, Davis A, Hammond TR, Kamitaki N, Tooley K, Presumey J, Baum M, Van Doren V, Genovese G, Rose SA, Handsaker RE, Handsaker RE, Daly MJ, Carroll MC, Stevens B, McCarroll SA (2016) Schizophrenia risk from complex variation of complement component 4. Nature 530:177–183. 10.1038/nature16549 [DOI] [PMC free article] [PubMed] [Google Scholar]
- Shatz CJ, Stryker MP (1978) Ocular dominance in layer IV of the cat's visual cortex and the effects of monocular deprivation. J Physiol 281:267–283. 10.1113/jphysiol.1978.sp012421 [DOI] [PMC free article] [PubMed] [Google Scholar]
- Sheridan GK, Murphy KJ (2013) Neuron-glia crosstalk in health and disease: fractalkine and CX3CR1 take centre stage. Open Biol 3:130181. 10.1098/rsob.130181 [DOI] [PMC free article] [PubMed] [Google Scholar]
- Sipe GO, Lowery RL, Tremblay MÈ, Kelly EA, Lamantia CE, Majewska AK (2016) Microglia P2Y12 is necessary for synaptic plasticity in mouse visual cortex. Nat Commun 7:10905. 10.1038/ncomms10905 [DOI] [PMC free article] [PubMed] [Google Scholar]
- Song L, Lee C, Schindler C (2011) Deletion of the murine scavenger receptor CD68. J Lipid Res 52:1542–1550. 10.1194/jlr.M015412 [DOI] [PMC free article] [PubMed] [Google Scholar]
- Stevens B, Allen NJ, Vazquez LE, Howell GR, Christopherson KS, Nouri N, Micheva KD, Mehalow AK, Huberman AD, Stafford B, Sher A, Litke AM, Lambris JD, Smith SJ, John SW, Barres BA (2007) The classical complement cascade mediates CNS synapse elimination. Cell 131:1164–1178. 10.1016/j.cell.2007.10.036 [DOI] [PubMed] [Google Scholar]
- Tanaka Y, Matsuwaki T, Yamanouchi K, Nishihara M (2013) Increased lysosomal biogenesis in activated microglia and exacerbated neuronal damage after traumatic brain injury in progranulin-deficient mice. Neuroscience 250:8–19. 10.1016/j.neuroscience.2013.06.049 [DOI] [PubMed] [Google Scholar]
- Tetreault NA, Hakeem AY, Jiang S, Williams BA, Allman E, Wold BJ, Allman JM (2012) Microglia in the cerebral cortex in autism. J Autism Dev Disord 42:2569–2584. 10.1007/s10803-012-1513-0 [DOI] [PubMed] [Google Scholar]
- Thomas WE. (1992) Brain macrophages: evaluation of microglia and their functions. Brain Res Brain Res Rev 17:61–74. 10.1016/0165-0173(92)90007-9 [DOI] [PubMed] [Google Scholar]
- Tremblay MÈ, Lowery RL, Majewska AK (2010) Microglial interactions with synapses are modulated by visual experience. PLoS Biol 8:e1000527. 10.1371/journal.pbio.1000527 [DOI] [PMC free article] [PubMed] [Google Scholar]
- Ueno M, Fujita Y, Tanaka T, Nakamura Y, Kikuta J, Ishii M, Yamashita T (2013) Layer V cortical neurons require microglial support for survival during postnatal development. Nat Neurosci 16:543–551. 10.1038/nn.3358 [DOI] [PubMed] [Google Scholar]
- van Berckel BN, Bossong MG, Boellaard R, Kloet R, Schuitemaker A, Caspers E, Luurtsema G, Windhorst AD, Cahn W, Lammertsma AA, Kahn RS (2008) Microglia activation in recent-onset schizophrenia: a quantitative (R)-[11C]PK11195 positron emission tomography study. Biol Psychiatry 64:820–822. 10.1016/j.biopsych.2008.04.025 [DOI] [PubMed] [Google Scholar]
- Vargas DL, Nascimbene C, Krishnan C, Zimmerman AW, Pardo CA (2005) Neuroglial activation and neuroinflammation in the brain of patients with autism. Ann Neurol 57:67–81. 10.1002/ana.20315 [DOI] [PubMed] [Google Scholar]
- Yamahachi H, Marik SA, McManus JN, Denk W, Gilbert CD (2009) Rapid axonal sprouting and pruning accompany functional reorganization in primary visual cortex. Neuron 64:719–729. 10.1016/j.neuron.2009.11.026 [DOI] [PMC free article] [PubMed] [Google Scholar]
- Yoon BJ, Smith GB, Heynen AJ, Neve RL, Bear MF (2009) Essential role for a long-term depression mechanism in ocular dominance plasticity. Proc Natl Acad Sci U S A 106:9860–9865. 10.1073/pnas.0901305106 [DOI] [PMC free article] [PubMed] [Google Scholar]
- Zhan Y, Paolicelli RC, Sforazzini F, Weinhard L, Bolasco G, Pagani F, Vyssotski AL, Bifone A, Gozzi A, Ragozzino D, Gross CT (2014) Deficient neuron-microglia signaling results in impaired functional brain connectivity and social behavior. Nat Neurosci 17:400–406. 10.1038/nn.3641 [DOI] [PubMed] [Google Scholar]
- Zhou Q, Homma KJ, Poo MM (2004) Shrinkage of dendritic spines associated with long-term depression of hippocampal synapses. Neuron 44:749–757. 10.1016/j.neuron.2004.11.011 [DOI] [PubMed] [Google Scholar]