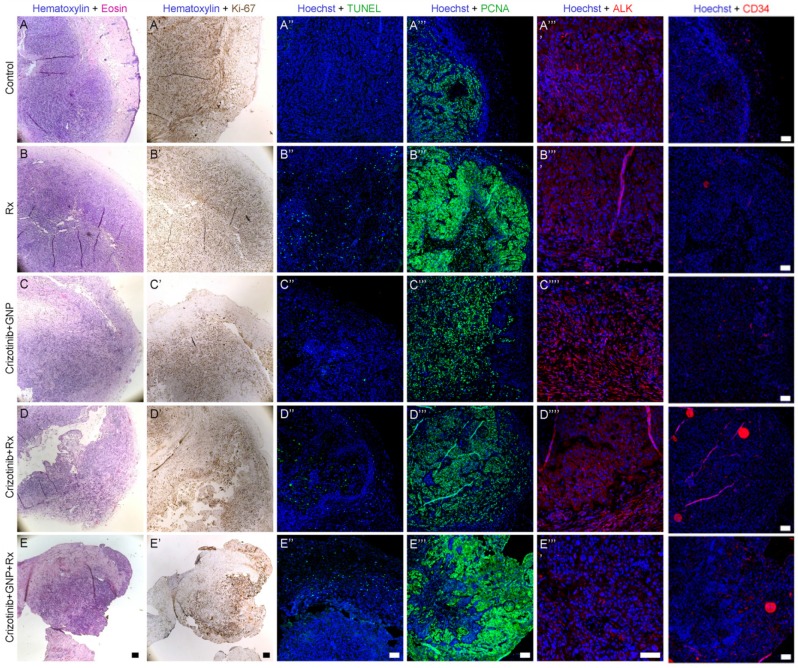
Figure 6.
Histological characterization 24 days post treatments. Representative images of tumor sections and adjacent tissue are presented. Shown are saline administration (no treatment, A-A''''), radiation only (B-B''''), crizotinib-GNP (C-C''''), crizotinib-radiation (D-D'''') and radiation-crizotinib-GNP (E-E''''). Sections were stained with H&E (A-E), Ki-67 (A'-E', brown); TUNEL (A''-E'', green), PCNA (A'''-E''', green) ALK (A''''-E'''', red) and CD34 (red). Rx= radiation. Bar = 100 µm. Immunostaining intensity was analyzed using LSM software.

