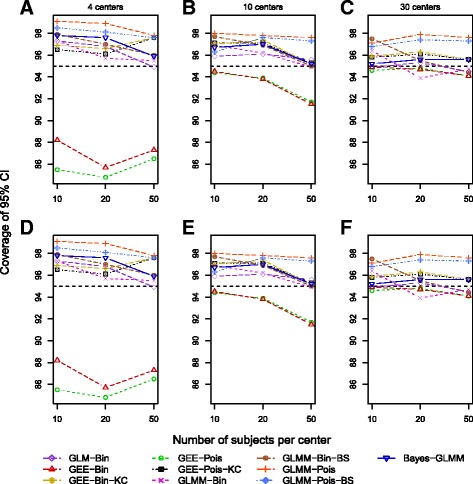
Fig. 3.

Coverage of 95% CI and posterior interval of β1 for scenarios under randomized controlled trial study designs (a–c) and observational study designs (d–f) based on 1000 simulations for each scenario. All scenarios used a β1 of log(1.5), control outcome rate of 15%, and an intracluster correlation coefficient of 0.08. GEE Generalized estimating equation, GLM-Bin Log-binomial regression model, GLMM Generalized linear mixed model, KC Kauermann and Carroll, BS Bootstrap
