Abstract
We present a fast and simple algorithm to detect nascent RNA transcription in global nuclear run-on sequencing (GRO-seq). GRO-seq is a relatively new protocol that captures nascent transcripts from actively engaged polymerase, providing a direct read-out on bona fide transcription. Most traditional assays, such as RNA-seq, measure steady state RNA levels which are affected by transcription, post-transcriptional processing, and RNA stability. GRO-seq data, however, presents unique analysis challenges that are only beginning to be addressed. Here we describe a new algorithm, Fast Read Stitcher (FStitch), that takes advantage of two popular machine-learning techniques, hidden Markov models (HMMs) and logistic regression, to classify which regions of the genome are transcribed. Given a small user-defined training set, our algorithm is accurate, robust to varying read depth, annotation agnostic, and fast. Analysis of GRO-seq data without a priori need for annotation uncovers surprising new insights into several aspects of the transcription process.
Index Terms: GRO-seq, Nascent Transcription, Logisitic Regression, Hidden Markov Models, Algorithms, Experimentation
1 Introduction
Almost all cellular stimulation triggers global transcriptional changes. To date, most studies of transcription have employed RNA-seq or microarrays, powerful measures of steady state RNA levels. Unfortunately, steady state levels can be influenced by not only transcription but also RNA stability, so these assays are not true measures of transcription. Only recently have methods for direct measurement of transcription, genome-wide, become available. A technique, known as global run-on sequencing (GRO-seq), simultaneously detects the amount and direction of actively engaged RNA polymerases at every position within the genome [1]. GRO-seq has already drastically influenced our understanding of the transcription process, as most of the genome is transcribed but rapidly degraded [2], [3], [4].
The earliest and most common approach to GRO-seq analysis is annotation centric [1], [5], [6], [7]. Yet much of transcription does not overlap protein coding annotations and appears to be noncoding [8]. In particular, one class of nascent noncoding transcripts originate from enhancers, or regulatory regions within the genome. While the ENCODE project made major inroads on identifying these critical regulatory regions [8], their precise boundaries are still dif-ficult to ascertain, so they remain largely unannotated. The transcripts that originate from these enhancers, known as eRNAs, are unstable and lowly expressed but do appear to be critical to their regulatory activity [9], [10], [11], [12], [13]. They are detectable in GRO-seq and tend show bidirectional transcription [14]. Therefore, the unbiased identification of all regions of transcription from GRO-seq is an important and pressing problem.
To the best of our knowledge only two efforts have attempted to identify regions of active transcription directly from GRO-seq data [15], [16], [17], though neither is fully independent of annotation. The first used a two state Hidden Markov model by Hah et. al. that was parametrized based on available annotations [16]. This approach has the advantage of calling large contiguous regions as transcribed, but fails to call many unannotated regions because their length and transcription levels do not mimic well annotated regions. Furthermore, the approach is limited in its ability to discover transcripts that conflict with the annotation. A more recent approach, called Vespucci, uses a sliding-window (specified by two user-dependent parameters) that merges adjacent windows together based on read depth, but requires the user to tune the algorithm with each new dataset [15]. The windowing scheme, in principle, has the benefit of not depending on annotation. In practice, however, because regions of transcription are often broken into discontiguous sections, Vespucci requires the use of annotations to improve its strategy [15].
Our approach combines the strengths of these previous efforts [15], [16]. In particular, we propose a fast and robust method that takes advantage of a logistic regression classifier embedded within a hidden Markov model as a means of learning non-linear decision boundaries that classify regions of active nascent transcription. This approach shares a similar structure with Maximum Entropy Markov Models [18]. Our methodology is annotation agnostic, requiring only a small number of training examples to adapt parameters to new data. It effectively identifies cohesive regions of active transcription while maintaining a rapid runtime. Furthermore, the identification of transcripts solely from the signal within the data uncovers distinct biological phenomena previously missed in GRO-seq analysis. Finally, user-friendliness was a large consideration in the design and structure of the software. This paper is an extended version of our earlier conference paper [19]. Here we extend upon our previous work by describing a method to compare two datasets based on the transcribed regions called by our algorithm. Using this differential transcription method, we re-analyze our earlier [20] GRO-seq dataset at both previously unannotated transcripts and annotated genes, demonstrating many of the earlier calls were annotation based artifacts. Shockingly, we demonstrate that the major response to activating p53, is increased transcription of p53’s own binding site.
2 Materials and Methods
2.1 Algorithm Description
The GRO-seq technique measures nascent transcripts produced from actively engaged RNA polymerases [1]. Because splicing has not yet occurred, each transcript covers a contiguous region of the underlying genome, reflecting the extent of polymerase activity. Sequencing reads obtained from the GRO-seq protocol represent a sample from the underlying transcripts in proportion to their relative abundances. Ideally, overlapping reads could be merged into contigs, or regions of continuous read coverage, defining regions of active transcription. However, because of uneven sampling, coverage within active regions may not be contiguous. Furthermore, the sequencing and mapping process is noisy, therefore reads can also spuriously map to inactive regions.
Transcription can be modeled as a discrete time-series indexed by genomic coordinates where transcriptional activity observed at adjacent base-pairs is correlated. Similar to prior models of GRO-seq [16], we model this process as an ergodic first-order Markov chain where transcription oscillates between active and inactive states. Unlike previous models, which classify individual nucleotides, our model emits from each state a contig representative of an active or inactive region (Figure 1). Each contig can be described by two feature classes: contig length (maximum length of overlapping reads) and contig coverage statistics (Table S1). Active states, in general, contain a combination of long regions with high signal interspersed with short regions of relatively no signal. Hence our HMM framework allows for the classification of a continuous active region, containing one or more contigs, despite the variability in coverage of individual nucleotides that is inherent in short read sequencing data.
Fig. 1. A schematic showing how contig length and coverage statistics discriminate active from inactive nascent transcription.
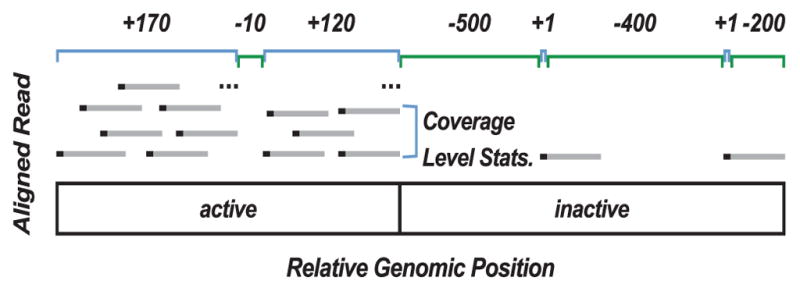
Regions of active transcription contain many long contigs (positive length, not drawn to scale) with significant read coverage (labeled in blue) interspersed with short regions of no coverage. Coverage statistics define mean, median, mode and variance of reads (black bars) across a contig, see Table S1. In segments with no reads, a gap (labeled in green) is defined by a negative length value and all coverage statistics are set to zero. For our algorithm, reads (grey bars) are represented by only their 5′ position (black points). Therefore a contig is also a continuous region where every base has at least one read’s 5′ end at that position. Consequently, small gaps between contigs have a high probability of being in an active call.
We must learn the emission and transition probabilities of each state from a training set. In our case, this set corresponds to manually labeled regions of active and inactive transcription. Given a training set, we learn the conditional probabilities of a state classification from the set of implicit feature vectors using logistic regression. Alternative approaches to feature vector modeling, like neural networks, were considered. However, we chose to use logistic regression for three reasons: it requires little training data for parameter estimation, it quickly converges, and it readily scales with genome size. The logistic regression predictors are interpretable as probabilities, and therefore easily embedded into a HMM as emissions. After the probability transitions of the underlying Markov chain have been estimated, the well-known decoding algorithms such as Viterbi and Forward/Backward can be used to infer the most probable state sequence [18].
2.2 Datasets
This study takes advantage of three previously published GRO-seq datasets (labeled here by the underlying cell line): MCF-7 [16], IMR90 [1] and our own HCT116 (DMSO and Nutlin, wild type p53) [20], as well as three published ChIP-Pol II datasets: HCT116 [21], IMR90 [22] and MCF7 [23]. For each experiment, raw reads were mapped to the hg19 genome using Bowtie2 with the command bowtie -S -t -v 2 -best [24]. A 5′ bedgraph is then generated using BedTools’s (2.16.2) genomeCoverageBed (options: −5 -bg -strand) for each strand. Additionally, the ENCODE project provided H3K27ac, H3K4me1, and DNase I hypersensitivity peak calls for IMR90 [14], [25], MCF7 [26], [27] and HCT116 [26], [28], as well as ChIA-PET peak calls for HCT116 [29]. Finally, to create a list of high confidence p53 binding sites, we combined the data from seven ChIP assays for p53 [30], [31], [32], [33] and kept only sites that were found in at least 3 of the 7 assays.
Because most nascent transcription is unstable and therefore understudied [4], we hand annotated the entire length of chromosome 1 in our earlier HCT116 GRO-seq DMSO dataset [20] to perform k-fold cross validation. Other training datasets were considered, such as using ChromHMM or Segway calls, but we sought to capture the nuances of nascent transcription rather than the features of earlier steady state algorithms. For all testing, 95% of the labeled dataset was removed from training and used to assess model accuracy. To be clear, the entire labeled HCT116 training set contains 17,776 regions labeled as active. Based on our cross validation results, 7 regions considered active and 7 regions considered inactive were used for parameter estimation in both the IMR90 and MCF7 GRO-seq datasets. These training sets (with genomic coordinates and labels) are provided in Supplemental Table S3.
2.3 Parameter Estimation
The Markov model transition probabilities and the conditional state emission probabilities of our HMM are estimated via a user defined, labeled training set. Given that read mapping can be noisy and nascent transcripts can be present at very low levels, estimating parameters that discriminate active from inactive transcription regions poses a difficult problem. However, we show in Section 3.1 that surprisingly little training data is needed to retain high model accuracy, which we define as the fraction of base pairs where the user-label and classification-label agree.
Here we outline our logistic regression parameter estimation method, for a detailed exposition see Ohno-Machado’s review [34]. We estimate the conditional probability p(k | x⃗), where k ∈ {inactive, active} and x⃗ indicates a feature vector, via a labeled training set of defined genomic coordinates representing active and inactive transcription regions. Table S1 provides a complete description of the feature vector x⃗. Clearly, p(inactive | x⃗) = 1 − p(active | x⃗). We represent the later probability in terms of the sum of the coordinates of x⃗, weighted by some parameter vector θ⃗. To treat this linear function as a probability, we bound the sum to the range [0,1] via the sigmoidal transformation as follows:
| (1) |
where
| (2) |
(n + 1) is the dimension of the feature vector x⃗, and θ0 is a bias term.
A simple plot of two features, gap length (x1) and average read coverage (x3), shows that these features may not be linearly separable (Figure 2A). Because of this, we employ a polynomial kernel (equation 3) to learn non linear decision boundaries (Figure 2B),
Fig. 2. Read coverage features are not linearly separable.
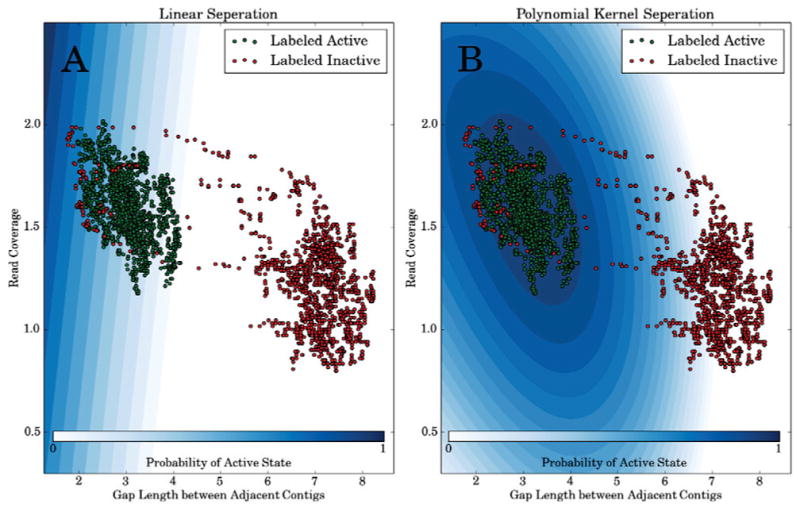
Points colored green represent training examples labeled active and those colored red indicate training examples labeled inactive. The blue shading provides a contour plot of the active state probability given the feature’s average read coverage (x3, y-axis) and the gap length between adjacent contigs (x1, x-axis in log nucleotides). (A) uses logistic regression with a linear kernel function (i.e. d = 1 in equation 3), whereas (B) uses a second-order polynomial kernel function (i.e. d = 2 in equation 3).
| (3) |
The polynomial kernel function parameters (c and d) can be set by the user in the FStitch software package. The kernel function is incorporated into the sigmoidal transformation as follows:
| (4) |
To maximize training and classification accuracy, the algorithm adjusts to the behavior of the feature space. The use of a simple second-order polynomial kernel (d = 2 and c = 0) increases the training accuracy by ~10% in the HCT116 GRO-seq dataset (Figure 5). Importantly, this ~10% increase reflects mostly lower expressed labeled transcripts suggesting that the use of the polynomial kernel allows for greater sensitivity to under-represented, lowly transcribed regions.
Fig. 5. FStitch requires little training data and is robust to low levels of GRO-seq read coverage.
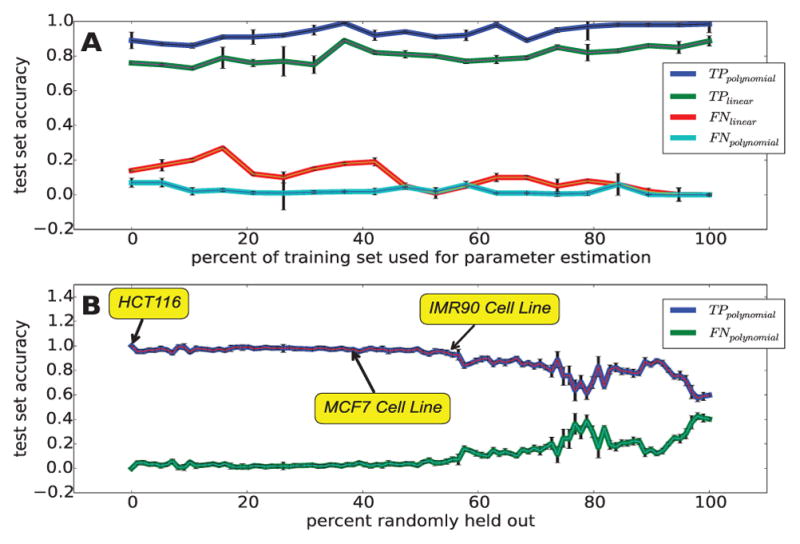
(A) Classification accuracy utilizing successively decreasing amounts of training data to learn feature vector weights, for the polynomial (d = 2 and c = 0; blue and teal) and linear (d = 1 and c = 0; green and red) kernel. (B) Classification accuracy with successively less sequencing depth (dataset size). In this case, we trained on 5% of all available chromosome 1 labels and tested on 50 different subsamples of the curated dataset. T P = true positive rate and F N = false negative rate.
To estimate the parameter vector θ⃗ we maximize the log-likelihood function of the training set D:
| (5) |
Here D can be thought of as a N × (n + 1) matrix where N is the number of training examples and (n + 1) is the dimension of our feature vector x⃗. The ith training label, ki, is either active or inactive.
We use the Newton-Raphson algorithm [35] to iteratively update θ⃗ until convergence. Because this techniques utilizes a second-order Taylor series approximation of the log-likelihood function, convergence is usually fast. The update rule is:
| (6) |
where ∇ and H represent the gradient and Hessian operators with respect to the vector θ⃗, respectively. Finally, the most probable state sequence is estimated via the Viterbi Algorithm [36], using the Maximum Entropy Markov model framework [18], and is given by the recurrence relation:
| (7) |
where aj→k represents the transition probability from state j to state k of the hidden Markov chain, which is estimated via Baum-Welch [18], S is the hidden transcriptional state space i.e. S = {active, inactive}, and is given in equation 3 with θ⃗ learned from the training data using the Newton-Raphson algorithm. Here is either a gap or contig representation given in Table S1.
Using training data to learn parameters allows users to intuitively provide regions of transcriptional characterization thereby doing away with arbitrary parameter values and grid parameter search for optimization. These parameters are learned from the data and thus adapt accordingly.
2.4 Detecting Enhancers as Divergent Transcription
Recent work indicates that enhancers are often transcribed, producing unstable bidirectional transcripts that are detectable by GRO-seq [10], [14]. Only one analysis approach has, thus far, tried to leverage this bidirectional signal towards the de novo discovery of enhancers from GRO-seq signal [14]. In that work, a Naïve Bayes classifier was trained on annotated regions in order to label unannotated 2kb windows either as bidirectional, single stranded transcription, or non-transcribed [14].
Therefore, we asked whether our FStitch approach could be extended to detect enhancer RNAs (eRNAs). Conceptually, our algorithm could simply ask for overlapping active calls between the positive and negative strand as potential eRNAs, similarly to the Naïve Bayes approach [14]. Unfortunately, it is unclear whether the transcripts on each strand overlap for all eRNAs as opposed to just being relatively close in proximity. Moreover, many genes have long non-coding RNA transcripts anti-sense to the gene, indicating that a simple overlap is not a stringent enough criterion for eRNA prediction. Furthermore, we expect to also detect the 5′-end of many genes because bidirectional transcription is also often observed at gene start sites [37].
Therefore, we sought to determine the extent to which two transcripts must overlap or be adjacent in order to accurately annotate eRNAs. Using our chromosome 1 manually annotated dataset, we examined the overlap of these regions to both a DNase I hypersensitivity site (DHS) and a H3K27ac mark, both well known indicators of enhancer activity [27], [38]. We then computed the distance to the nearest anti-sense FStitch call. We note that the displacement data show a Normal distribution (Figure S1). Therefore, we make a bidirectional call when two transcripts, one on each strand, are within some number of standard deviations of the fitted Normal distribution. The confidence level of bidirectional predictions is therefore subjectively defined by the user. In our subsequent analysis, bidirectional calls utilizes a confidence interval of two standard deviations, i.e. −1.5 kb to 2.25 kb (Figure S1).
2.5 Algorithm Input and Output
The purpose of FStitch is to segment the genome into regions of active and inactive nascent transcription. The algorithm accepts as input a 5′ BedGraph file (each read counted only at its 5′ end) of read coverage and a training set file consisting of a few segments (at least 3 segments) labeled as active or inactive regions of nascent transcription. The training file requires only start and stop coordinates of regions considered active and inactive yet, within these regions, the data should be rich in feature vectors (i.e. contig lengths and coverage statistics). As defaults, FStitch has pre-labeled active and inactive segments for a human genome based on house-keeping genes and gene desert regions, respectively. However, care must be taken with defaults as the transcriptional landscape varies from experiment to experiment and datasets need not be human or mapped to hg19.
FStitch outputs two bed files for positive and negative strand classifications, respectively, that can be imported into typical genome browsers such as IGV or the UCSC genome browser, to view the classifications in conjunction with read coverage files [39]. Figure 3 shows a typical output of the algorithm. These bed files contain the genomic start and stop of each classification and an associated probabilistic score from the Viterbi algorithm (Equation 7). From start to finish, FStitch takes ~3.5 minutes to predict transcript annotations in the most deeply sequenced GRO-seq dataset, HCT116 (152.4 million mapped reads) [20].
Fig. 3. FStitch output at BRPF3.
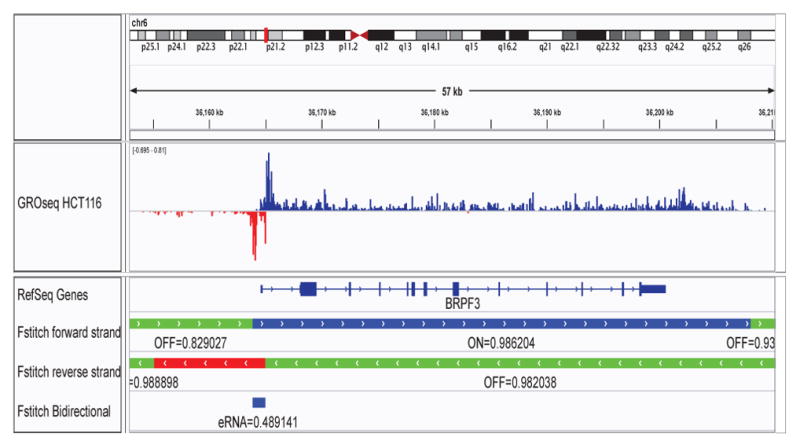
An IGV snapshot showing a subregion in chromosome 6 around BRPF3. The first track shows typical GRO-seq data from the HCT116 dataset, with the positive and negative strand in blue and red, respectively. RefSeq annotations are shown next. FStitch output is below for each strand with green indicating areas of inactive transcriptional activity, blue representing areas of active transcription on the positive strand and red on the negative strand. The scores associated with each classification via the Logistic Regression and Viterbi-provided Markov state sequence are also displayed. Finally, bidirectional predictions are provided at the bottom with a score via the estimated Normal Distribution confidence interval.
2.6 Differential Transcription
One of the primary goals of many GRO-seq experiments is the identification of differentially transcribed regions between two or more conditions. As we seek to compare FStitch based differential transcription to our earlier annotation based analysis of the HCT116 dataset, we first briefly describe the experiment and its earlier analysis (see [20] for complete details). Allen et. al. treated HCT116 cells with a small molecule activator of p53 known as Nutlin (or DMSO, a control) for one hour, then examined the transcriptional response by GRO-seq. Because genes are known to have a 5′ peak of read coverage that corresponds to polymerase initiation [1], [37], Allen et. al. focused on differential transcription over the gene body, defined by hg19 RefSeq (downloaded Oct 2012) annotations [40] minus the first 1 kilobase (kb). Differential transcription was determined using DESeq (v 1.4.1) [41] which runs in R (v 2.13.0) with the settings: cds <estimateSizeFactors(cds), method = ‘blind’, sharingMode = ‘fit-only’. Genes were called as differentially transcribed if they had an adjusted p-value less than or equal to 0.1.
When using annotation, the regions of interest (typically genes) are defined a priori. Numerous methods exist for assessing the statistical significance of changes in the read depth for a given region of the genome [41], [42]. These methods are applied routinely to most short read sequencing datasets, including RNA-seq (steady state RNA measurements) and ChIP-seq. Yet, with FStitch we allow the GRO-seq data to define the regions of transcription. Given that the two experiments we wish to compare may not have precisely the same regions transcribed, the first task is to determine the coordinates of regions of interest. Intuitively we can identify three distinct means of identifying regions of interest: (1) make active calls in one experiment and project these coordinates to the second experiment; (2) combine the raw read data for the two experiments, make active calls on this joint dataset, and use the coordinates of the resulting region; or (3) make active calls in both experiments independently and then merge the active calls based on genomic coordinates. We refer to these options as projection, joint, or merged, respectively.
We first sought to compare the projection, joint, and merge methods of identifying regions of interest from FStitch active calls. For the projection method we consider both experiments as the basis for active calls, using only DMSO (or Nutlin) to define the regions of interest. For the joint method, we first sub-sampled the reads from the Nut-lin experiment to match the depth of the DMSO experiment using samtools view (0.1.19). The Nutlin subsampled file was then combined with the DMSO reads using samtools for analysis by FStitch. Finally, for the merged method, FStitch was ran independently on the DMSO and Nutlin samples and active calls were combined keeping all regions called distinctly in either experiment (logical or; see Figure S2). Because the precise ends of an active call can be influenced by the read depth of the experiment, we then merged all regions smaller than 100 bp (See Figure S3) with an adjacent segment, unless both adjacent segments were large, meaning >100 bp, so as to minimizes concatenating nearby transcribed segments.
Using the same DESeq settings as Allen et. al., an examination of the DESeq generated MA-plots reveals many interesting properties of each approach (Figure 4). The projection method does not utilize all of the data to determine regions of interest which results in a bias, especially when one experiment has many more transcribed regions than the other. It is also directional and asymmetric, depending heavily on which experiment is used to define regions of interest (Figure 4A and B). The joint method requires proper normalization between experiments so as to not bias the results towards the experiment with greater depth. Additionally, it forces both experiments to a common coordinate system which is problematic when the length of an active call changes between the experiments (Figure 4C). Yet, a comparison of how the active calls shift in size between DMSO and Nutlin implies many regions change substantially (See Figure S3). The merged method requires a systematic means of handling arbitrarily complex overlap configurations, but has the potential to identify subregions of differential transcription. For these reasons, all subsequent analysis utilized the merge method of identifying regions of interest (Figure 4D).
Fig. 4. Examination of the impact of distinct approaches to identify regions of interest.
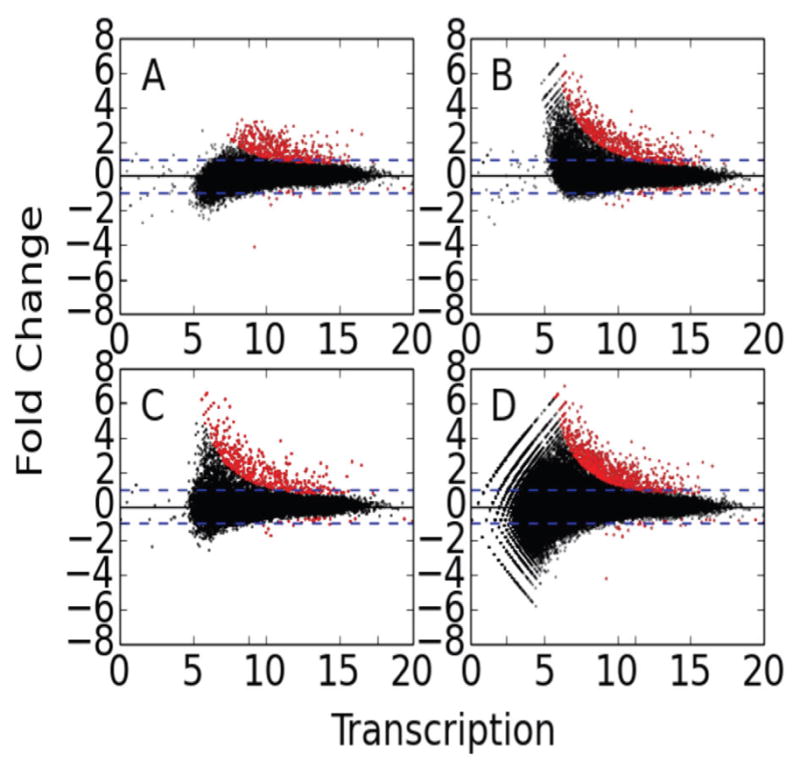
MA-plots were generated by DESeq for each of three distinct methods of determining differential transcription using FStitch active calls. The projection method has two variations, one starts with (A) the DMSO active calls and the other with (B) Nutlin active calls. The other methods are (C) joint and (D) the merge method. See text for details on each method.
2.7 Software Availability
FStitch is written in the C/C++ programming language and complied using GNU compilers later than GCC 4.2.1. The user interface is command line, resembling many popular bioinformatics pipelines. FStitch is stand-alone and borrows from no third-party platforms, libraries or packages. The open-source software and a comprehensive manual is freely downloadable at http://dowell.colorado.edu.
3 Results
We present a fast and simple algorithm to detect nascent RNA transcription in GRO-seq that is annotation agnostic and robust to low read depth. This section is loosely divided into four categories: (1) algorithm performances and benchmarking, (2) comparison to RefSeq annotation and previous methodologies, (3) validation of bidirectional predictions as enhancer RNAs, and (4) assessment of differential transcription given FStitch output.
3.1 Sensitivity to depth of data
To assess the sensitivity of the algorithm to the amount of training data, we hand curated the entire length of chromosome 1 in the HCT116 dataset, labeling regions as active or inactive. Our manual annotation identifies approximately 17,000 active and inactive regions, effectively labeling roughly 36% of chromosome 1 as active. We tested FStitch over this rich labeled data using K-fold cross validation, reserving 5% of the training data for parameter estimation and leveraging 95% for testing accuracy.
To assess the amount of training data needed for accurate classification of active regions, we incrementally decreased the amount of training data. Figure 5A shows that FStitch training is robust to successive decreases in the amount of training data utilized, suggesting that very little training data is needed to achieve relatively high accuracy. The smallest training set (0.1% of the initial dataset) consists of 3 active and 2 inactive regions and maintains scores of 95% true positive and 4.3% false negative on the testing dataset. Furthermore, we observe that the polynomial kernel consistently outperforms the linear kernel.
Similarly, we assessed the sensitivity of FStitch to experimental sequencing depth. To this end, we randomly subsampled (without replacement) from the HCT116 test dataset, the single experiment with the deepest read coverage. For each subsample, we re-estimated the parameters via a fixed training set, 5% of chromosome 1 labels. Subsequently, we reclassified active transcript segments and calculated the training accuracy relative to the test set. Figure 5B shows that our method is robust to low sequencing depth of the dataset.
3.2 Benchmarking FStitch & Vespucci
We sought to evaluate our algorithm, FStitch, to the previously published windowing method Vespucci [15]. We calculated model accuracy for Vespucci with the default parameters over the HCT116 test dataset (Table 1). In addition, we performed a grid search on a subset of ranges for both Max Edge and Density Multiplier combinations and reported the performance of the best parameters obtained for this dataset. Grid search optimization greatly increased Vespucci’s precision and recall. FStitch outperforms Vespucci, default or grid search, in both true negative and true positive classifications.
TABLE 1. Benchmarking FStitch and Vespucci.
Each algorithm, FStitch and Vespucci with default parameters (Max Edge: 500 and Density Multiplier: 10,000), and Vespucci with best parameters from a grid search, G.S. (Max Edge: 10 and Density Multiplier: 2,000), are compared on the manually annotated test set from chromosome 1. Overlap percentages are reported per base.
| Method | Prediction | Truth Set Label | |
|---|---|---|---|
| Active | Inactive | ||
| FStitch | Active | 98.5% | 1.5% |
| Inactive | 0.01% | 99.99% | |
| Vespucci (default) | Active | 60.7% | 30.3% |
| Inactive | 6.03% | 93.97% | |
| Vespucci (G.S.) | Active | 80.1% | 19.9% |
| Inactive | 0.56% | 99.44% | |
We next assessed the quality of FStitch active calls to independently derived relevant biological datasets. As GRO-seq measures all actively engaged polymerase, in a strand specific fashion, there is no single alternative experiment to confirm GRO-seq data. However, RNA polymerase II is responsible for most transcribed regions and therefore comparison to Pol II chromatin immunoprecipitation (ChIP should independently verify the location of most transcripts. To this end, we obtained previously published Pol II ChIP-seq data for MCF7, HCT116, and IMR90 cell lines [21], [22], [23]. Unfortunately, direct comparisons between GRO-seq and ChIP-seq are complicated by the fact that GRO-seq is strand specific whereas ChIP-seq is not. Yet, we reasoned that the superposition of reads along the sense and anti-sense strand within GRO-seq should approximate ChIP-Pol II read coverage within the same region.
Thus, an active call should have a higher enrichment of RNA Pol II ChIP-seq than an inactive call. In all three cell lines, we used FStitch to identify bidirectional, active and inactive calls. Vespucci does not contain an unbiased bidirectional transcription annotator, therefore only active and inactive predictions were obtained. For MCF7 we utilized the published list of Vespucci annotations but for both HCT116 and IMR90 we used the Vespucci parameters obtained via grid search (Table 1). We note that the Vespucci approach is less capable of distinguishing active from inactive regions as assessed by Pol II occupancy (Figure 6). We observe a significant enrichment for Pol II occupancy between active and inactive FStitch regions. Additionally, we observe a high degree of Pol II occupancy at bidirectional calls, as expected given that enhancers are known to show significant enrichment for Pol II occupancy [9].
Fig. 6. Correlation of GRO-seq transcript calls with Pol II ChIP-seq.
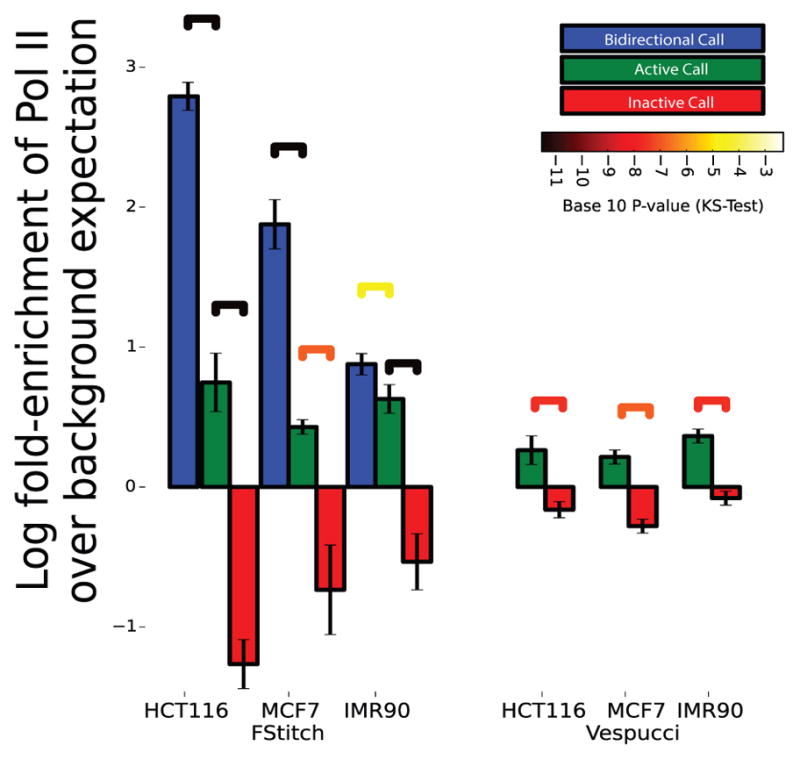
Pol-II ChIP-seq read density was collected in regions labeled as bidirectional (blue), active (green) or inactive (red) by either FStitch (on left) or Vespucci (on right). Log fold-enrichment is relative to average Pol-II ChIP-seq read density. Statistical significance is assessed via the Kolmogrov-Smirnov test (significance bars colored by p-value). Error bars indicate one standard deviation away from the mean.
3.3 Annotation Comparisons
We next sought to evaluate the performance of our algorithm on identifying biologically meaningful regions of active transcription by comparing the results of FStitch to RefSeq annotations. We first classified our active transcript calls on the HCT116 DMSO experiment by their overlap to genomic annotations. Most FStitch active calls overlap a known annotation: gene, antisense to a gene, long non-coding RNA (lncRNA), small nucleolar RNA (snoRNA), microRNA (miRNA) and transfer-RNA (tRNA) (Figure 7). Of the 26.75% of FStitch active calls that do not overlap known annotations, many can be described as bidirectional calls that overlap an H3K27ac mark; which is characteristic of an eRNA.
Fig. 7. Active Call Characterization.
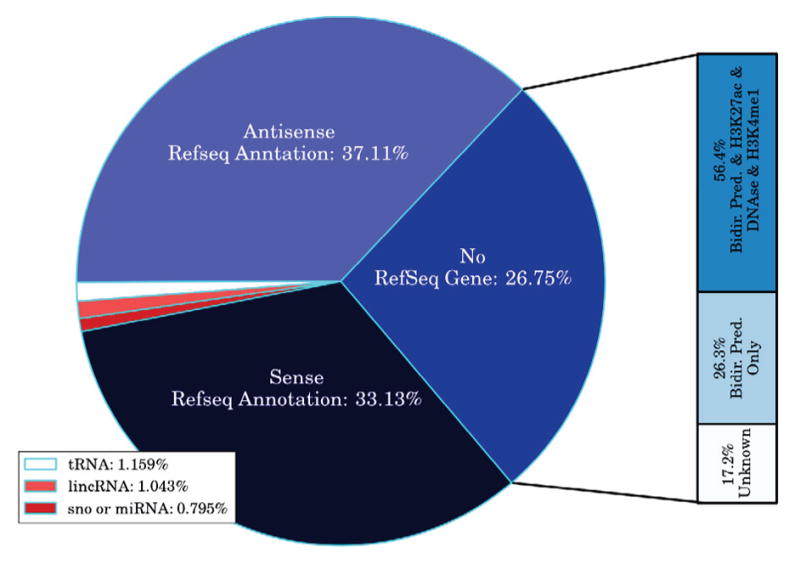
FStitch active calls on HCT116 DMSO are divided into classes based on overlap with genomic annotations. Unannotated active calls are assigned if they have no overlap to previous annotations on either strand. FStitch called 37,591 active regions.
Interestingly, within the unannotated active calls, a small fraction (9%) contain both an open reading frame that spans at least 60% of the length of the call and a bidirectional call at the 5′-end. These may be unannotated protein coding genes. We translated these regions and searched the UniProt/SwissProt protein database [43], uncovering several hits. By isolating the statistically significant hits and tokenizing the hit descriptions, we observed that more than 95% of all hits contained the reoccurring words putative, uncharacterized or encode.
Meta-gene analysis is a popular method of assessing the average behavior of an assay over gene annotations [44]. By taking advantage of the high read coverage of the HCT116 GRO-seq dataset, we constructed a meta-gene of FStitch active calls that completely overlap a RefSeq annotation (n=2512). For this analysis, we averaged the read coverage within 100 uniformly distributed proportions relative to the FStitch call (Figure 8). This uncovered two features of active regions: (1) the 3′-end peak is much larger than previously detected [1], [14] and (2) there is a corresponding small build up of reads along the anti-sense strand that mirrors the 3′-end peak. It should be noted that the 3′ peak does not always correlate well with the exact 3′-end of the annotation [45]. This is likely because the 3′-end of a gene annotation is typically the mRNA cleavage site and not the RNA Pol-II termination site.
Fig. 8. Average Read Coverage of FStitch active calls.
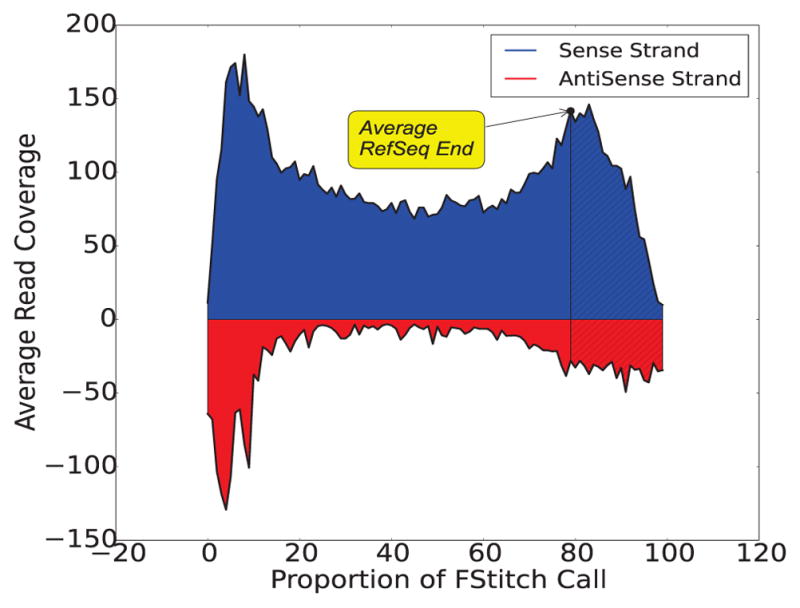
FStitch active calls on the positive strand that completely contain a RefSeq annotation were used to calculate the average behavior. Blue and red represent positive and negative strand coverage, respectively. For each active region, the length was divided into 100 uniformly sized proportions and the read coverage was averaged within each bin. The average annotated 3′ end is noted by the line and transcription beyond the annotation is shaded. Here, we require an FStitch to completely overlap a RefSeq annotation and the RefSeq annotation overlap at least 75% of the FStitch call.
Given that FStitch does not rely on previous annotations, we next ask how the ends (5′ and 3′) of FStitch active calls relate to known RefSeq gene annotation ends. Specifically, we measure the difference in genomic location between the 5′ end (3′ end) of an FStitch active call and the nearest RefSeq annotation 5′ end (3′ end), respectively. Interestingly, the GRO-seq signal often begins upstream of the annotated 5′ start site of RefSeq genes (Figure 9A). Indeed, there appears to be two distinct populations within the 5′ ends. Therefore, we fit a mixture of two Gaussian distributions using the Expectation Maximization algorithm [46] to the difference of 5′ ends histogram. We examined the upstream Gaussian distribution for distinguishing features and found it shows a 2.5 fold enrichment of anti-sense transcription compared to the Gaussian centered at roughly the zero position. This suggests that many genes have upstream bidirectional transcription, and therefore may may have overlapping or adjacent upstream enhancers [38] or promoter upstream transcripts [47]. We note that, in these cases, the upstream region and the annotated gene are a single active call.
Fig. 9. Histograms comparing the active region calls of FStitch to RefSeq annotations.
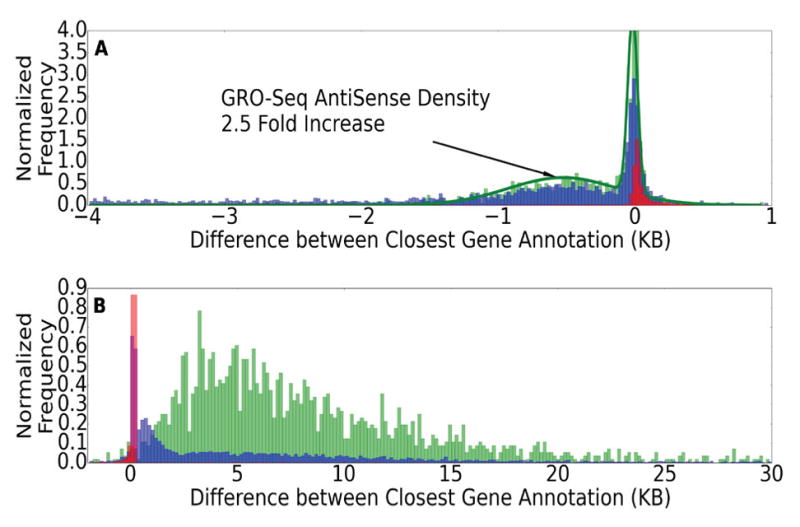
We plot the distance between the end of an active call and the nearest RefSeq annotation for (A) 5′-ends; (B) 3′-ends. Colors red, blue and green are Hah et. al., Vespucci (grid search parameters) and FStitch active calls, respectively. Histograms are probability normalized.
Additionally, we also see an elongation of several kilo-bases (average of ~8 kb) of GRO-seq signal past the 3′-end of annotated genes (Figure 9B); consistent with the fact that polymerase proceeds far beyond the mRNA cleavage site [45], [48]. Notably, the 3′ extension is missed by earlier GRO-seq de novo transcript detection algorithms [15], [16]. Indeed, Vespucci captures many of the same general trends of FStitch, but typically terminates 3′ extensions earlier. Upon further examination, this may reflect the fact that Vespucci’s default parameters are biased to highly expressed regions and the 3′ extensions are often weakly transcribed. On the other hand, the hidden Markov model of Hah et. al. was trained to match RefSeq annotations and is therefore unable to identify distinguishing features of nascent transcription at either end.
3.4 Characterizing bidirectional RNA Activity
We next sought to assess the accuracy of our bidirectional predictions genome-wide. As our goal is the identification of eRNAs, we first examined what fraction of our bidirectional calls overlap enhancer marks. For this analysis we excluded chromosome 1 (our training set) and used FStitch to predict bidirectional transcription in all three cell lines: IMR90, MCF7 and HCT116. In all cell lines, the bidirectional FStitch calls were significantly enriched for overlapping DNase I hypersensitivity sites and H3K27ac marks indicating that a large fraction of these calls are likely eRNAs (Table S2).
We hypothesized that bidirectional predictions that overlap enhancer marks will be highly transcribed, moreso than bidirectional predictions without corresponding enhancer marks (Figure S4). In all three cell lines, we see higher levels of bidirectional transcription when accompanied by a chromatin enhancer mark. As proof of concept, marks which do not overlap bidirectional prediction show little read density indicating that our false-negative rate is low (Figure S4, in red). Bidirectional predictions that overlap both a gene annotations and an enhancer mark show the highest level of average transcription. Moreover, we predicted 342, 241 and 198 bidirectional phenomena in the HCT116, MCF7 and IMR90 datasets, respectively, that do not overlap a chromatin enhancer mark but do show a GRO-seq transcription greater than the mean GRO-seq signal of bidirectional predictions overlapping a DNase I hypersensitivity site or H3K27ac mark. These highly expressed bidirectional regions may be, as of yet, undiscovered enhancers.
Next, we examined the theory that enhancer elements are three-dimensionally connected to their gene regulatory partner, an interaction that correlates with enhancer function [9], [10], [11], [12], [13]. To compare GRO-seq signal with three-dimensional chromatin interactions, we utilized a Pol II chromatin interaction analysis by paired-end tag sequencing (ChIA-PET) dataset in the HCT116 cell line [11]. ChIA-PET is a rather new high-throughput technique that pulls down a protein of interest (in this case Pol II) and provides information on long range chromatin interactions [29] associated with the protein. Therefore, we first examined the overlap between both FStitch active calls and bidirectional predictions with paired ChIA-PET reads. We see a highly significant overlap (hypergeometric; p-value < 10−10) between ChIA-PET reads and FStitch active calls.
Given the three dimensional association implied by ChIA-PET, we next sought to ascertain if interacting DNA regions show a correlated GRO-seq transcription signal. When assaying for GRO-seq signal utilizing only ChIA-PET read pairs, we found no correlation in transcription level (Pearson’s correlation coefficient; ρ = 0.001). However, when we isolate ChIA-PET read pairs that overlap both a bidirectional prediction and an active FStitch call on either end, we see a strikingly high correlation (ρ = 0.8301; Figure 10). Note that we do not include cases where the ChIA-PET read pairs overlap the same FStitch active call used to make the bidirectional prediction. Moreover, this linear relationship appears completely independent of genomic distance. This poses an obvious question: can we predict enhancer-gene interactions? Using a general linear model estimated from Figure 10, we attempted to predict enhancer-gene interactions using only GRO-seq transcription level. Unfortunately, only 7% of enhancer-gene interaction predictions were validated by ChIA-PET read pairs. This result suggests that while GRO-seq signal appears highly correlated between enhancers and their gene targets, additional information is needed to predict which enhancers are associated in three dimensions with particular FStitch active calls.
Fig. 10. Bidirectional predictions and active FStitch calls connected by a ChIA-PET read pair show correlated GRO-seq transcription.
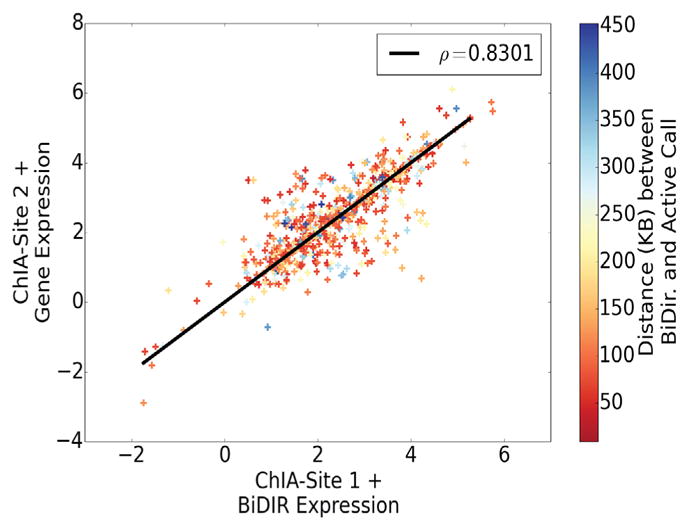
The GRO-seq transcription level of ChIA-PET read pairs that overlap a bidirectional call and an active call on either end are plotted, demonstrating a strong correlation (ρ = 0.8301) in transcription (as measured by GRO-seq). Points are colored according to genomic distance (kb) between bidirectional prediction and active call.
3.5 Differential transcription at annotated genes: a comparison of FStitch to Allen et. al
Finally, we sought to determine the extent to which an annotation agnostic approach (FStitch) alters our earlier annotation driven p53 GRO-seq data analysis [20]. In our earlier work we examined the direct transcriptional targets of the transcription factor p53 in HCT116 cells. In that experiment, p53 was activated by the non-genotoxic drug Nutlin (see [20] for complete details). Analysis was annotation centric but excluded the first 1 kb around the annotated start to avoid the initiation peak of polymerase. Furthermore, assessment of transcription over p53 binding sites was dependent on publicly available p53 ChIP-seq data.
We ran FStitch on the control GRO-seq (DMSO) and the p53 activated GRO-seq (Nutlin) independently. In total we found 37,591 active calls in DMSO and 39,097 active calls in the Nutlin treated sample. Many active calls in both DMSO and Nutlin overlap RefSeq annotated genes (annotation overlap for DMSO shown in Figure 7). In total, 16,191 (of 23,669) genes are transcribed in at least one of the two experiments. Interestingly four large genes called as differentially transcribed in Allen et. al. are not called as active by FStitch in either experiment. These genes appear to contain only scattered background reads (noise), but because of their massive size still contain a large total number of reads. The merged method was then used to identify regions of interest for assessing differential transcription between DMSO and Nutlin.
First we sought to examine the impact of the two distinct methods of determining differential transcription, namely FStitch active regions versus Allen et. al., at annotated genes. It is worth noting that DESeq is sensitive to the size of the input set (both in multiple hypothesis test correction and its variance estimate). Therefore to match the analysis of Allen et. al., we first examined only the set of FStitch active regions of interest that overlap annotated genes. With this set as input to DESeq, 293 regions are differentially transcribed, overlapping 289 distinct genes (Figure 11).
Fig. 11. The overlap between FStitch and Allen et. al. at RefSeq genes.
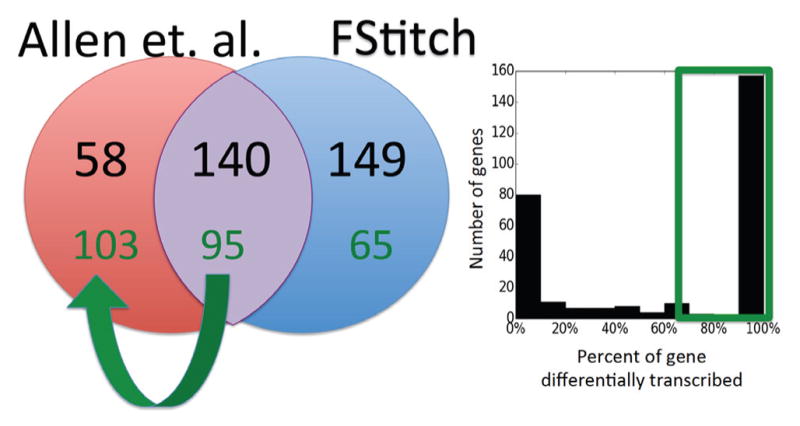
The gene sets called as differentially transcribed by the two methods, Allen et. al. (red) and FStitch (blue), are compared at gene annotations (black numbers). The histogram on the right shows the percentage of each annotated region that is called as differently transcribed by FStitch. When the overlap to a gene is required to be > 75% (green box), 129 genes are no longer called as differentially transcribed by FStitch, including 45 genes that were previously called by both methods.
By manual inspection, we noted that many FStitch regions of interest were much shorter than the annotated gene. Therefore we next required that for each gene at least 75% of the gene be called as differentially transcribed. From this we conclude that many genes, including 45 called in Allen et. al., do not show differential transcription along the full length of the gene. For example, PVRL4 (Figure 12) was called as differentially transcribed in Allen et. al. yet FStitch identifies that the signal for differential transcription is entirely driven by a distinct small subregion within the gene. Most of these differentially transcribed regions overlap FStitch bidirectional calls, implying that the annotation centric method was sometimes mislead by overlapping, fully contained enhancer.
Fig. 12. Differential Transcription at PVPR4.
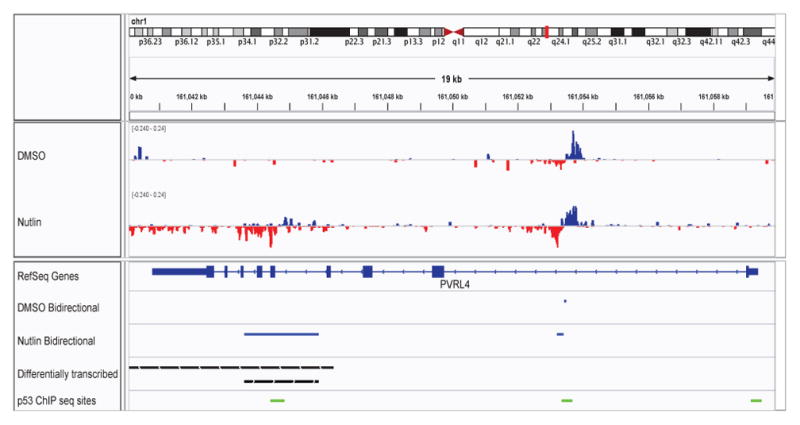
An IGV snapshot showing PVPR4, a negative strand gene where a small portion of the gene is differentially transcribed. The region of differential transcription (black bars) overlaps both FStitch bidirectional calls (blue bars) and p53 binding sites (green bars), indicating this may be an intragenic enhancer. The tracks, in order, are: histograms of the GRO-seq signal observed in DMSO and Nutlin, respectively (positive strand: blue; negative strand: red); RefSeq annotation for PVPR4; FStitch bidirectional calls in both DMSO and Nutlin, respectively (blue bars); FStitch differential transcription calls (black bars: top is negative strand, bottom is positive strand); location of p53 binding events (in green).
In several cases, the signal for differential transcription is not uniformly distributed across the transcribed region. The distribution of reads is not uniform, with most genes showing a 5′ peak, corresponding to polymerase initiation that is distinct from the read distribution within the gene. The Allen et. al. analysis excluded the first 1kb of each annotated region in an effort to examine only polymerase elongation through the body of the gene. With FStitch we consider the entirety of the active region. Consequently when differential transcription is driven primarily by read depth changes at the 5′ end, the gene is called by FStitch but missed in Allen et. al. Analogously, Allen et. al. calls genes where the gene body is changing but inclusion of the 5′ peak washes out the differential signal. Finally, there are cases where a gene is called in Allen et. al. but missed by FStitch because the active call overlapping the gene is much longer than the gene, a situation that arises in gene dense regions.
3.6 Differential transcription using all FStitch active calls
Importantly, FStitch is able to identify unannotated regions that are differentially transcribed. When DESeq considers all FStitch regions of interest, 1044 regions are called as differentially transcribed. Remarkably 75% of these regions do not overlap an annotated gene.
Because Allen et. al. found differential transcription at p53 binding events, we hypothesize that a large fraction of the unnanoted FStitch differentially transcribed regions would contain p53 binding events and/or p53 sequence motifs. Binding events for p53 were called as described in Allen et. al., except requiring consensus from three of the seven publicly available p53 ChIP datasets [20], [31]. Presence of the motif was determined by the publicly available p53 scanner algorithm, requiring a p-value < 0.01 [32]. Differentially transcribed regions, both those overlapping annotated and unannotated regions, are highly enriched for marks of p53 (either binding or motif). We note that because annotated regions tend to be much longer than unannotated, they are more likely to contain a p53 motif and/or ChIP site. In fact, most regions that are differentially transcribed (73%) overlap an experimentally determined p53 binding event.
Lastly, we sought to determine which unannotated FStitch differential transcription calls are themselves p53 enhancers. To this end, we examined their overlap with known enhancer marks H3K27ac, H3K4me1 and DNAse I hypersensitivity (Figure 14). Unannotated differentially transcribed FStitch calls are over enriched for enhancer marks, relative to background expectation. Indeed, the three enhancer marks (H3K27ac, H3K4me1 and DNAse I hypersensitivity) are more likely to co-occur in the differentially transcribed set. Interestingly, we also note that 21.2% of these regions are paired with another differentially transcribed FStitch call in the HCT116 ChIA-PET study. This overlap far exceeds the expectation (0.01%) that a random FStitch call will pair with a differentially transcribed partner by ChIA-PET.
Fig. 14. Overlap of differential transcription with enhancer marks.
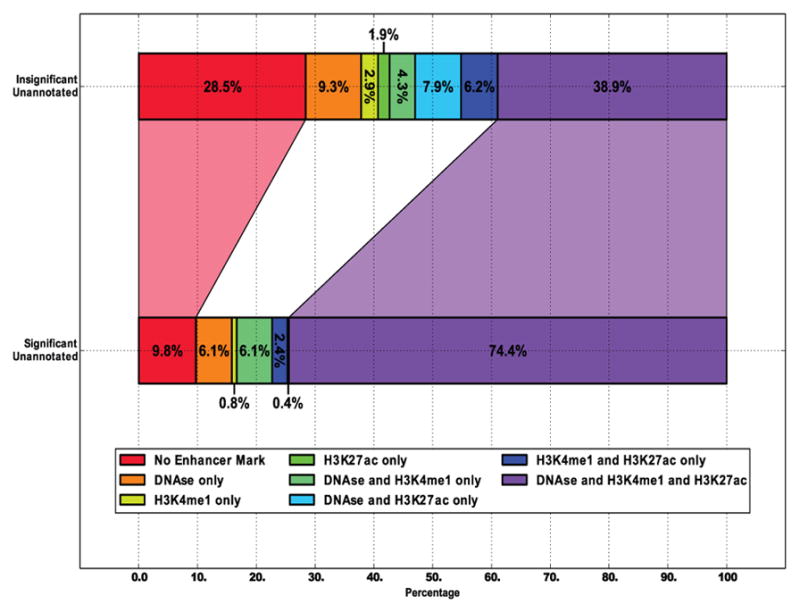
FStitch calls that do not overlap any RefSeq annotation were grouped by differential transcription by DESeq (significant: adj p-value < 0.1). Regions were assessed for overlap with enhancer marks: H3k27ac, H3K4me1, and DNAse I hypersensitivity [26], [28].
4 Discussion
We present a fast and robust algorithm, called FStitch, for the identification of transcripts within GRO-seq data that is annotation agnostic. Parameters of the algorithm are learned from small amounts of training data and can adapt readily to low depth of sequencing. By taking advantage of logistic regression, a non-linear classification of the feature space is learned. This classifier is then embedded within a Hidden Markov model framework, so as to identify contiguous segments of active transcription. The active calls from our algorithm correspond well to independently obtained secondary datasets (such as Pol II ChIP-seq and ChIA-PET) and can be used to identify sites of bidirectional transcription within a dataset or to examine differential transcription between datsets. FStitch is user friendly and fast, with classifications easily viewed on common genome browsers.
FStitch determines its active calls purely on the signal within the data. In regions of dense and/or overlapping transcription, the gaps between distinct transcripts are short to nonexistent. Consequently, FStitch makes long active calls that likely contain multiple transcripts. Additionally, the lack of pre-defined regions of interest complicates the assessment of differential transcription. However, the gains in insight about transcription and regulation warrants the added complexity.
Using FStitch, we learned several interesting new features of transcription at previously annotated genes. We have shown that gene transcription progresses much farther than the 3′-end of the mRNA cleavage site. Remarkably, some of the active calls that are unannotated show signatures of open reading frames, implying they may be under-appreciated genes.
More work is needed to better resolve the transcriptional dynamics observed within genes, such as the 5′ and 3′ peaks. These peaks are reminiscent of patterns seen in un-stranded Pol II ChIP data and likely correspond to distinct stages of RNA polymerase activity [49]. Unfortunately, the height and spread of these peaks vary from gene to gene, making their precise detection difficult. However, it may be possible to build models that can more clearly isolate this substructure within an annotated transcript. In fact, alterations in the size and shape of the GRO-seq signal between experiments may point to distinct modes of regulation. Indeed leveraging finer substructure within GRO-seq signal could help to resolve distinct biological transcripts within active calls. The ability to isolate distinct but adjacent (or even overlapping) regions of transcription would be a powerful use of GRO-seq signal.
Our work demonstrates that GRO-seq is a rich and under-utilized source of insights into transcription and its regulation. Sites of bidirectional transcription are readily identified within GRO-seq data with high accuracy. These bidirectional predictions correlate strongly with known enhancer marks, implying that many are eRNAs. In fact, the single largest class of transcripts that respond (i.e. show differential transcription) when p53 is activated are bidirectional RNAs. Most of these RNAs contain p53 signals, either binding by ChIP or enrichment for the sequence motif. Interestingly, some of these differentially transcribed enhancers are intragenic, potentially confounding studies that depend on the underlying annotation.
Furthermore, when bidirectional predictions and a separate FStitch active call overlap chromatin interaction calls (by ChIA-PET), the two regions are transcribed at the same level; further evidence of enhancer-to-gene interaction. This finding is consistent with ENCODE reporting strong correlations between the presence of an enhancer RNA, gene expression, and promoter-enhancer interations [50], [51]. More interesting is the observation that differentially transcribed FStitch calls are three dimensionally connected via ChIA-PET to another differentially transcribed FStitch call. It remains to be seen if bidirectional FStitch predictions with similar GRO-seq transcription profiles could be combined with relevant additional information such as transcription factor binding motifs or chromatin marks to create a rich model for predicting enhancer-to-gene interactions.
It should be noted that because the only input to FStitch is a genome bedgraph file and a training set, FStitch is not technically specific to GRO-seq data. This method may bare relevance in any experiment where contiguous regions of dense read coverage wish to be isolated; a characteristic most notably present in Pol-II ChIP-seq datasets. Indeed, the relevance of this algorithmic structure to ChIP-seq peak calling should be explored further.
Supplementary Material
Fig. 13. Overlap of differential transcription and p53 marks.
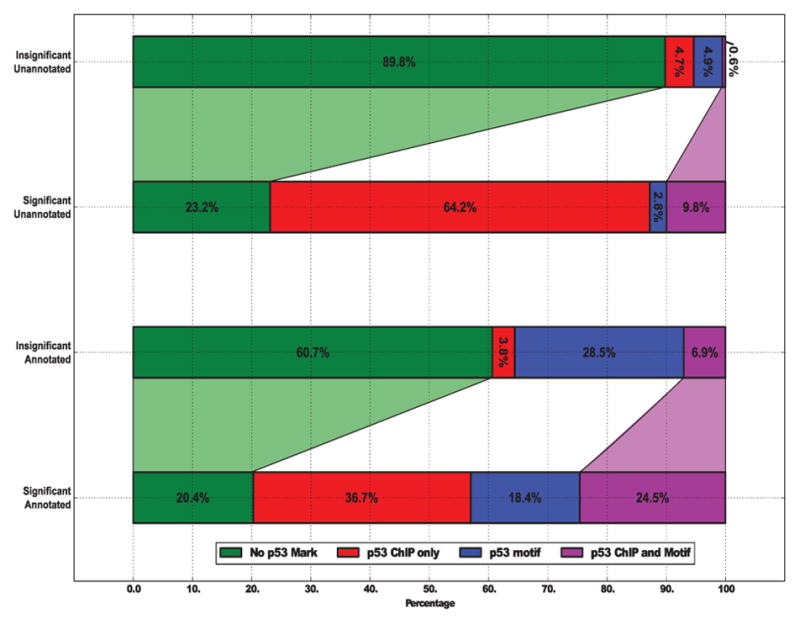
FStitch calls were grouped significance of differential transcription (significant: DESeq adj. p-value < 0.1) and overlap with a RefSeq annotation. From top to bottom, there are 64,899 regions without differential transcription (insignificant) and without overlapping annotation (unannotated); 782 significant-unannotated; 23,986 insignificant-annotated; and 262 significant-annotated, respectively. p53 binding site (ChIP) overlap and p53 motif presence are assessed as described in the text.
Acknowledgments
We would like to thank Aaron Odell and Josephina Hendrix for assistance with analysis of publicly available datasets. This work was funded in part by the Boettcher Foundation’s Webb-Waring Biomedical Research program (RDD), a NSF ABI DBI-12624L0 (RDD), a NIH training grant N 2T15 LM009451 (MAA), and an NSF IGERT 1144807 (JA). The authors acknowledge the BioFrontiers Computing Core at the University of Colorado Boulder for providing High Performance Computing resources (NIH 1S10OD012300) supported by BioFrontiers IT.
Biographies

Joseph Azofiefa received a B.A. in Biology from Vassar College in 2011 and is currently a PhD candidate in the Computer Science department at the University of Colorado at Boulder. He is also affiliated with the Interdisciplinary Quantitative (IQ) Biology program through the BioFron-tiers Institute. Joseph focuses on the integration of topics in probability theory, machine learning and signal processing with biological datasets.

Mary A. Allen received B.A. in Biochemistry from University of Spring Arbor in 2000, a M.S. in Cellular and Molecular Biology from the University of Wisconsin in 2006, and a Ph.D. in Molecular, Cellular and Developmental Biology from University of Colorado at Boulder in 2010. She is now a Sie Postdoctoral Fellow. Mary uses a combination of molecular and computational techniques to increase understanding of transcriptional regulation in cancer and Trisomy 21.

Manuel E. Lladser received a M.A. in Mathematics from the University of Wisconsin in 2000, and a Ph.D. in Mathematics from the Ohio State University in 2003. He is now an Associate Professor at the Department of Applied Mathematics of the University of Colorado at Boulder. Manuel specializes in discrete and applied probability, however, his research is in nature interdisciplinary and motivated by problems in computational biology and metagenomics.
Robin D. Dowell received two BS degrees (Genetics, Computer Engineering) in 1997 from Texas A&M University, a Masters in Computer Science from Washington University in St Louis in 2001, and a D.Sc. in Biomedical Engineering from Washington University in St. Louis in 2004. She is now an Assistant Professor at the University of Colorado in the BioFrontiers Institute and the Molecular, Cellular and Developmental Biology Department. Robin uses machine learning approaches to better understand genomes and transcription. Robin has been a member of IEEE since 2001.
Contributor Information
Joseph G. Azofeifa, Department of Computer Science, University of Colorado, Boulder, CO 80309
Mary A. Allen, BioFrontiers Institute, University of Colorado, Boulder, CO 80309
Manuel E. Lladser, Department of Applied Mathematics, University of Colorado, Boulder, CO 80309
Robin D. Dowell, Department of Molecular, Cellular and Developmental Biology and the BioFrontiers Institute, University of Colorado, Boulder, CO 80309
References
- 1.Core LJ, Waterfall JJ, Lis JT. Nascent RNA sequencing reveals widespread pausing and divergent initiation at human promoters. Science. 2008 Dec;322(5909):1845–1848. doi: 10.1126/science.1162228. [DOI] [PMC free article] [PubMed] [Google Scholar]
- 2.Kapranov P, Willingham AT, Gingeras TR. Genome-wide transcription and the implications for genomic organization. Nat Rev Genet. 2007;8(6):413–423. doi: 10.1038/nrg2083. [DOI] [PubMed] [Google Scholar]
- 3.Neymotin B, Athanasiadou R, Gresham D. Determination of in vivo rna kinetics using rate-seq. RNA. 2014;20(10):1645–1652. doi: 10.1261/rna.045104.114. [DOI] [PMC free article] [PubMed] [Google Scholar]
- 4.Danko CG, Hyland SL, Core LJ, Martins AL, Waters CT, Lee HW, Cheung VG, Kraus WL, Lis JT, Siepel A. Identification of active transcriptional regulatory elements from GRO-seq data. Nat Meth. 2015;12(5):433–438. doi: 10.1038/nmeth.3329. [DOI] [PMC free article] [PubMed] [Google Scholar]
- 5.Min I, Waterfall J, Core L, Munroe R, Schimenti J, Lis J. Regulating RNA polymerase pausing and transcription elongation in embryonic stem cells. Genes & Development. 2011;25(7):742–754. doi: 10.1101/gad.2005511. [Online]. Available: http://genesdev.cshlp.org/content/25/7/742.abstract. [DOI] [PMC free article] [PubMed] [Google Scholar]
- 6.Larschan E, Bishop E, Kharchenko P, Core L, Lis J, Park P, Kuroda M. X chromosome dosage compensation via enhanced transcriptional elongation in Drosophila. Nature. 2011 Mar;471(7336):115–118. doi: 10.1038/nature09757. [Online]. Available: http://www.nature.com/nature/journal/v471/n7336/abs/nature09757.html. [DOI] [PMC free article] [PubMed] [Google Scholar]
- 7.Ji X, Zhou Y, Pandit S, Huang J, Li H, Lin C, Xiao R, Burge C, Fu X. SR proteins collaborate with 7SK and promoter-associated nascent RNA to release paused polymerase. Cell. 2013;153(4):855–868. doi: 10.1016/j.cell.2013.04.028. [Online]. Available: http://www.cell.com/cell/abstract/S0092-8674(13)00503-5. [DOI] [PMC free article] [PubMed] [Google Scholar]
- 8.Consortium TEP. An integrated encyclopedia of DNA elements in the human genome. Nature. 2012;489(7414):57–74. doi: 10.1038/nature11247. [Online]. Available: http://dx.doi.org/10.1038/nature11247. [DOI] [PMC free article] [PubMed] [Google Scholar]
- 9.Kim T, Hemberg M, Gray J, Costa A, Bear D, Wu J, Harmin D, Laptewicz M, Barbara-Haley K, Kuersten S, Markenscoff-Papadimitriou E, Kuhl D, Bito H, Worley P, Kreiman G, Greenberg M. Widespread transcription at neuronal activity-regulated enhancers. Nature. 2010 May;465(7295):182–187. doi: 10.1038/nature09033. [Online]. Available: http://dx.doi.org/10.1038/nature09033. [DOI] [PMC free article] [PubMed] [Google Scholar]
- 10.Wang D, Garcia-Bassets I, Benner C, Li W, Su X, Zhou Y, Qiu J, Liu W, Kaikkonen M, Ohgi K, Glass C, Rosenfeld M, Fu X. Reprogramming transcription by distinct classes of enhancers functionally defined by eRNA. Nature. 2011 May;474(7351):390–394. doi: 10.1038/nature10006. [Online]. Available: http://www.nature.com/doifinder/10.1038/nature10006. [DOI] [PMC free article] [PubMed] [Google Scholar]
- 11.Li W, Notani D, Ma Q, Tanasa B, Nunez E, Chen AY, Merkurjev D, Zhang J, Ohgi K, Song X, Oh S, Kim HS, Glass CK, Rosenfeld MG. Functional roles of enhancer RNAs for oestrogen-dependent transcriptional activation. Nature. 2013 Jun;498(7455):516–520. doi: 10.1038/nature12210. [DOI] [PMC free article] [PubMed] [Google Scholar]
- 12.Melo C, Drost J, Wijchers P, van de Werken H, de Wit E, Vrielink J, Elkon R, Melo S, Léveillé N, Kalluri R, de Laat W, Agami R. ernas are required for p53-dependent enhancer activity and gene transcription. Molecular Cell. 2013 Dec;(3):524–535. doi: 10.1016/j.molcel.2012.11.021. [DOI] [PubMed] [Google Scholar]
- 13.Hah N, Murakami S, Nagari A, Danko C, Kraus W. Enhancer transcripts mark active estrogen receptor binding sites. Genome Research. 2013;23(8):1210–1223. doi: 10.1101/gr.152306.112. [Online]. Available: http://genome.cshlp.org/content/23/8/1210.abstract. [DOI] [PMC free article] [PubMed] [Google Scholar]
- 14.Melgar MF, Collins FS, Sethupathy P. Discovery of active enhancers through bidirectional expression of short transcripts. Genome Biol. 2011;12(11):R113. doi: 10.1186/gb-2011-12-11-r113. [DOI] [PMC free article] [PubMed] [Google Scholar]
- 15.Allison KA, Kaikkonen MU, Gaasterland T, Glass CK. Vespucci: a system for building annotated databases of nascent transcripts. Nucleic Acids Res. 2014 Feb;42(4):2433–2447. doi: 10.1093/nar/gkt1237. [DOI] [PMC free article] [PubMed] [Google Scholar]
- 16.Hah N, Danko CG, Core L, Waterfall JJ, Siepel A, Lis JT, Kraus WL. A rapid, extensive, and transient transcriptional response to estrogen signaling in breast cancer cells. Cell. 2011 May;145(4):622–634. doi: 10.1016/j.cell.2011.03.042. [DOI] [PMC free article] [PubMed] [Google Scholar]
- 17.Chae M, Danko C, Kraus W. grohmm: a computational tool for identifying unannotated and cell type-specific transcription units from global run-on sequencing data. BMC Bioinformatics. 2015;16(1):222. doi: 10.1186/s12859-015-0656-3. [Online]. Available: http://www.biomedcentral.com/1471-2105/16/222. [DOI] [PMC free article] [PubMed] [Google Scholar]
- 18.McCallum A, Freitag D, Pereira F. Maximum Entropy Markov Models for Information Extraction and Segmentation. 17th International Conf. on Machine Learning; 2000. [Google Scholar]
- 19.Azofeifa J, Allen MA, Lladser ME, Dowell R. FStitch: A fast and simple algorithm for detecting nascent rna transcripts. Proceedings of the 5th ACM Conference on Bioinformatics, Computational Biology, and Health Informatics, ser. BCB ‘14; New York, NY, USA: ACM; 2014. pp. 174–183. [Online]. Available: http://doi.acm.org/10.1145/2649387.2649427. [Google Scholar]
- 20.Allen M, Andrysik Z, Dengler VL, Mellert HS, Guarnieri A, AFreeman J, Sullivan KD, Galbraith MD, Luo X, Kraus WL, Dowell RD, Espinosa JM. Global analysis of p53-regulated transcription identifies its direct targets and unexpected regulatory mechanisms. eLife. 2014;3 doi: 10.7554/eLife.02200. [Online]. Available: http://elifesciences.org/content/3/e02200. [DOI] [PMC free article] [PubMed] [Google Scholar]
- 21.Hu D, Smith ER, Garruss AS, Mohaghegh N, Varberg JM, Lin C, Jackson J, Gao X, Saraf A, Florens L, Washburn MP, Eissenberg JC, Shilatifard A. The little elongation complex functions at initiation and elongation phases of snRNA gene transcription. Mol Cell. 2013 Aug;51(4):493–505. doi: 10.1016/j.molcel.2013.07.003. [DOI] [PMC free article] [PubMed] [Google Scholar]
- 22.Jin F, Li Y, Dixon JR, Selvaraj S, Ye Z, Lee AY, Yen CA, Schmitt AD, Espinoza CA, Ren B. A high-resolution map of the three-dimensional chromatin interactome in human cells. Nature. 2013;503(7475):290–294. doi: 10.1038/nature12644. [DOI] [PMC free article] [PubMed] [Google Scholar]
- 23.Joseph R, Orlov YL, Huss M, Sun W, Kong SL, Ukil L, Pan YF, Li G, Lim M, Thomsen JS, Ruan Y, Clarke ND, Prabhakar S, Cheung E, Liu ET. Integrative model of genomic factors for determining binding site selection by estrogen receptor. Mol Syst Biol. 2010 Dec;6:456. doi: 10.1038/msb.2010.109. [DOI] [PMC free article] [PubMed] [Google Scholar]
- 24.Langmead B. Aligning short sequencing reads with Bowtie. Curr Protoc Bioinformatics. 2010 Dec;Chapter 11(Unit 11.7) doi: 10.1002/0471250953.bi1107s32. [DOI] [PMC free article] [PubMed] [Google Scholar]
- 25.Chadwick LH. The NIH Roadmap Epigenomics Program data resource. Epigenomics. 2012 Jun;4(3):317–324. doi: 10.2217/epi.12.18. [DOI] [PMC free article] [PubMed] [Google Scholar]
- 26.Frietze S, Wang R, Yao L, Tak YG, Ye Z, Gaddis M, Witt H, Farnham PJ, Jin VX. Cell type-specific binding patterns reveal that TCF7L2 can be tethered to the genome by association with GATA3. Genome Biol. 2012;13(9):R52. doi: 10.1186/gb-2012-13-9-r52. [DOI] [PMC free article] [PubMed] [Google Scholar]
- 27.He HH, Meyer CA, Chen MW, Jordan VC, Brown M, Liu XS. Differential DNase I hypersensitivity reveals factor-dependent chromatin dynamics. Genome Res. 2012 Jun;22(6):1015–1025. doi: 10.1101/gr.133280.111. [DOI] [PMC free article] [PubMed] [Google Scholar]
- 28.Ogoshi K, Hashimoto S, Nakatani Y, Qu W, Oshima K, Toku-naga K, Sugano S, Hattori M, Morishita S, Matsushima K. Genome-wide profiling of DNA methylation in human cancer cells. Genomics. 2011 Oct;98(4):280–287. doi: 10.1016/j.ygeno.2011.07.003. [DOI] [PubMed] [Google Scholar]
- 29.Fullwood MJ, Liu MH, Pan YF, Liu J, Xu H, Mohamed YB, Orlov YL, Velkov S, Ho A, Mei PH, Chew EG, Huang PY, Welboren WJ, Han Y, Ooi HS, Ariyaratne PN, Vega VB, Luo Y, Tan PY, Choy PY, Wansa KD, Zhao B, Lim KS, Leow SC, Yow JS, Joseph R, Li H, Desai KV, Thomsen JS, Lee YK, Karuturi RK, Herve T, Bourque G, Stunnenberg HG, Ruan X, Cacheux-Rataboul V, Sung WK, Liu ET, Wei CL, Cheung E, Ruan Y. An oestrogen-receptor-alpha-bound human chromatin interactome. Nature. 2009 Nov;462(7269):58–64. doi: 10.1038/nature08497. [DOI] [PMC free article] [PubMed] [Google Scholar]
- 30.Wei C, Wu Q, Vega V, Chiu K, Ng P, Zhang T, Shahab A, Yong H, Fu Y, Weng Z, Liu J, Zhao X, Chew J, Lee Y, Kuznetsov V, Sung W, Miller L, Lim B, Liu E, Yu Q, Ng H, Ruan Y. A global map of p53 transcription-factor binding sites in the human genome. Cell. 2006 Dec;124(1):207–219. doi: 10.1016/j.cell.2005.10.043. [DOI] [PubMed] [Google Scholar]
- 31.Nikulenkov F, Spinnler C, Li H, Tonelli C, Shi Y, Turunen M, Kivioja T, Ignatiev I, Kel A, Taipale J, Selivanov G. Insights into p53 transcriptional function via genome-wide chromatin occupancy and gene expression analysis. Cell Death and Differentiation. 2013;19 doi: 10.1038/cdd.2012.89. [DOI] [PMC free article] [PubMed] [Google Scholar]
- 32.Smeenk L, van Heeringen S, Koeppel M, van Driel M, Bartels S, Akkers R, Denissov S, Stunnenberg H, Lohrum M. Characterization of genome-wide p53-binding sites upon stress response. Nucleic Acids Research. 2008;36(11):3639–3654. doi: 10.1093/nar/gkn232. [Online]. Available: http://nar.oxfordjournals.org/content/36/11/3639.abstract. [DOI] [PMC free article] [PubMed] [Google Scholar]
- 33.Smeenk L, van Heeringen S, Koeppel M, Gilbert B, Janssen-Megens E, Stunnenberg H, Lohrum M. Role of p53 serine 46 in p53 target gene regulation. PLoS ONE. 2011;6(3):e17574. doi: 10.1371/journal.pone.0017574. [Online]. Available: http://dx.doi.org/10.1371%2Fjournal.pone.0017574. [DOI] [PMC free article] [PubMed] [Google Scholar]
- 34.Dreiseitl S, Ohno-Machado L. Logistic regression and artifi-cial neural network classification models: a methodology review. J Biomed Inform. 2002;35(5–6):352–359. doi: 10.1016/s1532-0464(03)00034-0. [DOI] [PubMed] [Google Scholar]
- 35.Bouguila N, Ziou D. A hybrid SEM algorithm for high-dimensional unsupervised learning using a finite generalized Dirichlet mixture. IEEE Trans Image Process. 2006 Sep;15(9):2657–2668. doi: 10.1109/tip.2006.877379. [DOI] [PubMed] [Google Scholar]
- 36.Moon S, Hwang JN. Robust speech recognition based on joint model and feature space optimization of hidden Markov models. IEEE Trans Neural Netw. 1997;8(2):194–204. doi: 10.1109/72.557656. [DOI] [PubMed] [Google Scholar]
- 37.Seila A, Calabrese J, Levine S, Yeo G, Rahl P, Flynn R, Young R, Sharp P. Divergent transcription from active promoters. Science. 2008;322(5909):1849–1851. doi: 10.1126/science.1162253. [Online]. Available: http://www.sciencemag.org/content/322/5909/1849.abstract. [DOI] [PMC free article] [PubMed] [Google Scholar]
- 38.Shlyueva D, Stampfel G, Stark A. Transcriptional enhancers: from properties to genome-wide predictions. Nat Rev Genet. 2014 Mar;15:272–286. doi: 10.1038/nrg3682. [DOI] [PubMed] [Google Scholar]
- 39.Thorvaldsdttir H, Robinson J, Mesirov J. Integrative genomics viewer (igv): high-performance genomics data visualization and exploration. Briefings in Bioinformatics. 2013;14(2):178–192. doi: 10.1093/bib/bbs017. [Online]. Available: http://bib.oxfordjournals.org/content/14/2/178.abstract. [DOI] [PMC free article] [PubMed] [Google Scholar]
- 40.Pruitt K, Brown G, Hiatt S, Thibaud-Nissen F, Astashyn A, Ermolaeva O, Farrell C, Hart J, Landrum M, McGarvey K, Murphy M, OLeary N, Pujar S, Rajput B, Rangwala S, Riddick L, Shkeda A, Sun H, Tamez P, Tully R, Wallin C, Webb D, Weber J, Wu W, DiCuccio M, Kitts P, Maglott D, Murphy T, Ostell J. Refseq: an update on mammalian reference sequences. Nucleic Acids Research. 2014;42(D1):D756–D763. doi: 10.1093/nar/gkt1114. [Online]. Available: http://nar.oxfordjournals.org/content/42/D1/D756.abstract. [DOI] [PMC free article] [PubMed] [Google Scholar]
- 41.Anders S, Huber W. Differential expression analysis for sequence count data. Genome Biology. 2010;11(10):R106. doi: 10.1186/gb-2010-11-10-r106. [Online]. Available: http://genomebiology.com/2010/11/10/R106. [DOI] [PMC free article] [PubMed] [Google Scholar]
- 42.Rapaport F, Khanin R, Liang Y, Pirun M, Krek A, Zumbo P, Mason C, Socci N, Betel D. Comprehensive evaluation of differential gene expression analysis methods for RNA-seq data. Genome Biology. 2013;14(9):R95. doi: 10.1186/gb-2013-14-9-r95. [Online]. Available: http://genomebiology.com/2013/14/9/R95. [DOI] [PMC free article] [PubMed] [Google Scholar]
- 43.Consortium TU. Uniprot: a hub for protein information. Nucleic Acids Research. 2014 doi: 10.1093/nar/gku989. [Online]. Available: http://nar.oxfordjournals.org/content/early/2014/10/27/nar.gku989.abstract. [DOI] [PMC free article] [PubMed]
- 44.Tamayo P, Scanfeld D, Ebert B, Gillette M, Roberts C, Mesirov J. Metagene projection for cross-platform, cross-species characterization of global transcriptional states. Proceedings of the National Academy of Sciences. 2007;104(14):5959–5964. doi: 10.1073/pnas.0701068104. [Online]. Available: http://www.pnas.org/content/104/14/5959.abstract. [DOI] [PMC free article] [PubMed] [Google Scholar]
- 45.Anamika K, Gyenis A, Tora L. How to stop: The mysterious links among RNA polymerase II occupancy 3′ of genes, mRNA 3′ processing and termination. Transcription. 2013;4(1):7–12. doi: 10.4161/trns.22300. [DOI] [PMC free article] [PubMed] [Google Scholar]
- 46.McLachlan GJ, Jones PN. Fitting mixture models to grouped and truncated data via the EM algorithm. Biometrics. 1988 Jun;44(2):571–578. [PubMed] [Google Scholar]
- 47.Preker P, Almvig K, Christensen MS, Valen E, Mapendano CK, Sandelin A, Jensen TH. Promoter upstream transcripts share characteristics with mrnas and are produced upstream of all three major types of mammalian promoters. Nucleic Acids Research. 2011 doi: 10.1093/nar/gkr370. [Online]. Available: http://nar.oxfordjournals.org/content/early/2011/05/19/nar.gkr370.abstract. [DOI] [PMC free article] [PubMed]
- 48.Arimbasseri AG, Rijal K, Maraia RJ. Comparative overview of RNA polymerase II and III transcription cycles, with focus on RNA polymerase III termination and reinitiation. Transcription. 2013 Dec;4(6) doi: 10.4161/trns.27369. [DOI] [PMC free article] [PubMed] [Google Scholar]
- 49.Fuda N, Ardehali M, Lis JT. Defining mechanisms that regulate RNA polymerase II transcription in vivo. Nature. 2009 Sep;461(7261):186–192. doi: 10.1038/nature08449. [Online]. Available: http://dx.doi.org/10.1038/nature08449. [DOI] [PMC free article] [PubMed] [Google Scholar]
- 50.Sanyal A, Lajoie BR, Jain G, Dekker J. The long-range interaction landscape of gene promoters. Nature. 2012 Sep;489:109–113. doi: 10.1038/nature11279. [DOI] [PMC free article] [PubMed] [Google Scholar]
- 51.Podsiadlo A, Wrzesien M, Paja W, Rudnicki W, Wilczynski B. Active enhancer positions can be accurately predicted from chromatin marks and collective sequence motif data. BMC Systems Biology. 2013;7(Suppl 6):S16. doi: 10.1186/1752-0509-7-S6-S16. [Online]. Available: http://www.biomedcentral.com/1752-0509/7/S6/S16. [DOI] [PMC free article] [PubMed] [Google Scholar]
Associated Data
This section collects any data citations, data availability statements, or supplementary materials included in this article.


