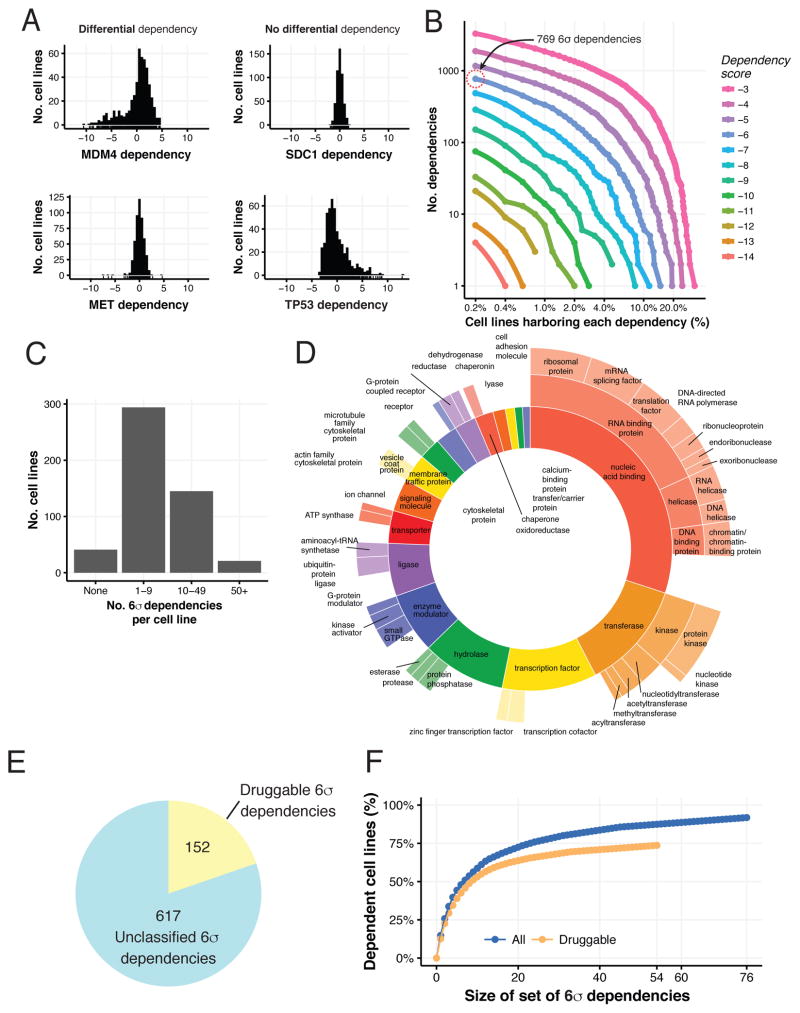
Figure 2. The landscape of genetic dependencies in 501 cancer cell lines.
(A) Histograms of gene dependency scores for the indicated genes for all cell lines (x-axis). (B) For each differential dependency strength (line color), and for each number of cell lines (xaxis), the number of genes that are differential dependencies is shown (y-axis). (C) Distribution of the number of 6σ dependencies per cell line. (D) Distribution of 6σ dependencies by protein classes. (E) The number of 6σ dependencies annotated as druggable by either being included in DGIdb or IUPHAR/BPS Guide to Pharmacology. (F) The fraction of cell lines (y-axis) that have a 6σ differential dependency on at least one gene in a set of a given size (x-axis). Blue line – considering all 6σ dependencies; orange line – considering only druggable ones.

