

Abstract
Survival signaling is critical for the metastatic program of cancer cells. The current study investigated the role of Akt survival proteins in colorectal cancer (CRC) metastasis and explored potential mechanisms of Akt-mediated metastasis regulation. Using an orthotopic implantation model in mice, which uniquely recapitulates the entire multistep process of CRC metastasis, combined with an inducible system of short hairpin RNA-mediated Akt isoform knockdown in human CRC cells, our studies confirm a role of Akt2 in CRC cell dissemination to distant organs in vivo. Akt2 deficiency profoundly inhibited the development of liver lesions in mice, whereas Akt1 had no effect under the experimental conditions used in the study. Array analysis of human metastatic genes identified the scaffolding protein metastasis suppressor 1 (MTSS1) as a novel Akt2-regulated gene. Inducible loss of Akt2 in CRC cells robustly upregulated MTSS1 at the messenger RNA and protein level, and the accumulated protein was functionally active as shown by its ability to engage an MTSS1-Src-cortactin inhibitory axis. MTSS1 expression led to a marked reduction in levels of functional cortacin (pcortactin Y421), an actin nucleation-promoting factor that has a crucial role in cancer cell invasion and metastasis. MTSS1 was also shown to mediate suppressive effects of Akt2 deficiency on CRC cell viability, survival, migration and actin polymerization in vitro. The relevance of these findings to human CRC is supported by analysis of The Cancer Genome Atlas (TCGA) and NCBI GEO data sets, which demonstrated inverse changes in expression of Akt2 and MTSS1 during CRC progression. Taken together, the data identify MTSS1 as a new Akt2-regulated gene, and point to suppression of MTSS1 as a key step in the metastasis-promoting effects of Akt2 in CRC cells.
INTRODUCTION
Colorectal cancer (CRC) is one of the most commonly diagnosed malignancies and the second leading cause of cancer death in the United States.1 Despite the efforts of screening strategies and advances in treatment, one-third of CRC patients will ultimately die from metastatic disease.2 Although the 5-year survival rate for patients diagnosed with localized CRC is 91%, the prognosis for patients with metastatic disease is <13%.3 Understanding of the mechanisms underlying the multistep metastatic program of CRC cells is, therefore, critical for the development of novel therapies that will improve the management of advanced disease.
It has been well documented that dissemination of cancer cells to distant organ sites is critically dependent on enhanced survival signaling,4 with cancer cell survival being a rate-limiting step in the metastatic process.5 The serine/threonine kinase Akt is a survival oncoprotein, which regulates many cellular processes, including metabolism, growth, proliferation and migration.6 Aberrant activation of Akt is one of the most frequent alterations in human cancer, and cancer cells have developed several mechanisms to achieve constitutive Akt activity. Akt is activated via a multistep process: receptor tyrosine kinases stimulate phosphatidylinositol 3-kinase, which in turn converts phosphatidylinositol (3,4)-bisphosphate (PIP2) to phosphatidylinositol (3,4,5)-trisphosphate (PIP3) by phosphorylation at the 3′-position of the inositol ring.7 PIP3 recruits Akt to the plasma membrane, where it is partially activated by PDK1-mediated phosphorylation on T308. Full activation is achieved following phosphorylation on S473 by mTORC2.8–10 Akt signaling is negatively regulated by phosphatases, including PTEN, which converts PIP3 to PIP2, and PP2A and PHLPP 1/2, which dephosphorylate Akt on T308 and S473, respectively.10–12 In cancer cells, enhanced Akt activity can result from overexpression/amplification of Akt, overexpression of receptor tyrosine kinases, deletion or mutation of PTEN, or mutations in phosphatidylinositol 3-kinase subunits.
There are three Akt isoforms in the Akt family: Akt1, Akt2 and Akt3. Although these kinases are structurally homologous and activated by similar mechanisms, evidence from knockout mice points to non-redundant functions of individual family members.10,13,14 Akt isoforms can exhibit opposing roles in the same cancer type and the same isoform can have distinct functions in different cancer types.15,16 In breast cancer, for example, Akt1 inhibits cell motility/invasion while Akt2 enhances these processes.16,17 Akt isoforms also show differential patterns of expression in cancer; although Akt1 is overexpressed in gastric and colon cancer,15 Akt2 is highly expressed in breast, ovarian and colon cancers,15,18,19 and Akt3 expression increases in breast and prostate cancers.20
Recent studies have revealed high expression of Akt2 in stage IV CRCs and liver metastases, and splenic injection experiments demonstrated that Akt2 deficiency impairs the metastatic capacity of CRC cells in mice, via mechanisms that remain unknown.21 The current study further explores the role of Akt survival proteins in CRC metastasis in an orthotopic mouse CRC metastasis model that can quantitatively and qualitatively recapitulate the multistep dissemination process seen in patients. Use of inducible Akt isoform knockdown CRC cells in this experimental model confirmed a role for Akt2 in CRC metastasis and identified potential mechanisms underlying the effects of this Akt isoform in the metastatic program of CRC cells.
RESULTS
Loss of Akt2 inhibits CRC metastasis in vivo
Previous studies assessed the role of Akt1 and Akt2 in CRC metastasis using splenic injections in immunocompromised mice as an experimental model system.21 However, this approach does not fully reflect human disease as it fails to address early steps of metastasis, including invasion at the primary site and access to lymphatics or blood vessels. To overcome these limitations and better understand the role of Akt isoforms in CRC metastasis, we performed orthotopic implantation studies, which mimic human CRC primary tumors and metastatic deposits and recapitulate the entire metastatic process.22–26 To carry out the analysis, we first established lentiviral doxycycline (Dox)-inducible short hairpin RNA (shRNA)-mediated knockdown of Akt1 and Akt2 in GEO and CBS cells, CRC cell lines that express all three Akt isoforms (Figure 1a). Non-targeting shRNA and two targeted shRNAs against each Akt isoform were tested in both cell lines. As shown in Figure 1b (left panels), no change in the expression of Akt isoforms was observed in cells following induction of non-targeting shRNA by treatment with Dox. In contrast, induction of Akt isoform-specific shRNAs by addition of Dox led to loss of Akt1 or Akt2 at both the protein (Figure 1b, middle and right panels) and mRNA levels (Supplementary Figures S1A and B). shRNAs were specific for their targeted Akt isoform as no change was seen in the expression of non-targeted Akt family members (Figure 1b).
Figure 1.

Establishment of colon cancer cells with inducible knockdown of Akt1 or Akt2. (a) Western blot analysis of endogenous levels of Akt1, Akt2 and Akt3 in GEO and CBS colon cancer cells. (b) Immunoblot analysis confirms that the expression of Akt1, Akt2 and Akt3 does not change in GEO and CBS cells expressing non-targeting shRNA (sh) on treatment with Dox (left panels). Knockdown of Akt1 (middle panel) and Akt2 (right panel) is achieved in GEO and CBS cells expressing Akt isoform-specific shRNA on addition of Dox. No change in the expression of other Akt isoforms is observed, confirming specificity of knockdown. GAPDH was used as a loading control. Data are representative of at least three independent experiments.
For orthotopic implantation studies, xenograft tumor tissue fragments of green fluorescent protein (GFP)-labeled GEO cells expressing non-targeting shRNA, Akt1 shRNA#2 or Akt2 shRNA#2 were implanted into the cecum of athymic nude mice and primary tumors were allowed to develop over a 6-week period. shRNA expression was then induced by adding Dox to the drinking water for 3 weeks, before animals were killed and organs were excised for analysis. As shown in Figure 2a, no change in the weight of the primary tumor was observed with Akt1 knockdown, whereas a modest reduction was consistently observed on knockdown of Akt2. At the time of euthanasia, 59% of the animals in the non-targeting shRNA group had liver metastases (Figure 2b). Knockdown of Akt1 did not substantially affect metastasis incidence, with 53% of animals showing lesions in the liver. In contrast, a marked reduction in metastasis was observed on Ak2 knockdown, with only 35% of animals in the Akt2 shRNA group showing liver deposits (Figure 2b). Analysis of human GAPDH expression in mouse livers confirmed that Akt2 deficiency significantly (P<0.001) reduced metastatic burden in this model (Figure 2c, right panel), whereas Akt1 knockdown had no effect (Figure 2c, left panel). Furthermore, quantification of metastatic spots in the lobes of mouse livers by fluorescence microscopy revealed a significant reduction in the number of lesions per metastasis-bearing mouse on loss of Akt2 (P = 0.01), but not Akt1 (P = 0.98; Figure 2d). Taken together, these findings established that Akt2, but not Akt1, affects growth of primary colorectal tumors in vivo and is essential for efficient development of the metastatic program in CRC cells.
Figure 2.

Dox-induced loss of Akt2 reduces metastasis of orthotopically implanted GFP-labeled GEO cells in vivo. (a) Bar graph showing no significant change in primary tumor weight on Dox-induced loss of Akt1 (left panel) and a modest reduction on loss of Akt2 (right panel). n =22, n =19 and n =17 for non-targeting, Akt1 and Akt2 sh mouse groups, respectively. (b) Fluorescent images of mice, primary tumor and liver following orthotopic implantation of GFP-labeled GEO cells expressing non-targeting, Akt1 or Akt2 shRNA. Arrows indicate metastatic deposits in the liver. The table below the images shows quantification of mice bearing primary tumors and liver metastases. (c) qPCR analysis shows similar expression of human GAPDH in livers from mice implanted with GEO cells expressing Akt1 shRNA and non-targeting shRNA (left panel), whereas a marked reduction in GAPDH expression is seen on Dox-induced suppression of Akt2 (right panel). (d) Quantification of liver metastatic spots shows no significant difference on loss of Akt1 (left panel) and a significant reduction on loss of Akt2 (right panel). n =13, n =10 and n =6 for non-targeting, Akt1 and Akt2 sh mouse groups, respectively. (NS =not significant, *P<0.05, ***P<0.001).
Akt2 regulates the expression of metastasis suppressor 1 in colorectal cancer cells
To identify potential effector(s) mediating the effects of Akt2 in metastasis of CRC cells, we performed comparative RT2 Profiler PCR array (SABiosciences, Frederick, MD, USA, www.sabiosciences.com; Qiagen, Germantown, MD, USA) analysis of human meta-static genes in GEO cells expressing Dox-inducible Akt1 shRNA#2, Akt2 shRNA#2 or Akt3 shRNA#2. Specific knockdown of Akt3 in GEO cells was confirmed by western blotting and real-time PCR (Supplementary Figures S2A and B). Differential expression of several metastatic genes was observed on loss of individual Akt isoforms (Figure 3). Only Akt2 deficiency led to an increase in the expression of MCAM, Kiss1 and E-Cadherin, metastasis-associated proteins already extensively studied in CRC.27–29 Akt2 loss also led to a robust increase (>10-fold) in Cathepsin that was not seen with deficiency of Akt1 or Akt3. Interestingly, our RT2 Profiler PCR array analysis identified a 9-fold induction in Metastasis Suppressor 1 (MTSS1) mRNA in Akt2 knockdown GEO cells (Figure 3), with no change observed in cells deficient in Akt1 or Akt3. MTSS1 (also known as Missing in Metastasis (MIM)) is a multi-domain scaffolding protein that has been linked to regulation of metastasis in various cancer types.30–33 Consistent with this role, MTSS1 regulates cytoskeletal dynamics and actin polymerization, and has been implicated in control of cell proliferation, cell motility and invasion.34–36 Functional antagonism has been identified between MTSS1 and the actin nucleation-promoting factor and regulator of tumor invasion, cortactin (CTTN). MTSS1 inhibits CTTN via inactivation of Src, a non-receptor tyrosine kinase that phosphorylates CTTN at Y421 to increase its affinity and nucleating activity for actin.37 To our knowledge, our array data represent the first demonstration of a link between MTSS1 expression and Akt2 signaling; thus, follow-up studies further explored this novel finding.
Figure 3.

Regulation of the expression of metastasis-related genes by Akt isoforms. GEO cells expressing non-targeting shRNA (sh) or Akt1, Akt2 or Akt3 shRNA were treated with Dox for 5 days and cDNA samples were subjected to real-time PCR using the Human Tumor Metastasis RT2 Profiler PCR array from Super Array Biosciences (Qiagen). Top panel: Venn diagram showing differentially expressed metastatic genes on knockdown of each of the three Akt isoforms. Genes shown in red have higher expression in Akt isoform knockdown cells relative to non-targeting shRNA (sh) expressing cells, whereas genes in green show reduced expression. Lower panel: list of genes that showed differential expression (>two-fold) on loss of individual Akt isoforms. MTSS1 is shown in bold.
Immunoblot analysis showed low to undetectable basal expression of MTSS1 in GEO and CBS cells in the absence of Dox and confirmed a robust increase in MTSS1 levels following knockdown of Akt2 with two different shRNAs (Figure 4a, left panels). In contrast, deficiency of Akt1 or Akt3 had no effect on MTSS1 expression (Figure 4a, middle and right panels), pointing to a selective ability of Akt2 to upregulate this protein. To determine the functional relevance of MTSS1 induction by Akt2 deficiency, we evaluated the effects of Akt2 knockdown on downstream components of the MTSS1-Src-CTTN inhibitory axis (see above) in GEO and CBS cells. Effects were compared with those in Akt1- and Akt3-deficient CRC cells. Akt2 knockdown markedly decreased levels of active pSrc (Y416) and pCTTN (Y421) in GEO and CBS cells, whereas Akt1 or Akt3 knockdown had no effect (Figure 4a). Notably, inhibition of MTSS1 induction using shRNA (Figure 4b, left panel) reduced the suppressive effects of Akt2 depletion on pSrc (Y416) and pCTTN (Y421) (Figure 4b, right panel), confirming activation of the MTSS1-Src-CTTN inhibitory axis by Akt2 knockdown. These data establish that MTSS1 upregulation induced by loss of Akt2 is functionally relevant in CRC cells.
Figure 4.


MTSS1 is markedly upregulated and functionally active in colon cancer cells following Dox-induced suppression of Akt2 in vitro and in vivo. (a) Western blot analysis of MTSS1, pSrc (Y416), total Src and pCTTN (Y421) in Akt2, Akt1 and Akt3 knockdown GEO (upper panel) and CBS (lower panel) colon cancer cells. Akt2 deficiency, but not Akt1 or Akt3 deficiency, markedly upregulates MTSS1 in association with suppression of pSrc (Y416) and pCTTN (Y421) in both cell lines. Expression of total Src remains unchanged. (b) Left panel: western blot analysis confirming MTSS1 suppression by shRNA in Akt2 knockdown GEO cells. Right panel: the decrease in pSrc (Y416) and pCTTN (Y421) induced by loss of Akt2 is prevented by shRNA-induced depletion of MTSS1. (c) Immunohistochemical (upper panels) and western blot (lower panel) analysis of primary tumor samples show that suppression of Akt2 in GEO cells in vivo is also associated with increased expression of MTSS1. Bar graphs show the results of quantification of immunohistochemical staining using Definiens Tissue Studies 64 (Dual 4.1) software. (d) Suppression of Akt1 in GEO cells in vivo fails to affect MTSS1 expression. (NS =not significant, ***P<0.001). Scale bar is 5 μm. Western blot data in c are representative of at least three independent experiments.
Next, we explored the ability of Akt2 to modulate MTSS1 in vivo. Importantly, immunohistochemical analysis of GEO primary tumor sections showed that Akt2 knockdown (Figure 4c), but not Akt1 knockdown (Figure 4d), markedly induced expression of MTSS1 in vivo, as confirmed by quantitative analysis using Definiens Tissue Studies 64 (Dual 4.1) software (Cambridge, MA, USA). The effects of Akt2 deficiency in vivo were further supported by immunoblot analysis of tumor extracts, which demonstrated undetectable/barely detectable MTSS1 expression in tumors expressing non-targeted shRNA and strong upregulation of the protein following Akt2 knockdown (Figure 4c, bottom panel). Together, these studies identified MTSS1 as a novel Akt2-regulated gene in CRC cells.
Akt2 deficiency decreases CRC cell viability, survival and motility via induction of MTSS1
The effects of Akt2 knockdown seen in GEO primary tumors pointed to potential roles for Akt2 in aberrant proliferation and/or survival as well as migration of CRC cells, key components of the metastatic program. To determine effects of Akt2 deficiency on cell proliferation, sections of primary tumor were stained for the proliferation marker Ki67. As shown in Figure 5a, nuclear staining for Ki67 was significantly decreased (P<0.001) in tumor cells expressing Akt2 shRNA compared with those expressing non-targeting shRNA. TUNEL staining further demonstrated a six-fold increase in the percentage of apoptotic cells in tumors lacking Akt2 expression (Figure 5b). Thus, Akt2 knockdown resulted in decreased proliferation and survival of GEO cells in vivo.
Figure 5.


Effects of Akt2 knockdown on colon cancer cell proliferation, survival, viability and motility in vivo and in vitro. Immunohistochemical staining for the proliferation marker Ki67 (a) and TUNEL staining for apoptotic cells (b) in non-targeting shRNA- and Akt2 shRNA-expressing GEO primary tumors after administration of Dox in the drinking water for 3 weeks. Ki67 and TUNEL staining was quantified using Definiens Tissue Studies 64 (Dual 4.1) software and by counting positively stained apoptotic bodies, respectively, and the results are presented in the corresponding bar graphs. Akt2 knockdown was associated with a significant decrease in Ki67 staining intensity and a significant increase in the % of apoptotic cells in primary GEO cell tumors. (c) MTT assays demonstrate a marked reduction in viable GEO and CBS cells on loss of Akt2 by administration of Dox in vitro. (d) DNA fragmentation assays reveal a 5–6-fold increase in cell death on Akt2 knockdown in GEO and CBS cells in vitro. (e) Representative images of crystal violet-stained GEO cells that have passed through the membrane in a transwell migration assay showing a reduction in cell motility in the absence of Akt2 at 36 h. (**P<0.01 and ***P<0.001). Scale bar is 5 μm. Data are representative of at least three independent experiments.
To determine if these effects could be recapitulated in vitro, we evaluated the responses of GEO and CBS cells to Akt2 deficiency using MTT cell viability assays and DNA fragmentation assays. MTT assays showed a significant (P<0.001) reduction in the number of viable GEO and CBS cells on loss of Akt2 (Figure 5c), whereas DNA fragmentation analysis demonstrated an approximately six-fold increase in apoptosis (Figure 5d). Transwell migration assays indicated that Akt2 knockdown also impaired CRC migration. Loss of Akt2 resulted in an ~ 70% reduction in motility of GEO cells at 36 h, as revealed by quantification of crystal violet-stained GEO cells on the bottom of membrane inserts (P<0.001; Figure 5e). To minimize the potential contribution of decreased cell proliferation and survival, the analysis was also performed at 18 h. As shown in Supplementary Figure S3, a 70% reduction (P<0.001) in cell migration was also observed at this earlier time point, when effects on cell number would be expected to be less evident.
To determine the role of MTSS1 in these effects, we compared cellular responses to Akt2 loss in GEO cells silenced for MTSS1 (see Figure 4b for confirmation of MTSS1 knockdown). Importantly, shRNA inhibition of MTSS1 induction significantly prevented the decrease in viability (Figure 6a), increase in apoptosis (Figure 6b) and decrease in motility (Figure 6c) seen following Akt2 knockdown. As MTSS1 affects the motility of cells by regulating the actin cytoskeleton,35,36 we assessed the effects of MTSS1 knockdown on actin polymerization in GEO cells using the F-actin probe Alexa Fluor 633 phalloidin. As shown in Figure 6d, loss of MTSS1 led to an increase in actin polymerization, as indicated by increased Alexa Fluor 633 phalloidin signal, which in turn could lead to enhanced motility of the cells. Taken together, these findings point to a critical role of MTSS1 in mediating the effects of Akt2 knockdown in CRC cells.
Figure 6.

Effects of Akt2 knockdown on colon cancer cell viability, survival and motility are mediated by MTSS1. (a) MTT assay showing a marked decrease in GEO cell viability on Dox-induced loss of Akt2, which is rescued by MTSS1 deficiency in Akt2 knockdown cells. (b) DNA fragmentation assays reveal a significant protection from Akt2 depletion-induced cell death by knockdown of MTSS1. (c) Representative images of transwell migration assays (36 h) showing a reduction in migration of GEO cells on loss of Akt2, which is prevented by MTSS1 deficiency. The bar graph shows quantification of the data from migration assays. (d) Representative images of GEO cells stained with the F-actin probe Alexa Fluor 633 phalloidin (far red). The DNA dye DAPI (blue) was used to detect cell nuclei and RFP staining (Red) reflects treatment with Dox. Scale bar is 20 μm (NS =not significant, **P<0.01 and ***P<0.001). Data are representative of at least three independent experiments.
Expression of MTSS1 in human CRC samples
Publically available expression data also support our findings. Analysis of The Cancer Genome Atlas (TCGA) data sets revealed a significant (P<0.0001) two-fold decrease in the expression of MTSS1 in human CRC samples compared with normal colon mucosa (Figure 7). Analysis of data obtained using microdissected normal and neoplastic colonic epithelial cells (GEO Accession number GSE20916 and Skrzypczak et al.38) also revealed a significant (P<10 −6) three-fold downregulation of MTSS1, which was accompanied by a three-fold upregulation of Akt2 (P = 0.001). The concordant upregulation of Akt2 and downregulation of MTSS1 during CRC progression was reinforced by a significant (r = − 0.73085, P = 0.016) negative correlation between the expression of these proteins in this data set.
Figure 7.

Expression of MTSS1 in human CRC samples. Differential expression of MTSS1 in normal human colonic mucosa and CRC samples from The Cancer Genome Atlas database.
DISCUSSION
Using orthotopic implantation assays, a more relevant model of human CRC metastasis, and an inducible system of shRNA-mediated Akt isoform knockdown that minimizes compensatory effects of isoform deficiency, we establish that Akt2 has an important role in the metastatic program of CRC cells. Although several in vivo assays have been developed to study CRC progression, none of these models effectively recapitulate the multistep dissemination process seen in patients. By accurately reproducing the metastatic phenotype of the human disease to the liver, the model used in our study provides a more appropriate platform for evaluating the role of Akt isoforms in CRC metastasis. Loss of Akt2 resulted in a 40% reduction in the number of mice with GEO liver lesions and a profound suppression in the number of metastatic spots per mouse, with no changes seen on loss of Akt1. The finding that deficiency of Akt2, but not of Akt1, markedly inhibits GEO cell metastasis in mice is consistent with the results of Rychahou et al.21 using splenic injection of KM20 CRC cells in immunocompromised mice, but differs from those of Ericson et al.,19 who showed reduced metastatic potential of DLD1 CRC cells in a splenic injection model only on combined loss of both Akt1 and Akt2. Although the basis for these contrasting results is currently unknown, they may reflect differences in (a) the genetic background of the CRC cells used in these studies, and (b) the ability of individual Akt isoforms to respond to relevant upstream signals available under the specific conditions used in these experiments. Data from studies in other tumor systems, including breast and ovarian cancer,29,39 further support the importance of Akt2 in the metastasis process. The current study also showed that Akt2 deficiency decreases CRC cell proliferation and survival in primary tumors in vivo, as indicated by decreased Ki67 staining and an increase in TUNEL-positive cells, likely accounting for the modest reduction in primary tumor weight observed in these animals. However, as previous studies have demonstrated that the size of the primary tumor does not correlate with the extent of metastasis,40 it is unlikely that the modest difference in primary tumor size accounts for the marked reduction in tumor burden seen in animals bearing Akt2-deficient GEO cells.
In an effort to determine the molecular mechanism(s) underlying the ability of Akt2 to promote CRC metastasis, we profiled the expression of a panel of human metastatic genes in GEO cells lacking Akt1, Akt2 or Akt3. This analysis identified the multi-domain scaffolding molecule MTSS1 as a novel Akt2-regulated gene. Originally identified as a transcript that was missing in metastatic bladder and prostate cancer cells,41 MTSS1 has been linked to inhibition of metastasis in a broad range of cancer types. Consistent with this role, expression of MTSS1 is decreased in breast, esophageal, bladder, kidney, gastric, pancreatic, ovarian and CRC,30–33,42–47 as well as in acute and chronic myeloid leukemia, where it has been shown to function as a tumor suppressor.48,49 Our analysis of TCGA data sets also demonstrated reduced expression of MTSS1 in human CRC tissue samples. However, a contradictory report indicating that MTSS1 over-expression increases the metastatic capacity of melanoma cells50 points to potential functional complexity of this protein.
In support of a metastasis suppressor role for MTSS1, studies from several laboratories have identified a functional antagonism between MTSS1 and CTTN, a crucial player in aggressive cancers.37 As its name suggests, CTTN colocalizes with actin, promoting actin branching and polymerization, and thereby regulating cellular migration, invasion and metastasis.51 CTTN is a major substrate of Src, a critical regulator of signaling pathways involved in metastasis-related processes, and phosphorylation of CTTN at Y421 by Src increases its affinity and nucleating activity for actin.52–54 Importantly, recent studies have defined an MTSS1-Src-CTTN inhibitory axis involving the Src receptor protein tyrosine phosphatase (PTP), PTPδ.55 By suppressing cellular levels of PTPδ, MTSS1 inhibits the dephosphorylation and activation of Src, thereby blocking the activation of CTTN. Here we show that loss of Akt2 in CRC cells results in robust induction of MTSS1 both in vitro and in vivo, and that the accumulated protein is able to engage the MTSS1-Src-cortactin inhibitory axis, as indicated by decreased levels of pSrc (Y416) and pCTTN (Y421). The relevance of these findings to human CRC is suggested by our TCGA and NCBI GEO analysis, which pointed to an inverse relationship between the expression of Akt2 and MTSS1 during CRC progression. Although the mechanism for suppression of MTSS1 mRNA by Akt2 remains to be determined, based on evidence that MTSS1 is a target for miR-23a, miR-135a, miR-135b and miR-15b in CRC cells, all of which have been implicated in promoting metastasis in diverse in vitro and in vivo experimental models, it is possible that microRNAs mediate the effect.42,43,45,46 Consistent with this possibility, Akt isoforms have been shown to differentially regulate the expression of multiple microRNAs involved in the epithelial/ mesenchymal transition, cell motility, invasion and metastasis. Akt2 was shown to decrease the abundance of miR200 family members in breast cancer cells, promoting epithelial/mesenchymal transition and enhanced cell migration and tumor progression.56 Inhibition of phosphatidylinositol 3-kinase signaling increased the expression of let-7 family members, known targets of tumor suppressor genes that are associated with epithelial/ mesenchymal transition, apoptosis and cell cycle progression.57–59 Akt is also known to regulate the expression of miR-145,60 which has a tumor suppressive role in colon cancer cells.61,62 Interestingly, activation of phosphatidylinositol 3-kinase increases the expression of the MTSS1 regulator, miR-135b,45 which has also been implicated in control of proliferation, invasion and apoptosis of colon cancer cells.63
Using the conditional Akt2 knockdown CRC cell lines developed for this study, we further show that the Akt2-MTSS1 signaling module has a key role in cellular processes that are crucial for the CRC metastatic program. We establish that Akt2 deficiency markedly suppresses CRC cell viability/proliferation, survival, motility and actin polymerization in vitro using MTT, TUNEL, migration and phalloidin staining assays, respectively. The ability of MTSS1 knockdown to rescue the cells from the functional consequences of Akt2 loss pointed to this scaffolding protein as a major mediator of the effects of Akt2 deficiency in CRC cells. In this regard, a role for MTSS1 in inhibition of cell proliferation and migration/invasion has been demonstrated by others in CRC cells43,45,46 and various other cancer types.34,64,65 However, to our knowledge, our study provides the first evidence for a pro-apoptotic function of MTSS1 in cancer cells, as indicated by the ability of MTSS1 knockdown to rescue GEO and CBS cells from the cell death-inducing effects of Akt2 knockdown.
On the basis of our findings, we propose the following model for the inhibitory effects of Akt2 deficiency on the metastatic program of CRC cells (Figure 8). Loss of Akt2 robustly upregulates MTSS1 at the mRNA and protein levels. This leads to inhibition of Src, likely through downregulation of PTPδ, a phosphatase that removes the inhibitory phosphorylation of Src at Y527,55 allowing activation of the kinase via autophosphorylation at Y416.55 Src is known to have multiple substrates that can affect cell proliferation, survival, adhesion and migration;66,67 thus multiple metastasis-related processes would be affected by Src inhibition. A major target is CTTN, which requires phosphorylation by Src at Y421 to regulate actin dynamics and promote cell motility, invasion and metastasis.52–54 Together, the multiple effects of Src inhibition would be anticipated to impair the metastasis process. Thus, the findings in this study identify MTSS1 as a novel Akt2-regulated gene and point to suppression of MTSS1 as a key step in the metastasis-promoting effects of this Akt isoform in CRC cells. Although loss of Akt2 also resulted in increased levels of other metastasis suppressors, including E-cadherin and Kiss1,28,68 our studies indicate that, at least in some contexts, the MTSS1-Src axis can exert a dominant role in the process.
Figure 8.
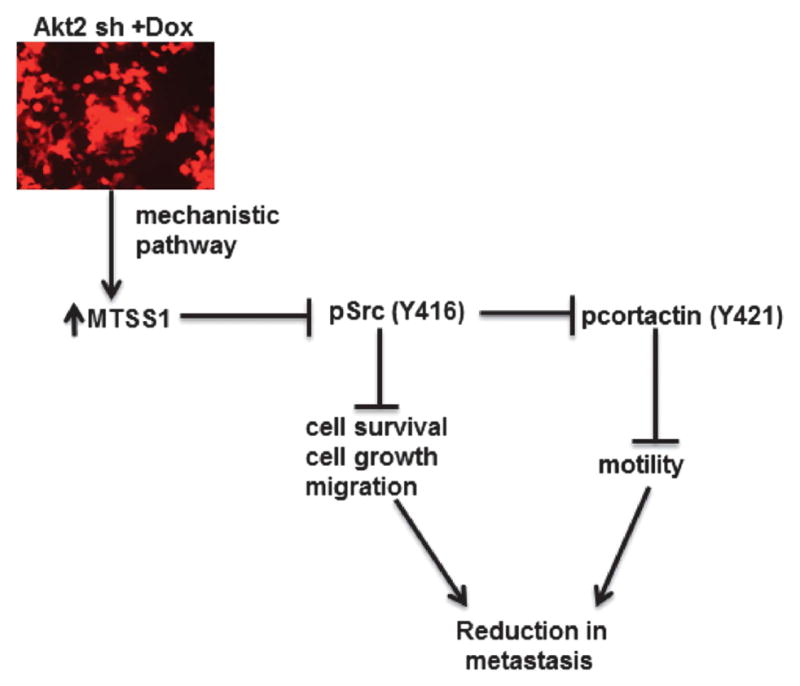
Proposed mechanism for the inhibitory effects of Akt2 deficiency on the metastatic program of colon cancer cells. Loss of Akt2 upregulates MTSS1, leading to inhibition of Src-mediated phosphorylation/activation of CTTN and reduced cell motility. Inhibition of Src also leads to a reduction in CRC growth and survival, as previously described by others.66,67 Together, these effects impair the metastatic capacity of CRC in vivo.
MATERIALS AND METHODS
Cell lines and reagents
GEO69 and CBS70 CRC cells were cultured in serum-free, growth factor-defined medium (SF) consisting of McCoy’s 5A with pyruvate, vitamins, amino acids and antibiotics (SM) supplemented with 10 ng/ml epidermal growth factor, 20 μg/ml insulin and 4 μg/ml transferrin at 37 °C in a humidified atmosphere of 6% CO2. These cell lines are 100% invasive and 50–65% metastatic.71 Unless otherwise indicated, all the in vitro experiments were performed under growth factor deprivation stress conditions (McCoy’s 5A with pyruvate, vitamins, amino acids and antibiotics). This experimental approach was used in order to induce stress in the cells, as the ability of cells to withstand stress is considered a critical factor for tumor formation and progression.72
Inducible knockdown of Akt isoforms
Akt isoforms were silenced using a Teton inducible system. Three different shRNAs in the TRIPZ DOX-inducible lentiviral vector were purchased from Thermo Scientific Open Biosystems (San Diego, CA, USA) for each Akt isoform, and the two that showed maximum efficiency of knockdown were used for experiments: Clone Id for Akt1- V3THS_358718 (shRNA#1); V3THS_358720 (shRNA#2); Clone Id for Akt2- V2THS_237948 (shRNA#1); V3THS_325558 (shRNA#2); and Clone Id for Akt3- V2THS_68871 (shRNA#1); V2THS_68872 (shRNA#2). Non-targeting shRNA was used as a control (Clone Id: RHS4743). The TRIPZ vector has a Red Florescent Protein (RFP) reporter, which is induced on addition of Dox allowing visual tracking of shRNA expression. Lentiviral vector generated in HEK293T cells was transduced into GFP-expressing GEO and CBS cells. Transduced cells were selected and maintained in puromycin (4 μg/ml).24 Expression of shRNA was induced by adding Dox (1 μg/ml) for 5 days.
shRNA-mediated knockdown of MTSS1
MTSS1 shRNA and non-silencing shRNA in the GIPZ lentiviral vector were purchased from Thermo Scientific Open Biosystems (Clone Id for MTSS1: V2THS_229344; Clone Id for non-targeting shRNA: RHS4346). Transduction of GEO-GFP Akt2 knockdown cells was performed according to the manufacturer’s instructions.
Cell viability/growth assays
GEO and CBS cells expressing non-targeting shRNA, Akt2-specific shRNA or Akt2 and MTSS1 shRNA were plated at a density of 3×10³ cells per well in 96 well plates. Dox (1 μg/ml) was added for 5 days and MTT assays were performed under growth factor deprivation stress conditions as described;73 cells were analyzed over 5 consecutive days.
DNA fragmentation assays
GEO and CBS cells were seeded in 96-well plates as for MTT assays and DNA fragmentation assays were performed after 5 days of Dox treatment under growth factor deprivation stress conditions. Assays were carried out using the Cell Death Detection ELISA PLUS kit (Roche, Indianapolis, IN, USA; Cat no.11920685001) according to the manufacturer’s protocol.72
Transwell migration assays
GEO cells (120 000 for 18 h and 80 000 for 36 h) in SM medium were plated in 12-micron pore transwell migration inserts (BD Biosciences, San Jose, CA, USA; Cat no. P1XP01250) and growth factor containing SF medium (700 μl) was added to the bottom chamber to drive migration. After incubation for 18 or 36 h, cells were fixed using 4% paraformaldehyde, stained with crystal violet, photographed and quantified by counting.
Staining for F-actin
Akt2 knockdown and Akt2/MTSS1 double knockdown GEO cells plated on coverslips were fixed in 4% paraformaldehyde for 30 min at room temperature, washed with PBS and permeabilized with 0.1% Triton X-100/PBS for 15 min. Cells were stained with the F-actin probe Alexa Fluor 633 Phalloidin (Molecular Probes, Thermoscientific, San Diego, CA, USA) at 10 units/200 μl for 30 min and washed with PBS. After 4’-6 diamino-2-phenylindole (DAPI) staining to detect the nucleus, coverslips were mounted on slides using VECTASHIELD anti-fade mounting medium (Vector Laboratories, Burlingame, CA, USA). Cells were visualized using an LSM 710 laser scanning confocal microscope (Carl Ziess GmbH, Oberkochen, Germany).
RNA isolation and quantitative real-time PCR
RNA was collected using the High Pure RNA Isolation kit (Roche, Cat no.11828665001).72 Two-step quantitative real-time PCR using TaqMan reagents and primers (Akt1: HS00178289_m1; Akt2: HS01086102_m1; Akt3: HS00987350_m1; Human GAPDH: 4352665; Mouse GAPDH: Mm99999915_g1) was performed according to the manufacturer's instructions (Applied Biosystems, Foster City, CA, USA). mRNA expression was normalized to levels of GAPDH.
RT2 Profiler PCR array analysis
cDNA samples were prepared from Dox-treated (5 days) GEO cells expressing non-targeting shRNA or Akt isoform-specific shRNA. Real-time PCR was performed using the Human Tumor Metastasis RT2 Profiler PCR array (SABiosciences, Cat no. 330231PAHS-0282ZA) in a C1000 Thermal Cycler (Bio-Rad, Hercules, CA, USA) according to the manufacturer’s instructions. Data were normalized to GAPDH levels by the ΔΔCt method. A two-fold induction cut-off was used for selection of differentially expressed genes.
Western blot analysis
Cells were lysed in 50 mmol/l Tris-HCl (pH 7.4) containing 150 mmol/l NaCl, 0.5% NP40, 50 mmol/l NaF, 1 mmol/l NaVO3, 1 mmol/l phenylmethylsulfonyl fluoride, 1 mmol/l DTT, 25 μg/ml aprotinin, 25 μg/ml trypsin inhibitor and 25 μg/ml leupeptin. Protein concentration was measured by bicinchoninic acid assay (Pierce, Thermoscientific) using a Biotek 96-well plate reader. Cell lysates (30 μg) were subjected to SDS–polyacrylamide gel electrophoresis, electrophoretically transferred to nitrocellulose membrane (GE Healthcare Bio-Sciences, Pittsburgh, PA, USA), and blocked in Tris-buffered saline (TBS) containing 5% non-fat dried milk (TBS/milk) for 60 min at 37°C. The membrane was incubated with primary antibody in TBS/0.1% Tween overnight at 4 °C followed by horseradish peroxidase-conjugated secondary antibody (GE Healthcare Bio-Sciences) at 1:1000 for 1 h at room temperature. Antibodies used in this study are listed in Supplementary Table 1.
Orthotopic implantation studies
All experiments involving animals were approved by the University of Nebraska Medical Center Institutional Animal Care and Use Committee (IACUC no. 07-047-08-FC). Three-to-five-week old male athymic nude mice were purchased from the NCI. Orthotopic implantation was performed as described.22–26 Briefly, GFP-labeled GEO cells (7 × 10⁶) transduced with non-targeting shRNA, Akt1 shRNA#2 or Akt2 shRNA#2 were subcutaneously injected onto the dorsal surfaces of male athymic nude mice. Once xenografts were established, tumors were excised and minced into 1-mm3 pieces. Two pieces were then orthotopically implanted into the cecum of another athymic nude mouse. For operative procedures, animals were anesthetized by isoflurane inhalation. A 1-cm laparotomy was performed and the cecum and ascending colon were exteriorized. Using × 7 magnification and microsurgical techniques, the serosa was disrupted in two locations and pieces of xenograft were subserosally implanted using an 8–0 nylon suture. The bowel was then returned to the peritoneal cavity and the abdomen was closed with 5–0 vicryl suture. The procedure was carried out on 25 animals per group; however due to the complexity of the surgery, only 17–22 mice per group survived the procedure or immediate postoperative period. As death occurred as a result of the operative procedure and was, therefore, random across groups, this loss of animals did not affect subsequent statistical analyses. Six weeks following orthotopic tumor implantation, Dox (2 mg/ml) was introduced in the drinking water for 3 weeks. Animals were then killed and organs were imaged using Light Tools imager (Ushio Inc., Tokyo, Japan), fixed in buffered 10% formalin, and embedded in paraffin. Metastases were determined by histological evaluation of liver lobes as described.71,72
Terminal deoxynucleotidyl transferase-mediated dUTP nick end-labeling assays
Paraffin sections (4 μm) of primary tumors were stained using the Apotag TUNEL assay kit (Millipore, Temecula, CA, USA; Cat no.S7101). Apoptotic rates were determined by counting the number of positively stained apoptotic bodies in 10 randomly selected fields per slide at × 40 magnification. The ratio of the average number of apoptotic cells to the total number of cells counted was used to determine % TUNEL positive cells.24,72
Ki67 staining
Paraffin sections (4 μm) of primary tumors were immunostained for Ki67, a non-histone nuclear antigen present in late G1, G2 and S phase of the cell cycle but absent in G0. Proliferation rate was determined quantitatively using Definiens software (public domain software, Cambridge, MA, USA). Ten histologically similar fields were selected for analysis per sample.24,72
Statistical analysis
Student’s t-test analysis was performed using Graph pad 5.0 software (Seattle, WA, USA). A P-value <0.05 was considered significant. For transwell migration assays, the number of cells that had passed through the membrane was determined in five random fields per well, and the average number of migrating cells per well was determined. Three wells were analyzed for each condition. For in vitro studies, at least three independent sets of experiments were performed. T-tests were used to compare log2 gene expression in samples of colon tumor and normal tissue from The Cancer Genome Atlas database. Pearson correlation coefficient was calculated for expression data on the log2 scale. On the basis of an expected 25 metastases per tumor-bearing liver with a s.d. of 11 for control mice in the orthotopic model, 15 mice per group achieves a power of 82% to detect a 50% reduction in metastatic tumor burden in test mice, with an alpha of 0.05 using a two-sided Mann–Whitney U-test. The implantation procedure results in loss of animals due to surgical complications; thus, 25 mice were initially assigned to each group to ensure sufficient surviving numbers for statistical analysis. Mann–Whitney U-test analysis of statistical differences between numbers of metastases in livers of mice was performed using SAS/STAT software (Cary, NC, USA). Loss of animals due to the operative procedure was assumed to be random across the groups; therefore, animals that died during or immediately after surgery were omitted from this analysis.
Supplementary Material
Acknowledgments
This work was supported by NIH R01 grants CA038173 and CA054807 to MGB, by DK60632 to JDB and by UNMC Cancer Center Support Grant CA036727. We thank Katie Bailey for assistance with animal surgeries; Dr Adrian Black for critical reading of the manuscript and many helpful discussions, as well as analysis of Oncomine data; Drs Babu Guda and Xiao Peng (Bioinformatics and Systems Biology Core, UNMC) for help with The Cancer Genome Atlas database, and the Confocal Imaging and Histology Cores at UNMC for assistance with tissue processing and microscopy.
Footnotes
CONFLICT OF INTEREST
The authors declare no conflict of interest.
AUTHOR CONTRIBUTIONS
Conception and design: Agarwal E, Chowdhury S and Brattain MG; development of methodology: Agarwal E; analysis and interpretation of data: Agarwal E, Chowdhury S, Brattain MG, Wang JJ and Black JD; statistical analysis of TCGA data sets: Smith LM; writing, review and/or revision of the manuscript: Agarwal E, Chowdhury S, Brattain MG, Wang JJ and Black JD; animal surgeries and dissection of animals: Agarwal E and Robb C.
Supplementary Information accompanies this paper on the Oncogene website (http://www.nature.com/onc)
References
- 1.Jemal A, Murray T, Ward E, Samuels A, Tiwari RC, Ghafoor A, et al. Cancer statistics, 2005. CA Cancer J Clin. 2005;55:10–30. doi: 10.3322/canjclin.55.1.10. [DOI] [PubMed] [Google Scholar]
- 2.Jin K, Gao W, Lu Y, Lan H, Teng L, Cao F. Mechanisms regulating colorectal cancer cell metastasis into liver (Review) Oncol Lett. 2012;3:11–15. doi: 10.3892/ol.2011.432. [DOI] [PMC free article] [PubMed] [Google Scholar]
- 3.National Cancer Institute. SEER Stat Fact Sheets: Colon and Rectum Cancer. Surveillance, Epidemiology and End Results Program [online] 2010 [Google Scholar]
- 4.Weigelt B, Peterse JL, van 't Veer LJ. Breast cancer metastasis: markers and models. Nat Rev Cancer. 2005;5:591–602. doi: 10.1038/nrc1670. [DOI] [PubMed] [Google Scholar]
- 5.Kienast Y, von Baumgarten L, Fuhrmann M, Klinkert WE, Goldbrunner R, Herms J, et al. Real-time imaging reveals the single steps of brain metastasis formation. Nat Med. 2009;16:116–122. doi: 10.1038/nm.2072. [DOI] [PubMed] [Google Scholar]
- 6.Grabinski N, Bartkowiak K, Grupp K, Brandt B, Pantel K, Jucker M. Distinct functional roles of Akt isoforms for proliferation, survival, migration and EGF-mediated signalling in lung cancer derived disseminated tumor cells. Cell Signal. 2011;23:1952–1960. doi: 10.1016/j.cellsig.2011.07.003. [DOI] [PubMed] [Google Scholar]
- 7.Salmena L, Carracedo A, Pandolfi PP. Tenets of PTEN tumor suppression. Cell. 2008;133:403–414. doi: 10.1016/j.cell.2008.04.013. [DOI] [PubMed] [Google Scholar]
- 8.Manning BD, Cantley LC. AKT/PKB signaling: navigating downstream. Cell. 2007;129:1261–1274. doi: 10.1016/j.cell.2007.06.009. [DOI] [PMC free article] [PubMed] [Google Scholar]
- 9.Sarbassov DD, Guertin DA, Ali SM, Sabatini DM. Phosphorylation and regulation of Akt/PKB by the rictor-mTOR complex. Science. 2005;307:1098–1101. doi: 10.1126/science.1106148. [DOI] [PubMed] [Google Scholar]
- 10.Stokoe D, Stephens LR, Copeland T, Gaffney PR, Reese CB, Painter GF, et al. Dual role of phosphatidylinositol-3,4,5-trisphosphate in the activation of protein kinase B. Science. 1997;277:567–570. doi: 10.1126/science.277.5325.567. [DOI] [PubMed] [Google Scholar]
- 11.Brognard J, Sierecki E, Gao T, Newton AC. PHLPP and a second isoform, PHLPP2, differentially attenuate the amplitude of Akt signaling by regulating distinct Akt isoforms. Mol Cell. 2007;25:917–931. doi: 10.1016/j.molcel.2007.02.017. [DOI] [PubMed] [Google Scholar]
- 12.Gewinner C, Wang ZC, Richardson A, Teruya-Feldstein J, Etemadmoghadam D, Bowtell D, et al. Evidence that inositol polyphosphate 4-phosphatase type II is a tumor suppressor that inhibits PI3K signaling. Cancer Cell. 2009;16:115–125. doi: 10.1016/j.ccr.2009.06.006. [DOI] [PMC free article] [PubMed] [Google Scholar]
- 13.Cho H, Mu J, Kim JK, Thorvaldsen JL, Chu Q, Crenshaw EB, 3rd, et al. Insulin resistance and a diabetes mellitus-like syndrome in mice lacking the protein kinase Akt2 (PKB beta) Science. 2001;292:1728–1731. doi: 10.1126/science.292.5522.1728. [DOI] [PubMed] [Google Scholar]
- 14.Easton RM, Cho H, Roovers K, Shineman DW, Mizrahi M, Forman MS, et al. Role for Akt3/protein kinase Bgamma in attainment of normal brain size. Mol Cell Biol. 2005;25:1869–1878. doi: 10.1128/MCB.25.5.1869-1878.2005. [DOI] [PMC free article] [PubMed] [Google Scholar]
- 15.Agarwal E, Brattain MG, Chowdhury S. Cell survival and metastasis regulation by Akt signaling in colorectal cancer. Cell Signal. 2013;25:1711–1719. doi: 10.1016/j.cellsig.2013.03.025. [DOI] [PMC free article] [PubMed] [Google Scholar]
- 16.Irie HY, Pearline RV, Grueneberg D, Hsia M, Ravichandran P, Kothari N, et al. Distinct roles of Akt1 and Akt2 in regulating cell migration and epithelial-mesenchymal transition. J Cell Biol. 2005;171:1023–1034. doi: 10.1083/jcb.200505087. [DOI] [PMC free article] [PubMed] [Google Scholar]
- 17.Yoeli-Lerner M, Yiu GK, Rabinovitz I, Erhardt P, Jauliac S, Toker A. Akt blocks breast cancer cell motility and invasion through the transcription factor NFAT. Mol Cell. 2005;20:539–550. doi: 10.1016/j.molcel.2005.10.033. [DOI] [PubMed] [Google Scholar]
- 18.Chau NM, Ashcroft M. Akt2: a role in breast cancer metastasis. Breast Cancer Res. 2004;6:55–57. doi: 10.1186/bcr739. [DOI] [PMC free article] [PubMed] [Google Scholar]
- 19.Ericson K, Gan C, Cheong I, Rago C, Samuels Y, Velculescu VE, et al. Genetic inactivation of AKT1, AKT2, and PDPK1 in human colorectal cancer cells clarifies their roles in tumor growth regulation. Proc Natl Acad Sci USA. 2010;107:2598–2603. doi: 10.1073/pnas.0914018107. [DOI] [PMC free article] [PubMed] [Google Scholar]
- 20.Nakatani K, Thompson DA, Barthel A, Sakaue H, Liu W, Weigel RJ, et al. Up-regulation of Akt3 in estrogen receptor-deficient breast cancers and androgen-independent prostate cancer lines. J Biol Chem. 1999;274:21528–21532. doi: 10.1074/jbc.274.31.21528. [DOI] [PubMed] [Google Scholar]
- 21.Rychahou PG, Kang J, Gulhati P, Doan HQ, Chen LA, Xiao SY, et al. Akt2 over-expression plays a critical role in the establishment of colorectal cancer metastasis. Proc Natl Acad Sci USA. 2008;105:20315–20320. doi: 10.1073/pnas.0810715105. [DOI] [PMC free article] [PubMed] [Google Scholar]
- 22.Chowdhury S, Howell GM, Rajput A, Teggart CA, Brattain LE, Weber HR, et al. Identification of a novel TGFbeta/PKA signaling transduceome in mediating control of cell survival and metastasis in colon cancer. PLoS One. 2011;6:e19335. doi: 10.1371/journal.pone.0019335. [DOI] [PMC free article] [PubMed] [Google Scholar]
- 23.Chowdhury S, Ongchin M, Sharratt E, Dominguez I, Wang J, Brattain MG, et al. Intra-tumoral heterogeneity in metastatic potential and survival signaling between iso-clonal HCT116 and HCT116b human colon carcinoma cell lines. PLoS One. 2013;8:e60299. doi: 10.1371/journal.pone.0060299. [DOI] [PMC free article] [PubMed] [Google Scholar]
- 24.Geng L, Chaudhuri A, Talmon G, Wisecarver JL, Are C, Brattain M, et al. MicroRNA-192 suppresses liver metastasis of colon cancer. Oncogene. 2013;33:5332–5340. doi: 10.1038/onc.2013.478. [DOI] [PMC free article] [PubMed] [Google Scholar]
- 25.Leiphrakpam PD, Rajput A, Mathiesen M, Agarwal E, Lazenby AJ, Are C, et al. Ezrin expression and cell survival regulation in colorectal cancer. Cell Signal. 2014;26:868–879. doi: 10.1016/j.cellsig.2014.01.014. [DOI] [PMC free article] [PubMed] [Google Scholar]
- 26.Wang J, Rajput A, Kan JL, Rose R, Liu XQ, Kuropatwinski K, et al. Knockdown of Ron kinase inhibits mutant phosphatidylinositol 3-kinase and reduces metastasis in human colon carcinoma. J Biol Chem. 2009;284:10912–10922. doi: 10.1074/jbc.M809551200. [DOI] [PMC free article] [PubMed] [Google Scholar]
- 27.Williams B, Schneider RJ, Jamal S. Akt and PI3K-dependent but CREB-independent upregulation of MCAM by endothelin-3 in human melanocytes. Melanoma Res. 2014;24:404–407. doi: 10.1097/CMR.0000000000000077. [DOI] [PubMed] [Google Scholar]
- 28.Navenot JM, Fujii N, Peiper SC. KiSS1 metastasis suppressor gene product induces suppression of tyrosine kinase receptor signaling to Akt, tumor necrosis factor family ligand expression, and apoptosis. Mol Pharmacol. 2009;75:1074–1083. doi: 10.1124/mol.108.054270. [DOI] [PubMed] [Google Scholar]
- 29.Cheng GZ, Chan J, Wang Q, Zhang W, Sun CD, Wang LH. Twist transcriptionally up-regulates AKT2 in breast cancer cells leading to increased migration, invasion, and resistance to paclitaxel. Cancer Res. 2007;67:1979–1987. doi: 10.1158/0008-5472.CAN-06-1479. [DOI] [PubMed] [Google Scholar]
- 30.Du P, Ye L, Li H, Yang Y, Jiang WG. The tumour suppressive role of metastasis suppressor-1, MTSS1, in human kidney cancer, a possible connection with the SHH pathway. J Exp Ther Oncol. 2013;10:91–99. [PubMed] [Google Scholar]
- 31.Du P, Ye L, Ruge F, Yang Y, Jiang WG. Metastasis suppressor-1, MTSS1, acts as a putative tumour suppressor in human bladder cancer. Anticancer Res. 2011;31:3205–3212. [PubMed] [Google Scholar]
- 32.Xie F, Ye L, Chen J, Wu N, Zhang Z, Yang Y, et al. The impact of metastasis suppressor-1, MTSS1, on oesophageal squamous cell carcinoma and its clinical significance. J Transl Med. 2011;9:95. doi: 10.1186/1479-5876-9-95. [DOI] [PMC free article] [PubMed] [Google Scholar]
- 33.Zhou L, Li J, Shao QQ, Guo JC, Liang ZY, Zhou WX, et al. Expression and significances of MTSS1 in pancreatic cancer. Pathol Oncol Res. 2015;22:7–14. doi: 10.1007/s12253-015-9963-2. [DOI] [PubMed] [Google Scholar]
- 34.Fan H, Chen L, Zhang F, Quan Y, Su X, Qiu X, et al. MTSS1, a novel target of DNA methyltransferase 3B, functions as a tumor suppressor in hepatocellular carcinoma. Oncogene. 2011;31:2298–2308. doi: 10.1038/onc.2011.411. [DOI] [PubMed] [Google Scholar]
- 35.Mattila PK, Salminen M, Yamashiro T, Lappalainen P. Mouse MIM, a tissue-specific regulator of cytoskeletal dynamics, interacts with ATP-actin monomers through its C-terminal WH2 domain. J Biol Chem. 2003;278:8452–8459. doi: 10.1074/jbc.M212113200. [DOI] [PubMed] [Google Scholar]
- 36.Woodings JA, Sharp SJ, Machesky LM. MIM-B, a putative metastasis suppressor protein, binds to actin and to protein tyrosine phosphatase delta. Biochem J. 2003;371(Pt 2):463–471. doi: 10.1042/BJ20021962. [DOI] [PMC free article] [PubMed] [Google Scholar]
- 37.Bershteyn M, Atwood SX, Woo WM, Li M, Oro AE. MIM and cortactin antagonism regulates ciliogenesis and Hedgehog signaling. Dev Cell. 2010;19:270–283. doi: 10.1016/j.devcel.2010.07.009. [DOI] [PMC free article] [PubMed] [Google Scholar]
- 38.Skrzypczak M, Goryca K, Rubel T, Paziewska A, Mikula M, Jarosz D, et al. Modeling oncogenic signaling in colon tumors by multidirectional analyses of microarray data directed for maximization of analytical reliability. PLoS One. 2010;5:e0013091. doi: 10.1371/journal.pone.0013091. [DOI] [PMC free article] [PubMed] [Google Scholar]
- 39.Arboleda MJ, Lyons JF, Kabbinavar FF, Bray MR, Snow BE, Ayala R, et al. Over-expression of AKT2/protein kinase Bbeta leads to up-regulation of beta1 integrins, increased invasion, and metastasis of human breast and ovarian cancer cells. Cancer Res. 2003;63:196–206. [PubMed] [Google Scholar]
- 40.Wolmark N, Cruz I, Redmond CK, Fisher B, Fisher ER. Tumor size and regional lymph node metastasis in colorectal cancer. A preliminary analysis from the NSABP clinical trials. Cancer. 1983;51:1315–1322. doi: 10.1002/1097-0142(19830401)51:7<1315::aid-cncr2820510723>3.0.co;2-0. [DOI] [PubMed] [Google Scholar]
- 41.Lee YG, Macoska JA, Korenchuk S, Pienta KJ. MIM, a potential metastasis suppressor gene in bladder cancer. Neoplasia. 2002;4:291–294. doi: 10.1038/sj.neo.7900231. [DOI] [PMC free article] [PubMed] [Google Scholar]
- 42.Jahid S, Sun J, Edwards RA, Dizon D, Panarelli NC, Milsom JW, et al. miR-23a promotes the transition from indolent to invasive colorectal cancer. Cancer Discov. 2012;2:540–553. doi: 10.1158/2159-8290.CD-11-0267. [DOI] [PMC free article] [PubMed] [Google Scholar]
- 43.Li J, Chen Y, Guo X, Zhou L, Jia Z, Tang Y, et al. Inhibition of miR-15b decreases cell migration and metastasis in colorectal cancer. Tumour Biol. 2016;37:8765–8773. doi: 10.1007/s13277-015-4396-9. [DOI] [PubMed] [Google Scholar]
- 44.Wang Y, Liu J, Smith E, Zhou K, Liao J, Yang GY, et al. Downregulation of missing in metastasis gene (MIM) is associated with the progression of bladder transitional carcinomas. Cancer Invest. 2007;25:79–86. doi: 10.1080/07357900701205457. [DOI] [PubMed] [Google Scholar]
- 45.Wu W, Wang Z, Yang P, Yang J, Liang J, Chen Y, et al. MicroRNA-135b regulates metastasis suppressor 1 expression and promotes migration and invasion in colorectal cancer. Mol Cell Biochem. 2013;388:249–259. doi: 10.1007/s11010-013-1916-z. [DOI] [PubMed] [Google Scholar]
- 46.Zhou W, Li X, Liu F, Xiao Z, He M, Shen S, et al. MiR-135a promotes growth and invasion of colorectal cancer via metastasis suppressor 1 in vitro. Acta Biochim Biophys Sin. 2012;44:838–846. doi: 10.1093/abbs/gms071. [DOI] [PubMed] [Google Scholar]
- 47.Wang D, Xu MR, Wang T, Li T, Zhu J. MTSS1 overexpression correlates with poor prognosis in colorectal cancer. J Gastrointest Surg. 2011;15:1205–1212. doi: 10.1007/s11605-011-1546-2. [DOI] [PubMed] [Google Scholar]
- 48.Schemionek M, Herrmann O, Reher MM, Chatain N, Schubert C, Costa IG, et al. Mtss1 is a critical epigenetically regulated tumor suppressor in CML. Leukemia. 2015;30:823–832. doi: 10.1038/leu.2015.329. [DOI] [PubMed] [Google Scholar]
- 49.Schemionek M, Kharabi Masouleh B, Klaile Y, Krug U, Hebestreit K, Schubert C, et al. Identification of the adapter molecule MTSS1 as a potential oncogene-specific tumor suppressor in acute myeloid leukemia. PLoS One. 2015;10:e0125783. doi: 10.1371/journal.pone.0125783. [DOI] [PMC free article] [PubMed] [Google Scholar]
- 50.Mertz KD, Pathria G, Wagner C, Saarikangas J, Sboner A, Romanov J, et al. MTSS1 is a metastasis driver in a subset of human melanomas. Nat Commun. 2014;5:3465. doi: 10.1038/ncomms4465. [DOI] [PubMed] [Google Scholar]
- 51.MacGrath SM, Koleske AJ. Cortactin in cell migration and cancer at a glance. J Cell Sci. 2012;125(Pt 7):1621–1626. doi: 10.1242/jcs.093781. [DOI] [PMC free article] [PubMed] [Google Scholar]
- 52.Kruchten AE, Krueger EW, Wang Y, McNiven MA. Distinct phospho-forms of cortactin differentially regulate actin polymerization and focal adhesions. Am J Physiol Cell Physiol. 2008;295:C1113–C1122. doi: 10.1152/ajpcell.00238.2008. [DOI] [PMC free article] [PubMed] [Google Scholar]
- 53.Lin J, Liu J, Wang Y, Zhu J, Zhou K, Smith N, et al. Differential regulation of cortactin and N-WASP-mediated actin polymerization by missing in metastasis (MIM) protein. Oncogene. 2005;24:2059–2066. doi: 10.1038/sj.onc.1208412. [DOI] [PubMed] [Google Scholar]
- 54.Lua BL, Low BC. Cortactin phosphorylation as a switch for actin cytoskeletal network and cell dynamics control. FEBS Lett. 2005;579:577–585. doi: 10.1016/j.febslet.2004.12.055. [DOI] [PubMed] [Google Scholar]
- 55.Chaudhary F, Lucito R, Tonks NK. Missing-in-metastasis regulates cell motility and invasion via PTPdelta-mediated changes in SRC activity. Biochem J. 2014;465:89–101. doi: 10.1042/BJ20140573. [DOI] [PMC free article] [PubMed] [Google Scholar]
- 56.Iliopoulos D, Polytarchou C, Hatziapostolou M, Kottakis F, Maroulakou IG, Struhl K, et al. MicroRNAs differentially regulated by Akt isoforms control EMT and stem cell renewal in cancer cells. Sci Signal. 2009;2:ra62. doi: 10.1126/scisignal.2000356. [DOI] [PMC free article] [PubMed] [Google Scholar]
- 57.Martin EC, Bratton MR, Zhu Y, Rhodes LV, Tilghman SL, Collins-Burow BM, et al. Insulin-like growth factor-1 signaling regulates miRNA expression in MCF-7 breast cancer cell line. PLoS One. 2012;7:e49067. doi: 10.1371/journal.pone.0049067. [DOI] [PMC free article] [PubMed] [Google Scholar]
- 58.O'Day E, Lal A. MicroRNAs and their target gene networks in breast cancer. Breast Cancer Res. 2010;12:201. doi: 10.1186/bcr2484. [DOI] [PMC free article] [PubMed] [Google Scholar]
- 59.Hua Z, Lv Q, Ye W, Wong CK, Cai G, Gu D, et al. MiRNA-directed regulation of VEGF and other angiogenic factors under hypoxia. PLoS One. 2006;1:e116. doi: 10.1371/journal.pone.0000116. [DOI] [PMC free article] [PubMed] [Google Scholar]
- 60.Xu M, Mo YY. The Akt-associated microRNAs. Cell Mol Life Sci. 2012;69:3601–3612. doi: 10.1007/s00018-012-1129-8. [DOI] [PMC free article] [PubMed] [Google Scholar]
- 61.Sachdeva M, Zhu S, Wu F, Wu H, Walia V, Kumar S, et al. p53 represses c-Myc through induction of the tumor suppressor miR-145. Proc Natl Acad Sci USA. 2009;106:3207–3212. doi: 10.1073/pnas.0808042106. [DOI] [PMC free article] [PubMed] [Google Scholar]
- 62.La Rocca G, Badin M, Shi B, Xu SQ, Deangelis T, Sepp-Lorenzinoi L, et al. Mechanism of growth inhibition by MicroRNA 145: the role of the IGF-I receptor signaling pathway. J Cell Physiol. 2009;220:485–491. doi: 10.1002/jcp.21796. [DOI] [PubMed] [Google Scholar]
- 63.Valeri N, Braconi C, Gasparini P, Murgia C, Lampis A, Paulus-Hock V, et al. MicroRNA-135b promotes cancer progression by acting as a downstream effector of oncogenic pathways in colon cancer. Cancer Cell. 2014;25:469–483. doi: 10.1016/j.ccr.2014.03.006. [DOI] [PMC free article] [PubMed] [Google Scholar]
- 64.Loberg RD, Neeley CK, Adam-Day LL, Fridman YSt, John LN, Nixdorf S, et al. Differential expression analysis of MIM (MTSS1) splice variants and a functional role of MIM in prostate cancer cell biology. Int J Oncol. 2005;26:1699–1705. [PubMed] [Google Scholar]
- 65.Parr C, Jiang WG. Metastasis suppressor 1 (MTSS1) demonstrates prognostic value and anti-metastatic properties in breast cancer. Eur J Cancer. 2009;45:1673–1683. doi: 10.1016/j.ejca.2009.02.019. [DOI] [PubMed] [Google Scholar]
- 66.Summy JM, Gallick GE. Src family kinases in tumor progression and metastasis. Cancer Metastasis Rev. 2003;22:337–358. doi: 10.1023/a:1023772912750. [DOI] [PubMed] [Google Scholar]
- 67.Irby RB, Yeatman TJ. Role of Src expression and activation in human cancer. Oncogene. 2000;19:5636–5642. doi: 10.1038/sj.onc.1203912. [DOI] [PubMed] [Google Scholar]
- 68.Furbert-Harris PM, Parish-Gause D, Hunter KA, Vaughn TR, Howland C, Okomo-Awich J, et al. Activated eosinophils upregulate the metastasis suppressor molecule E-cadherin on prostate tumor cells. Cell Mol Biol (Noisy-le-grand) 2003;49:1009–1016. [PubMed] [Google Scholar]
- 69.Wang J, Han W, Zborowska E, Liang J, Wang X, Willson JK, et al. Reduced expression of transforming growth factor beta type I receptor contributes to the malignancy of human colon carcinoma cells. J Biol Chem. 1996;271:17366–17371. doi: 10.1074/jbc.271.29.17366. [DOI] [PubMed] [Google Scholar]
- 70.Ye SC, Foster JM, Li W, Liang J, Zborowska E, Venkateswarlu S, et al. Contextual effects of transforming growth factor beta on the tumorigenicity of human colon carcinoma cells. Cancer Res. 1999;59:4725–4731. [PubMed] [Google Scholar]
- 71.Guo XN, Rajput A, Rose R, Hauser J, Beko A, Kuropatwinski K, et al. Mutant PIK3CA-bearing colon cancer cells display increased metastasis in an orthotopic model. Cancer Res. 2007;67:5851–5858. doi: 10.1158/0008-5472.CAN-07-0049. [DOI] [PubMed] [Google Scholar]
- 72.Wang J, Yang L, Yang J, Kuropatwinski K, Wang W, Liu XQ, et al. Transforming growth factor beta induces apoptosis through repressing the phosphoinositide 3-kinase/AKT/surviving pathway in colon cancer cells. Cancer Res. 2008;68:3152–3160. doi: 10.1158/0008-5472.CAN-07-5348. [DOI] [PubMed] [Google Scholar]
- 73.Agarwal E, Chaudhuri A, Leiphrakpam PD, Haferbier KL, Brattain MG, Chowdhury S. Akt inhibitor MK-2206 promotes anti-tumor activity and cell death by modulation of AIF and Ezrin in colorectal cancer. BMC Cancer. 2014;14:145. doi: 10.1186/1471-2407-14-145. [DOI] [PMC free article] [PubMed] [Google Scholar]
Associated Data
This section collects any data citations, data availability statements, or supplementary materials included in this article.